

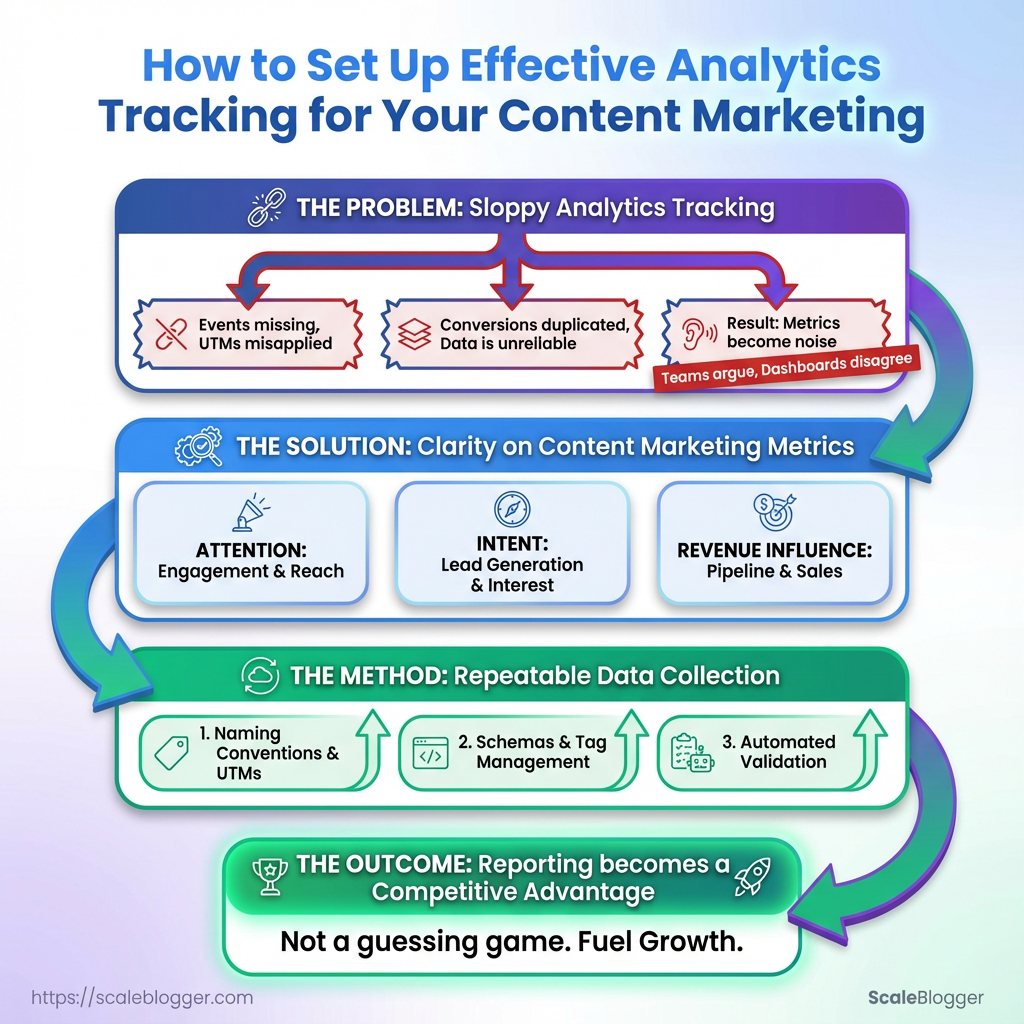
Effective analytics tracking for content helps you understand what’s working, where visitors come from, how they engage with your content, and which pages contribute to conversions. Without reliable tracking, it’s easy to make content decisions based on assumptions instead of actual performance data.
A good analytics setup doesn’t need to be complicated. By defining the right metrics, configuring your tracking tools correctly, and connecting content performance to meaningful business goals, you can identify what deserves improvement and where to focus your content strategy.
This guide explains how to set up effective analytics tracking and turn your content data into actionable insights.
Key Takeaway: Before diving into analytics, ensure the right accounts and permission levels are set up. Start by making sure the right accounts and permission levels are in place—without them the… Start by making sure the right accounts and permission levels are…
Before diving into analytics, ensure the right accounts and permission levels are set up.
Prerequisites and What You’ll Need
Start by making sure the right accounts and permission levels are in place—without them the analytics tracking and content workflows stall before they begin. At a minimum, ensure you have administrative or editor access for necessary configurations. Also, provide credentialed viewer access for stakeholders who only need to see reports. Assemble the tools next: core measurement (site analytics and tag manager), the CMS admin account for content changes, and a visualization layer for reporting.
Optional platforms like a CDP or advanced SEO automation speed up work but aren’t blockers.
Accounts, Tools, and Access: what to prepare
- Google account(s): Primary login that owns or can be granted access to GA4 and Tag Manager.
- CMS Admin: Editor or administrator access in your CMS (WordPress, Contentful, etc.) for template/metadata edits.
- GA4 Property: Editor or Administrator role to configure events and conversions.
- Google Tag Manager: Publish permission to add/update tags and triggers.
- Reporting access: Viewer or Editor in Looker Studio (Google Data Studio) for dashboards.
- Optional – CDP: Access to the customer data platform (e.g., Segment, RudderStack) with integration permissions for server-side event routing.
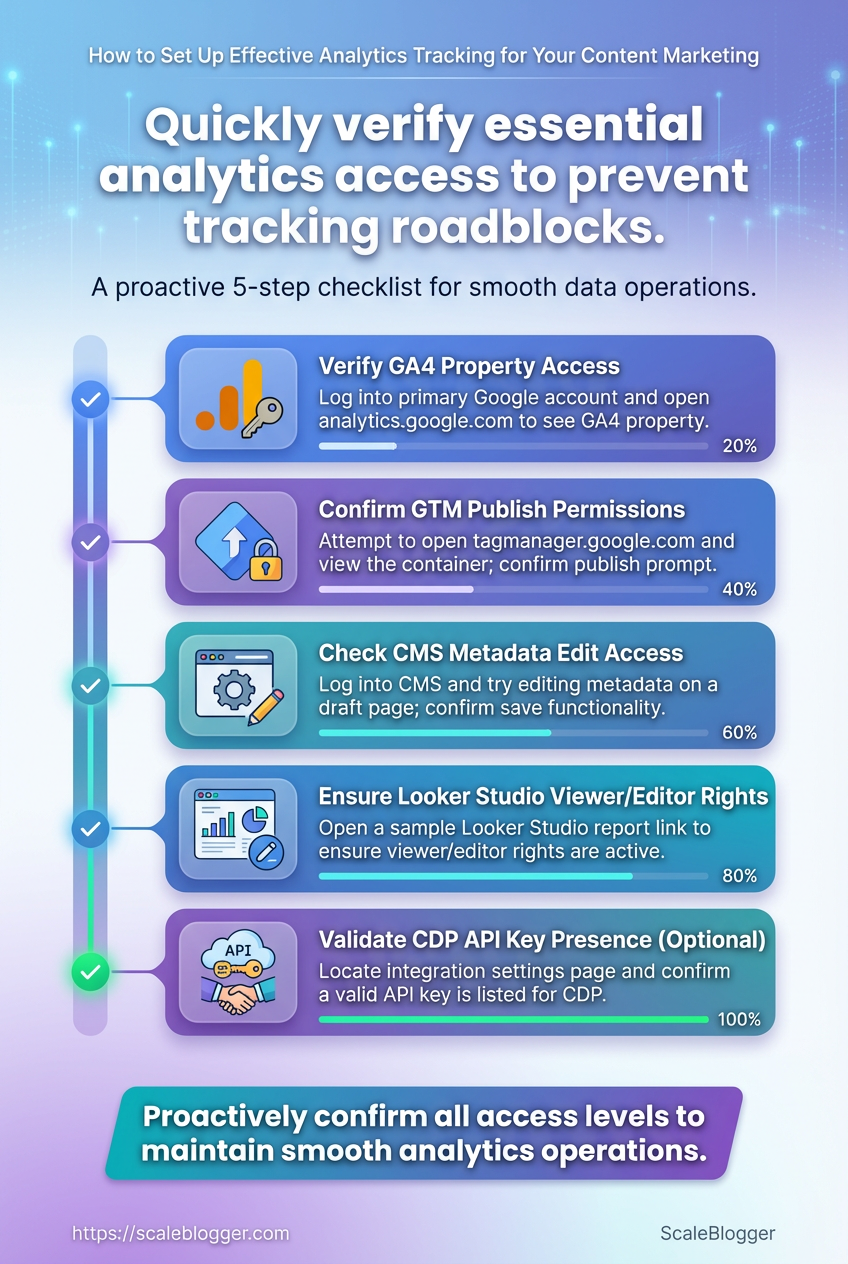
Quick verification steps to confirm access
- Log into the primary Google account and open
https://analytics.google.comto confirm you can see the GA4 property. - Attempt to open
https://tagmanager.google.comand view the container; if prompted to publish, you have publish permissions. - Log into the CMS and try editing metadata on a single draft page—if you can save, CMS access is sufficient.
- Open the Looker Studio link for a sample report to ensure viewer/editor rights are active.
- For CDP setups, verify API key presence by locating the integration settings page and confirming a valid key is listed.
Tools that add value (optional but high ROI)
- CDP or server-side tagging: Improves data accuracy and reduces ad-blocker loss.
- SEO automation platforms: Speed content topic discovery and help measure content marketing metrics.
- A/B testing tool: Validates content or UX changes tied to conversions and engagement.
Quick reference of tools, required permissions, and why each is needed
Table: Prerequisites and What You’ll Need — Tool, Required Permission, Why It’s Needed & more
| Tool | Required Permission | Why It’s Needed | Setup Time |
|---|---|---|---|
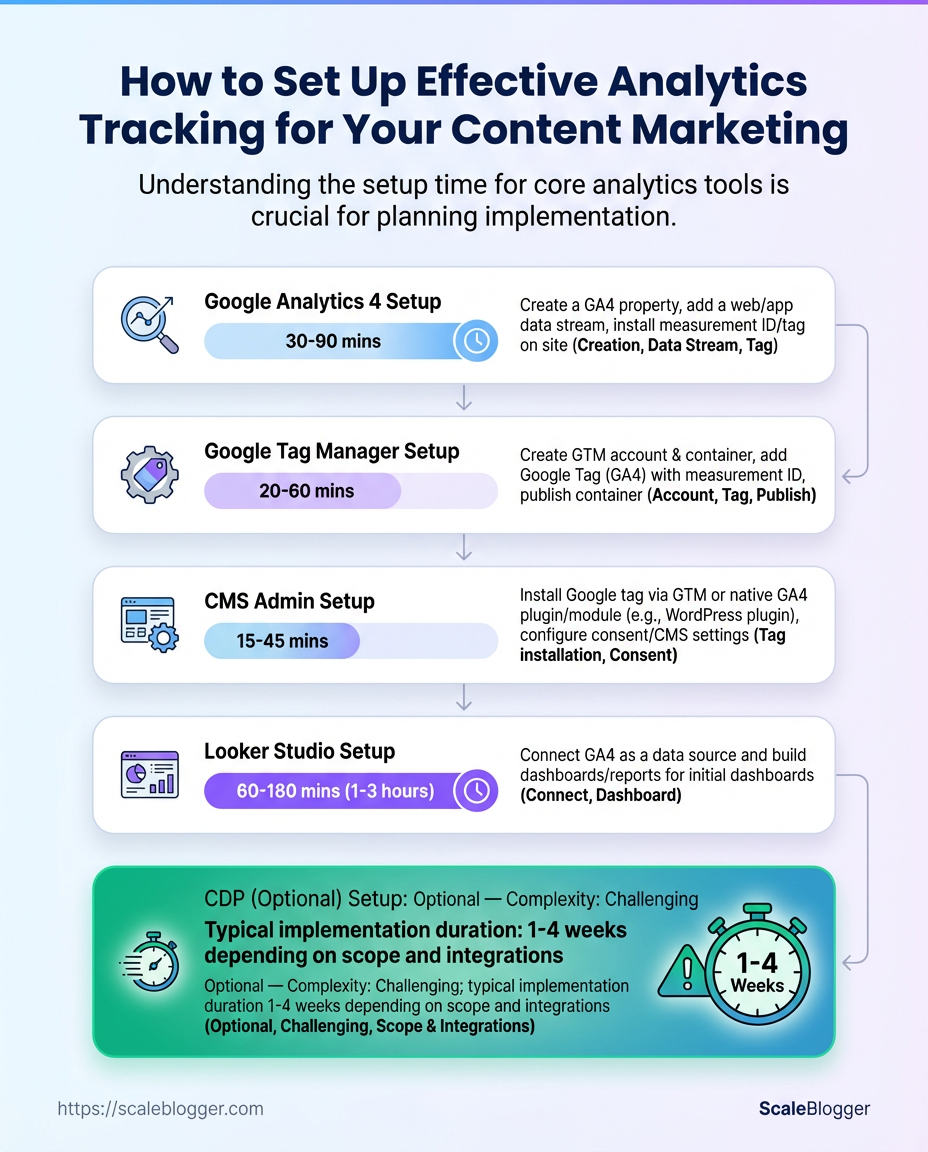
| Google Analytics 4 | Editor or Administrator | analytics tracking and event/conversion configuration | 30–90 minutes |
| Google Tag Manager | Publish permission | Centralized tag deployment and client-side tracking control | 20–60 minutes |
| CMS Admin | Editor or Admin account | Implement tracking snippets, meta fields, and content template changes | 15–45 minutes |
| Looker Studio (Google Data Studio) | Viewer/Editor access | Build dashboards for content marketing metrics and stakeholder reporting | 30–120 minutes |
| Customer Data Platform (CDP) – optional | Integration/API admin | Consolidate user data, server-side routing, improve data collection strategies | 1–4 hours |
Key insight: These five systems form the core measurement stack for reliable analytics tracking. GA4 and Tag Manager are the minimum; adding a CDP and Looker Studio reduces data loss and speeds decision-making for content teams.
Having these accounts and permission checks done ahead of time keeps setup sessions focused and avoids back-and-forth with IT. Get access squared away first, then the technical work flows much faster. If there’s a pause getting permissions, document the gaps and proceed with components you can control while waiting.
Define Tracking Goals and Metrics
Turn business goals into measurable signals right away. Select a few Primary Metrics that are directly related to revenue, awareness, or customer retention. Then add supporting events and dimensions to explain changes in those metrics. The goal is to shift from vanity metrics to actionable signals.
Focus on events that show user intent, dimensions that break down behavior, and thresholds that prompt optimization efforts.
How to map objectives to metrics
- Identify the business objective and the stakeholder who owns it.
- Choose a Primary Metric that reflects success for that objective (revenue, leads, active users, etc.).
- Define concrete
Event / Signalnames you’ll track (e.g.,form_submit,newsletter_optin,scroll_depth_50).
- Pick dimensions to slice the metric (traffic_source, content_topic, device, campaign_id).
- Set a realistic Success Threshold based on past performance or industry norms so you can flag when to scale or change tactics.
Common features of a good metric:
- Actionable: leads to a decision or experiment.
- Reliable: consistently measurable across systems.
- Attributable: can be tied back to content, campaign, or channel.
Practical examples and context
- Brand Awareness needs broad signals like reach and viewability but pairs best with engagement rates (time on page, scroll).
- Lead Generation should focus on conversions and conversion rate by source. Track
form_submitandcontact_clickas definitive events. - Engagement benefits from content-level dimensions: author, topic cluster, and
scroll_depthevents to distinguish casual visits from meaningful reads.
A tracking matrix mapping objectives to metrics, events, dimensions, and success thresholds
Table: Define Tracking Goals and Metrics — Business Objective, Primary Metric, Event / Signal & more
| Business Objective | Primary Metric | Event / Signal | Dimension | Success Threshold |
|---|---|---|---|---|
| Brand Awareness | Impressions / Unique Users | page_view, session_start | traffic_source, campaign_id | 20% QoQ increase in unique users |
| Lead Generation | Leads (form submits) | form_submit, ebook_download | content_topic, traffic_source | 2–4% conversion rate by paid channel |
| Engagement | Engaged Sessions | scroll_depth_50, avg_time_on_page | author, content_cluster | >60s avg time or 40% scroll rate |
| Revenue Influence | Assisted Conversions | assisted_conversion, product_page_view | campaign_id, product_category | 15% of conversions assisted by content |
| Retention | Returning Users | returning_user, session_count | cohort_week, acquisition_channel | 30-day retention ≥ 20% |
For teams ready to automate reporting, consider feeding this matrix into your analytics plan or an automated pipeline; tools like Scaleblogger.com can help operationalize content-to-conversion tracking. Defining these metrics up front makes the rest of the tracking implementation and QA work far faster and less ambiguous.
Plan Your Data Collection Strategy
Begin by creating a simple, metric-focused event taxonomy that directly addresses your key business questions. Choose events that directly connect to content marketing metrics like engagement, conversions, or retention. Keep parameters specific so that each event remains useful over time. Plan naming so engineers and analysts can both read events without guessing, and include a versioning approach to preserve historical comparability when the schema changes.
Event: A discrete user action you need to measure, modeled as event_name with parameters that add context.
Parameter: A small set of attributes attached to an event that explains why the event happened (e.g., article_id, section, cta_type).
Naming convention: A consistent pattern for event_name and parameter keys so queries don’t break across teams.
Event versioning: A lightweight strategy to change events without losing the ability to compare past and present metrics.
How to design the taxonomy
- Start small: Limit to the events that feed primary KPIs—don’t track everything at once.
- Parameter scope: Each parameter should be reusable across events and limited to 3–5 attributes.
- Readable names: Use snake_case, logical prefixes, and avoid implementation details.
- Immutable core: Keep core parameter names stable; add new parameters rather than repurposing old ones.
- Version flagging: Include a
schema_versionparameter to mark breaking changes.
- Define primary metrics (e.g., article reads, CTA conversions, lead quality).
- Map one event to each metric and list required parameters.
- Agree on naming rules with engineering and analytics teams and document them.
- Implement
schema_versionand a deprecation policy (e.g., keep old events active 6 months).
- Instrument and run a short QA window to validate data before full rollout.
Event taxonomy example showing event name, parameters, trigger, and business use
Table: Plan Your Data Collection Strategy — Event Name, Core Parameters, Trigger Source & more
| Event Name | Core Parameters | Trigger Source | Business Use |
|---|---|---|---|
| article_read | article_id, author_id, reading_time | page_view / SPA route | Measure content engagement |
| cta_click | cta_id, cta_text, position | click handler | Track CTA performance |
| form_submit | form_id, conversion_value, lead_source | form POST | Capture lead conversions |
| video_play | video_id, start_time, playback_rate | media player event | Understand multimedia engagement |
| scroll_depth | percentage, article_id, viewport | scroll listener | Infer content consumption depth |
Key insight: Designing concise events with focused parameters reduces noise and speeds up analysis. Using consistent naming and a schema_version makes it safe to evolve instrumentation without losing historical comparability. That discipline turns raw analytics tracking into reliable content marketing metrics.
For automation-friendly pipelines and to reduce repetitive work during rollout, consider connecting this taxonomy to an automated deployment or content pipeline tool—Scaleblogger.com can help operationalize naming and scheduling. Planning this way saves analysis time and keeps performance signals trustworthy.
Key Takeaway: Start by creating a clean GTM container and deploying GA4 tags that reflect your content marketing goals. Set up measurement around pageviews, key content interactions (scroll depth, CTA clicks, form submissions), and custom events tied to content…
Implement Tagging and Tracking (GA4 + GTM)
Start by creating a clean GTM container and deploying GA4 tags that reflect your content marketing goals. Set up measurement around pageviews, key content interactions (scroll depth, CTA clicks, form submissions), and custom events tied to content performance so analytics feed actionable content marketing metrics back into strategy.
GTM account: An active Google Tag Manager account with container installed on the site. GA4 property: A Google Analytics 4 property ready to receive events. Access: Publish permissions for GTM and Editor/Analyst access in GA4.
Naming convention: Project-wide tag/trigger/variable naming standard.
Create GTM Containers and Deploy GA4 Tags
- Create a GTM container in the correct workspace and install the container snippet on all site templates.
- In GTM, create a GA4 Configuration tag:
- Set Measurement ID to your
G-XXXXvalue. - Trigger: All Pages.
- Configure fields to set
send_page_viewtotrueand attach user properties if available (e.g.,user_type).
- Add GA4 Event tags for meaningful content interactions:
- Event name examples:
scroll_depth,cta_click,content_download,newsletter_submit. - Trigger types: Scroll depth thresholds, Click – All Elements with CSS selector, Form Submission.
- Use
Event Parametersto pass dynamic values via variables (e.g.,page_category,cta_text,download_name).
- Use Variables for dynamic parameter values:
- Create
Data Layer Variablefor values pushed from the app or CMS. - Use
Auto-Event Variableto captureClick TextorClick URL. - Use
Lookup Tablevariables to map page paths topage_category.
- Test and publish:
- Use GTM Preview mode to validate events fire and parameters populate.
- Verify events show up in GA4 Realtime and DebugView before publishing.
Practical example
Event: CTA click on article footer Tag: GA4 Event — cta_click Trigger: Click — CSS selector .article-footer.cta Parameters: cta_text = {{Click Text}}, page_category = {{Lookup: path→category}}
Quick GTM tag matrix: tag type, purpose, trigger, testing notes
Table: Implement Tagging and Tracking (GA4 + GTM) — Tag Type, Purpose, Trigger & more
| Tag Type | Purpose | Trigger | Notes for Testing |
|---|---|---|---|
| GA4 Configuration | Initialize GA4 across site | All Pages | Verify G-XXXX and Realtime hits |
| GA4 Event Tag | Capture content interactions | Scroll / Click / Form | Use DebugView to inspect params |
| Custom HTML Tag | Third-party widgets or custom JS | DOM Ready / Window Loaded | Check console errors and timing |
| Consent Management Tag | Block/allow tags based on consent | Consent state change | Simulate consent flows in preview |
| Server-side Tag | Reduce client load & secure PII | Server container triggers | End-to-end test with server logs |
Key insight: The matrix clarifies which tag to use for each interaction and how to validate behavior; rely on variables and the data layer to keep event payloads consistent and scalable.
Implementing this reliably makes analytics a dependable feedback loop for content decisions, and once the GTM setup is stable, iterating on events becomes low-friction work that directly informs editorial priorities and automation. For teams scaling content workflows, consider integrating tagging plans with content pipelines or automation platforms like Scaleblogger.com to keep measurement aligned with production.
Key Takeaway: First, confirm that events trigger reliably and that expected values appear downstream. Validation isn't just "does an event exist"; it's checking that triggers, payloads, and user-scoped parameters are correct across environments so analytics,…
Validate Tracking and Debug
First, confirm that events trigger reliably and that expected values appear downstream. Validation isn’t just “does an event exist”; it’s checking that triggers, payloads, and user-scoped parameters are correct across environments so analytics, attribution, and content decisions rest on solid data.
Access: QA account with admin-level view in Google Tag Manager (GTM) and GA4 DebugView.
Tools & materials
GTM Preview: For tag/trigger inspection. GA4 DebugView: For real-time event verification. js` requests.
A staging build or feature flag: To avoid polluting production data.
How to inspect dataLayer payloads and run a validation routine
- Open GTM Preview and load the page in the same browser session. Reproduce the user action you want to test (e.g., open article, submit form).
- Watch the left panel for the expected trigger. If it doesn’t appear, check trigger conditions and variables in GTM.
- Expand the
dataLayerpush in the preview or DevTools. Confirm the event name and required keys exist and match naming conventions (event,article_id,utm_source, etc.).
- Switch to GA4 DebugView. Confirm the event arrives and inspect the event parameters. Verify numeric fields use numbers (no strings), and UTM values are present on first hit in the session.
- Validate downstream: if events feed other systems (e.g., CDP, CRM), ensure the same identifiers are forwarded (client_id, user_id). Trace a single test session across systems using a consistent test identifier.
When to involve developers for fixes
- Missing keys or wrong data types: Developers must adjust the
dataLayerpush or backend event payload. - Timing issues (SPA navigation): Developers need to push events on virtual pageviews or use
historylisteners. - Duplication or race conditions: Require code-level debouncing or centralized event dispatching.
Validation Checklist and Test Plan
QA test plan showing actions, expected outcome, and responsible party
Table: Validate Tracking and Debug — Test Action, Expected Result, Time Window & more
| Test Action | Expected Result | Time Window | Owner |
|---|---|---|---|
| Trigger article_read | article_read event in GTM Preview; GA4 DebugView shows article_id, section | 5 min | QA Analyst |
| Submit form | form_submit event with form_name, non-empty email field; no duplicate events | 10 min | QA Analyst |
| Click CTA | Click triggers cta_click with cta_label; event reaches GA4 within 30s | 5 min | QA Analyst |
| Load video | video_play with video_id and play_time param; playback milestones at 25/50/75% | 15 min | QA Analyst |
| User session with UTM params | First event contains utm_source, utm_medium, utm_campaign; persists in session | 10 min | QA Analyst |
Key insight: This timeline pairs quick validation windows with clear owners so fixes are rapid. GTM Preview and GA4 DebugView provide the immediate feedback loop; escalate to engineers when payload structure, timing, or persistence fail.
A tight validation routine like this prevents bad data from skewing content marketing metrics and makes attribution trustworthy. Run these checks as part of every major release and after changes to templates or scripts—it’s the most efficient way to keep analytics useful.
Set Up Reporting and Dashboards
Start creating dashboards that answer critical questions your team faces. A good dashboard doesn’t show every metric — it highlights measurable outcomes, surfaces problems fast, and points to the next action. Prioritize a small set of high-signal views tied to content marketing goals: acquisition, engagement, and conversions.
Data pipeline: Ensure GA4 event collection is consistent across pages and content types. Access: Grant read access to Looker Studio or your BI tool for stakeholders. Historical baseline: Pull the last 90 days of data for trend context.
Which dashboards to build first and why
- Gather a baseline: build a Traffic Trend dashboard to see where growth is coming from and whether recent changes moved the needle.
- Diagnose winners: build Top Pages so content owners can replicate formats that work.
- Link behavior to business outcomes: build an Engagement Funnel that ties pageviews → scrolls → on-page signups → conversions.
- Attribution clarity: build Assisted Conversions and Source by Conversion Rate to prioritize channels that support long-term value.
Specific widgets and segments to include
- Traffic sparkline: Sessions (7-day avg) — compare to prior period to detect momentum shifts.
- Top pages table: Pageviews + conversion rate — segment by content cluster.
- Engagement funnel widget: Event counts by funnel step (
scroll,cta_click,signup_submit). - Assisted conversions chart: Assisted conversion value by page and channel.
- Source conversion heatmap: Conversion rate by source/medium and device.
Automated reporting cadence — practical steps
- Create the dashboard in Looker Studio with live
GA4connectors and date filters.
- Add scheduled email exports: set weekly summary to stakeholders and daily alerts for anomalies.
- Configure threshold alerts: trigger messages when conversion rate drops >20% week-over-week or traffic falls >30% from baseline.
- Archive snapshots monthly into historical reports for trend modeling.
Widget specification table: widget type, metric, dimension, and action it informs
Table: Set Up Reporting and Dashboards — Widget Type, Metric, Primary Dimension & more
| Widget Type | Metric | Primary Dimension | Decision Use |
|---|---|---|---|
| Traffic Trend | Sessions (7‑day avg), % change | Date (daily) | Prioritize channels or content with rising momentum |
| Top Pages | Pageviews, Conversion Rate | Page path / Content cluster | Replicate top formats and update underperformers |
| Engagement Funnel | Event counts (scroll, cta_click, signup_submit) | Funnel step | Reduce drop-offs by improving CTA placement |
| Assisted Conversions | Assisted conversion value | Landing page / Source | Invest in content that supports purchase journeys |
| Source by Conversion Rate | Conversion rate, Sessions | Source/Medium, Device | Reallocate budget to higher-yield channels |
Build dashboards that convert observation into action. Use GA4 events and Looker Studio widgets to make dashboards that reveal which pages truly help conversions, not just which get clicks. Automate exports and alerts so the team spends time fixing problems, not pulling reports.
Integrating an automation layer like Scaleblogger.com can speed up scorecards and publish-to-report workflows, but the priority is always actionable, timely views that align with your content goals. Solid dashboards make clear what to test next and which content deserves scaling.
Configure Attribution and Advanced Measurements
Start by picking attribution and tracking settings that match how your business measures success. If conversions span multiple touchpoints and domains, a short attribution window will miss mid-funnel influence; a long window can over-credit late touches. Match model and window to the sales cycle and the metrics you care about.
Attribution window: Choose a time span for counting conversion after an ad click or view.
Attribution model: Rules for crediting touchpoints (last click, first click, linear, time decay, data-driven).
Cross-domain tracking: Ensures user sessions are preserved when visitors move between related domains or subdomains.
Why this matters: inconsistent attribution or broken cross-domain tracking distorts which content and channels actually drive results — and that leads to poor content and media investment decisions.
How to choose windows and models
- Short sales cycle: Pick a 7–14 day click window and prioritize last-click or time decay.
- Long consideration cycle: Use 30–90 day windows and consider data-driven or linear models.
- Content-driven attribution: Use models that share credit across touchpoints (linear or data-driven) to value content discovery and nurture.
Enable cross-domain tracking in GA4 and GTM
- Open your GA4 property settings and go to
Data Streams.
- Select the web stream and scroll to
More tagging settings.
- Choose
Configure your domains(orCross-domain measurement) and add both primary and related domains (e.g.,example.com,checkout.example.com,partner.com).
- In GTM, update your
GA4 Configurationtag: enableFields to Set→ addallowLinker=true.
- In the same tag, add
Cross Domainunder the tag settings and list the domains.
- Publish GTM, then test using real sessions and the GA4 DebugView to confirm the same client ID persists across domains.
When to adopt server-side tagging
- Privacy and performance needs: Server-side tagging reduces client-side pixels, improving page speed and limiting ad-blocker loss.
- Data control: Use server-side to inspect, transform, and enrich event payloads before sending to endpoints.
- Complex attribution: If you need deterministic identity stitching or CRM joins, server-side tagging makes secure, consistent user keys easier.
Implement server-side tagging when measurement accuracy and data governance matter more than the extra setup cost.
Using correct attribution settings and solid cross-domain tracking stops misleading metrics from derailing content strategy. Get these right and the rest of your analytics — channel mixes, content scoring, and automated pipelines — actually becomes actionable and trustworthy.
Maintain Data Quality and Governance
Maintaining data quality and governance makes analytics reliable, prevents poor content decisions, and protects downstream systems. Begin by considering governance as an ongoing process. This includes regular checks, designating clear owners, automated alerts, and updated documentation. When that rhythm exists, content teams spend less time firefighting and more time improving content performance.
Governance Checklist
- Recurring ownership reviews: Assign a single owner for each data domain (tracking, conversions, content metadata) and rotate quarterly reviews.
- Data contracts: Define the expected schema, allowed values, and SLAs for each feed.
- Quality checks: Daily basic sanity checks (row counts, null rates), weekly deeper checks (duplicate detection, distribution drift), monthly business validation (metric reconciliation).
- Access control audits: Quarterly review of who can modify tracking, dashboards, and raw data.
- Change windows: Publish a calendar of planned changes that might affect analytics (deploys, tracking updates, campaign launches).
How to set up anomaly alerts and response procedures
- Define baseline behavior for each critical metric (traffic by channel,
conversion_rate, content engagement).
- Configure automated alerts that trigger on both magnitude (e.g., >30% drop) and pattern changes (sustained deviation over
nperiods).
- Route alerts to the right owner and channel — use a dedicated Slack channel plus email for high-severity incidents.
- Create a runbook that lists immediate checks: recent deploys, tagging changes, A/B tests, data pipeline failures.
- Escalate to a postmortem if recovery takes longer than the agreed SLA.
Practical example: set an alert for “organic sessions by landing page” to fire when daily sessions fall >40% vs 7-day rolling average and include the last deploy ID and recent tag changes in the alert payload.
Version control and documentation best practices
- Version control: Store tracking specs, SQL, and dashboard configs in a Git repo; tag releases for deploys.
- Documentation: Keep a living
READMEper dataset with owners, update cadence, and known caveats. - Schema evolution: Use migration scripts and
CHANGELOG.mdentries for any breaking change. - Auditability: Log who changed what and when — make rollbacks straightforward.
Definitions
Data contract: The formal agreement specifying fields, types, and SLAs for a dataset.
Anomaly alert: An automated notification triggered when a metric deviates from its expected pattern.
Building these routines reduces surprises and ensures content decisions rest on reliable signals. When governance is operational rather than aspirational, the team moves faster with more confidence.
Troubleshooting Common Issues
Missing or incorrect analytics is usually a configuration or data-collection problem—and it’s triaged faster with a repeatable checklist. Begin by determining if the problem is client-side (like browser or GTM), server-side (like API or logging), or related to configuration (filters or parameters). That mental map speeds decisions and prevents unnecessary code changes.
Quick triage workflow
- Reproduce the problem in a controlled browser session using
GA4 DebugVieworGTM Preview. 2.
Check browser devtools network requests for collect or measurement protocol calls. 3. Inspect dataLayer and event payloads for missing parameters or malformed values.
- Validate settings in GA4 (event names, parameter mappings, filters) and GTM tags/triggers. 5.
If steps 1–4 don’t resolve it, escalate to backend engineers for server logs or API-side issues.
Common scenarios, how to diagnose, and what fixes actually work
Troubleshooting matrix mapping symptom to tests and fixes
Table: Troubleshooting Common Issues — Symptom, Immediate Test, Likely Cause & more
| Symptom | Immediate Test | Likely Cause | Quick Fix |
|---|---|---|---|
| No events in GA4 | Check GA4 DebugView and GTM Preview | Tracking tag not firing or property misconfigured | Reconnect tag to correct GA4 Measurement ID; re-publish GTM container |
| Parameters missing | Inspect dataLayer and network payload | dataLayer not populated or parameter not passed to tag | Push parameter into dataLayer; map it to tag field in GTM |
| Duplicate events | Reproduce and view event timestamps in DebugView | Multiple triggers, duplicated gtag calls, or server-side + client-side send | Consolidate triggers; add dedupe logic (event_id) |
| UTM not attributed | Check landing-page URLs and referral exclusion list | Landing page stripped UTM, redirect chain, or filters | Preserve UTM through redirects; update referral exclusion settings |
| Cross-domain sessions split | Test cross-domain links with DebugView session IDs | Missing linker plugin or inconsistent client IDs | Enable linker in gtag/GTM; allowlist domains in GA settings |
Key insight: the fastest wins are configuration fixes—correct Measurement IDs, tag-trigger alignment, and dataLayer mapping—before any code rewrite is considered.
When to loop in engineering or data teams
- Engineering: if server logs show no outgoing measurement calls, redirects strip UTMs, or backend-rendered pages omit
dataLayer. - Data team: if attribution rules, filters, or sampling are suspected; when changes affect reporting logic across teams.
- Both: for cross-domain identity fixes or implementing
event_iddeduplication.
If automation could remove repetitive checks, tools that auto-validate your pipeline save hours—consider integrating automated QA into the publishing workflow or using an AI-assisted checklist from Scaleblogger.com to systematize tests. Troubleshooting becomes a predictable, low-friction step instead of a firefight.
Tips for Success and Pro Tips
Treat accuracy and usability like a product launch: small, repeatable practices prevent big, costly backtracks. Start by deciding which metrics truly move the needle, then automate checks and keep a clear, versioned record of changes so every tweak is reversible and accountable. The following hacks are practical, low-friction moves that scale with your content program.
Clear metric definitions: Know what “engagement” and “success” mean for each content type.
Access to automation tools: A scheduler or CI system able to run tests and send alerts.
Version control: Basic familiarity with git or your CMS revision history.
Practical hacks to improve accuracy and usability
- Prioritize high-impact metrics: Track a small set—organic sessions, conversion rate, time on page—rather than dozens of vanity numbers.
- Automate validation tests: Run link, schema, and readability checks on every publish with lightweight scripts or your CMS hooks.
- Set actionable alerts: Send succinct alerts for drops in keyword ranking or a spike in 404s, not every minor fluctuation.
- Document decisions: Capture why a headline or template was changed and the expected outcome in the same repo as the content.
- Use feature flags for experiments: Roll out layout or copy changes behind flags to measure impact without full commits.
- Keep a content changelog: Each update gets an entry: what changed, when, and measured impact after two weeks.
Step-by-step for setting up an automated sanity pipeline
- Define the 3–5 metrics to guard across all posts.
- Add checks to your publishing workflow: link validation, schema presence, minimum word count, and readability score.
- Hook tests to a CI job or CMS webhook that runs on publish; fail the job when a critical check breaks.
- Send concise alerts to Slack or email with the failing page URL and the specific error.
- Commit all editorial and template changes to version control, and tag releases for major updates.
that actually work: running a nightly script to detect drops in pages indexed, or a prepublish hook that checks for missing og: tags. Tools range from simple Node scripts to integrations in platforms that support webhooks; if automating publishing is the goal, solutions like Scaleblogger.com can be plugged in to automate repetitive parts of the pipeline.
Common failure modes to watch for: tracking too many metrics, alert fatigue, and undocumented quick fixes. Solve them by tightening metric selection, tuning alert thresholds, and enforcing changelog entries.
These practices make content decisions faster and safer, so experiments actually teach you something. Adopt the habits that fit your team and make them part of the publishing rhythm—results compound quickly when discipline replaces guesswork.
Conclusion
You’ve built a practical path from goals to dashboards: define what matters, pick the right content marketing metrics, plan data collection strategies, and validate tagging so dashboards finally tell a believable story. When a team updated their tagging and removed duplicate events during validation, their engagement signals matched conversion increases. This pattern indicates that small adjustments in analytics tracking can lead to significant clarity. Expect to iterate: check your measurements after major campaigns, test attribution settings, and treat data quality as ongoing work rather than a one-off project.
If the reports still seem confusing, focus on two actions: standardize definitions across teams and automate reporting where possible. This way, everyone can access the same facts without manual effort. ”, run a short audit (validate page-level events, compare raw hits to dashboard counts, and prioritize metrics tied to business outcomes). To that process, platforms that automate measurement and reporting can save hours of manual reconciliation.
com) — it’s one practical next step to turn better analytics tracking into consistent, action-ready insights.
