

Can your content program prove impact without drowning in vanity numbers? Many teams track clicks and pageviews. However, they often do not connect these signals to revenue, retention, or audience growth. This leaves leadership unsure of which efforts should be scaled.
Measuring the right content performance metrics and applying consistent benchmarking lets teams prioritize work, justify budgets, and iterate faster.
Across the next seven metrics, readers will learn how to:
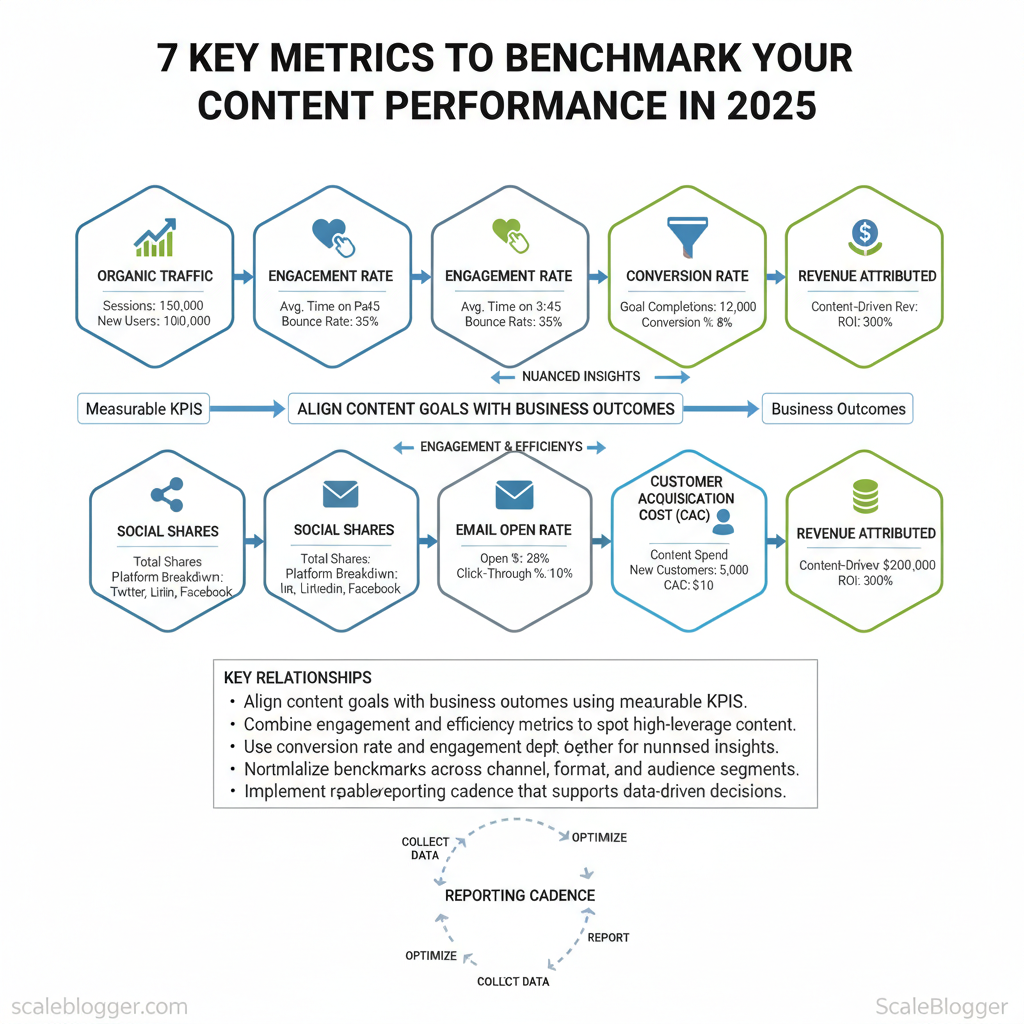
- Align content goals with business outcomes using measurable KPIs. Combine engagement and efficiency metrics to spot high- content. Use
conversion rateandengagement depthtogether for nuanced insights.
- Normalize benchmarks across channel, format, and audience segments. * Implement a repeatable reporting cadence that supports data-driven decisions.
Picture a content team that shifts investment from high-traffic pages with low conversions to fewer, more profitable assets—achieving better ROI with less output. The following sections unpack each metric, why it matters, and how to benchmark it effectively. Visit Scaleblogger.com for more insights on optimizing your content strategy.
> Key Takeaway: ## The Importance of Content Performance Metrics
Content without measurable outcomes is an opinion dressed as strategy. Measuring performance changes creative effort into predictable business results.
The Importance of Content Performance Metrics
Content without measurable outcomes is an opinion dressed as strategy. Measuring performance changes creative effort into predictable business results. It shows which topics, formats, and channels actually make a difference. Content metrics are the quantitative signals that answer whether a piece of content attracts attention, engages an audience, and converts that attention into value.
Start with definitions and types so teams speak the same language:
- Traffic metrics: Visits, unique users, pageviews — show reach and discovery. Engagement metrics: Time on page, scroll depth, pages per session — reveal whether content holds attention. Acquisition metrics: Channel source, referral, organic vs.
paid — identify where audiences originate. Conversion metrics: Leads, sign-ups, purchases, micro-conversions — measure business outcomes tied to content. SEO metrics: Impressions, CTR, keyword rankings, backlinks — connect content to search visibility.
- Quality & relevance metrics: Content scoring, relevance audits, bounce reasons — quantify topical fit and user satisfaction. Velocity metrics: Publish frequency, time-to-publish, content backlog* — track throughput and capacity.
Why these matter:
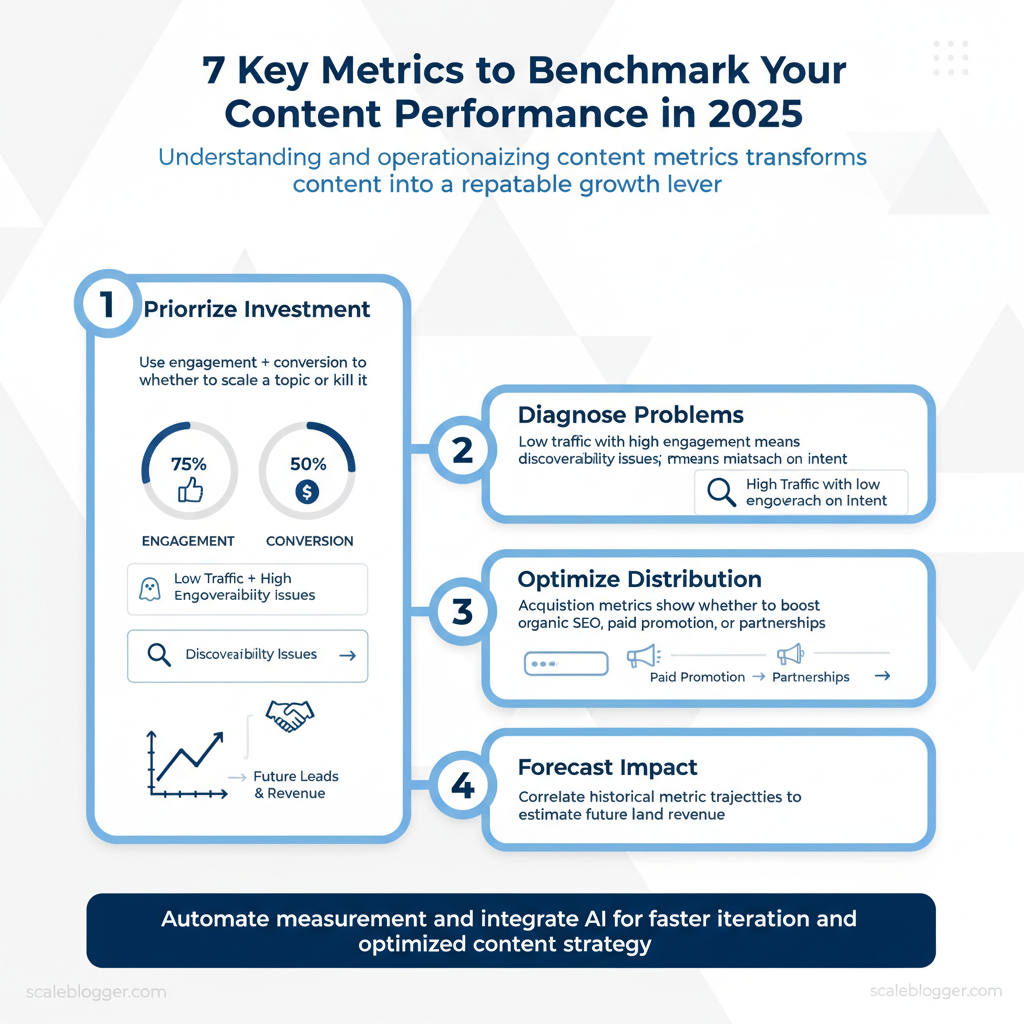
- Prioritize investment. Use engagement + conversion to decide whether to scale a topic or kill it.
- Diagnose problems. Low traffic with high engagement means discoverability issues; high traffic with low engagement means mismatch on intent.
- distribution. Acquisition metrics show whether to boost organic SEO, paid promotion, or partnerships.
- Forecast impact. Recent research indicates that correlating historical metric trajectories can help estimate future leads and revenue.
Practical example: a blog post with steady organic impressions but falling CTR suggests title or meta mismatch; Research from recent studies indicates that a 30–40% higher time on page after adding a data visualization indicates format matters for that audience. Content teams should embed content scoring into reviews to compare articles on the same scale—topic fit, depth, and outcome.
Automating measurement frees creative teams to iterate faster; tools that provide an automated content scoring framework and predictive signals reduce guesswork and shorten experimentation cycles. For organizations ready to scale, integrating AI content automation with measurement pipelines is a force multiplier—see options for AI content automation and how to Predict your content performance for frameworks that tie metrics to decisions.
Understanding and operationalizing these metrics shifts content from an art into a repeatable growth lever that teams can continuously. This approach reduces wasted effort while amplifying the content that actually contributes to business goals.
> Key Takeaway: ## 1. Engagement Metrics
Engagement metrics are the primary signal that content actually resonates — they show whether a post stops scrolling, prompts a reaction, or starts a conversation.
1. Engagement Metrics
Engagement metrics are the primary signal that content actually resonates — they show whether a post stops scrolling, prompts a reaction, or starts a conversation. Track the obvious interactions (likes, shares, comments) alongside behavioral measures (time on page, bounce rate) to get a complete picture of audience intent and content quality. Begin by standardizing how you measure each metric. Use measurements per 1,000 impressions or followers so that comparisons across platforms are useful.
Key engagement metrics to track and why they matter:
- Likes — quick social proof; useful for A/B testing headlines and visuals. Shares — amplification and network endorsement; high shares often correlate with referral traffic. Comments — depth of engagement and qualitative feedback; valuable for product insights.
- Time on Page — attention metric for long-form content; guides content length and structure decisions. Bounce Rate — first-pass relevance; signals mismatch between promise (title/preview) and content delivered.
Provide statistics on average engagement rates across different platforms (typical interactions per 1,000 followers/impressions)
| Platform | Average Likes (per 1k) | Average Shares (per 1k) | Average Comments (per 1k) |
|---|---|---|---|
| 30–80 likes | 1–6 shares | 2–8 comments | |
| 10–40 likes | 2–8 shares | 1–5 comments | |
| 8–20 likes | 1–4 shares | 1–6 comments | |
| X (Twitter) | 5–20 likes | 0.5–3 shares | 0.5–3 comments |
| TikTok | 50–150 likes | 2–10 shares | 3–12 comments |
To make these metrics work, focus on two key practices. First, normalize metrics to the same denominator (per 1k impressions/followers) to compare across platforms. Second, pair quantitative signals with qualitative review: review the top comments to surface topical language and objections.
For editorial planning, prioritize metrics by business outcome: use shares and time on page for reach and retention goals, and comments for product discovery or community building.
Pairing consistent measurement with automated dashboards — or leveraging an AI content pipeline to forecast engagement — shortens the feedback loop and lets teams iterate faster. Predict your content performance with tools that combine historical engagement and topic signals to prioritize content with the highest ROI. Understanding these engagement patterns helps teams refine content choices while keeping workflow efficient and focused on impact.
> Key Takeaway: ## 2. Traffic Metrics
Traffic composition helps decide which content to prioritize.
2. Traffic Metrics
Traffic composition helps decide which content to prioritize. It also guides how to measure success and where to spend the promotion budget. Start by distinguishing the four primary sources — Organic, Direct, Referral, and Social — then map each source to appropriate KPIs and actions. Practically, this means using GA4 or other analytics to segment sessions by source, tagging campaign links with UTM parameters, and aligning content types to the channel that drives growth.
Core actions when analyzing traffic sources:
- Segment by source and landing page to spot content that earns organic vs social attention. Compare conversion rates by source to decide which traffic to scale. Use behavioral metrics (time on page, pages/session) to infer content relevance per channel.
- Create channel-specific content playbooks — SEO-first for organic, amplified creative for social.
Traffic sources and their effectiveness
| Traffic Source | Advantages | Challenges | Best Practices |
|---|---|---|---|
| Organic | High-intent visitors | Slow growth velocity | SEO optimization, topic clusters, internal linking |
| Direct | Strong brand recognition | Ambiguous attribution | Encourage bookmarks, use short URLs and campaigns |
| Referral | Third-party credibility | Traffic volume dependent | Guest posts, partnerships, targeted outreach |
| Social | Fast reach and testing | Short session durations | Platform-tailored creative, paid amplification |
- Audit sources monthly to catch attribution shifts.
- Reallocate promotion budget toward channels with improving conversion rates.
- Use
UTMtagging to resolve ambiguous direct traffic.
Understanding traffic sources this way lets teams prioritize efforts that grow visibility without adding unnecessary complexity. When implemented consistently, this approach reduces wasted spend and surfaces the content that truly moves the needle.
3. Conversion Metrics
Conversion metrics measure how effectively content moves an audience toward a business outcome. Begin by defining the action that shows value. This could be a newsletter signup, demo request, purchase, or content download. Then, quantify it.
Industry data suggests that calculating conversion rates is straightforward but doing it consistently and in context is what separates noise from actionable insight.
Common conversion events to track:
- Newsletter signups — first-touch lead capture for nurture sequences. Free trial starts — high-intent indicator for SaaS. Content downloads — signals content-led demand generation.
- Demo requests — sales-ready qualification. Purchases — direct revenue conversion. Micro-conversions (time on page, scroll depth) — engagement signals that predict macro conversions.
- Form completions — often tied to lead scoring. CTA clicks — immediate indicator of content effectiveness.
How to calculate conversion rates: use the simple formula conversions ÷ visitors × 100. That single metric becomes powerful when segmented by channel, landing page, audience cohort, or content topic. Track conversions using marketing analytics platforms and map them back to content touchpoints so attribution isn’t guesswork.
Outline steps to calculate conversion rates
| Step | Description |
|---|---|
| Define Goal | Choose the primary conversion (e.g., newsletter signup, demo request). |
| Track Conversions | Instrument events in analytics (GA4, Mixpanel, HubSpot) using event and goal tracking. |
| Calculate Rate | Use formula conversions ÷ unique visitors × 100 per page/channel/timeframe. |
| Analyze Results | Segment by source, landing page, device, and campaign; compare against benchmarks. |
Practical example: a blog post with 12,000 unique visitors and 240 newsletter signups has a conversion rate of 240 ÷ 12,000 × 100 = 2%. Compare that 2% to other posts, to paid acquisition, and to historical trends to prioritize experiments — A/B testing CTAs, changing lead magnets, or revising intent alignment.
Automation and content pipelines help scale these measurements. Platforms that automate event collection and reporting reduce manual errors and accelerate iteration; for teams building that capability, AI content automation like the solutions at Scaleblogger.com can standardize tagging and performance benchmarks. Understanding and operationalizing conversion metrics enables rapid, evidence-driven decisions and clearer ROI on content investments.
4. SEO Metrics
Understanding which SEO metrics matter for content and how they interact lets teams prioritize work that moves the needle. Here are the key metrics that every content team should track. Each one includes a brief explanation and reasons why they improve decision-making.
1. Keyword Rankings
Explanation: Track where target keywords sit in SERPs over time, segmented by intent and page. Userank tracking that records position changes daily or weekly and ties them to content updates. Why it works: Ranking movement directly signals visibility shifts; a sustained climb into the top 10 typically multiplies organic traffic and conversion opportunities.
2. Organic Traffic
Explanation: Measure sessions and users arriving from organic search, broken down by page, topic cluster, and landing page. Combine with pages-per-session and conversion metrics. Why it works: Organic traffic shows the real-world outcome of visibility—changes indicate effective optimization or gaps in topical coverage.3. Backlinks
Explanation: Count referring domains and assess link quality (authority, topical relevance, follow/nofollow). Track new vs. lost links and anchor-text patterns.Why it works: Strong, relevant backlinks lift rankings and topical credibility; a targeted outreach program often correlates with measurable ranking gains.
4. Domain Authority (DA/DR)
Explanation: Monitor aggregate site authority using metrics like Moz DA or Ahrefs DR as a shorthand for site-level SEO strength. Use changes to prioritize technical or content initiatives. Why it works: While imperfect, DA/DR correlates with the likelihood of ranking for competitive keywords and helps benchmark against competitors.5. Click-Through Rate (CTR)
Explanation: Evaluate the percentage of impressions that convert to clicks in search results for each page and query. Test title and meta variations to improve CTR. Why it works: Higher CTRs improve traffic without changing rankings; small title/meta changes often produce outsized ROI.6. Engagement Metrics (Bounce Rate / Dwell Time)
Explanation: Track how long users stay, whether they interact, and whether they navigate to other pages. Combine with conversion funnels to assess content effectiveness. Why it works: Engagement is a proxy for content relevance and quality; better engagement usually complements ranking improvements and boosts conversions.Key operational tips: prioritize metrics that align with business goals, set alerts for sudden drops, and tie quantitative changes to specific content edits or campaigns. Teams using AI systems should automate data pulls and anomaly detection to keep the feedback loop tight—Scaleblogger.com offers AI content automation that integrates these signals into a continuous pipeline.
Provide average SEO metrics across industries
| Metric | Average Value | Industry |
|---|---|---|
| Keyword Ranking | Typical top-10 share: 5–15% of tracked keywords | Tech / SaaS |
| Backlink Count | Typical referring domains: 300–2,000 | E-commerce |
| Domain Authority Score | Typical DA/DR: 25–55 (Moz/Ahrefs scale) | Finance / Publishing |
Tracking the right mix of ranking, authority, link, and engagement metrics turns hypotheses into measurable outcomes, so teams can iterate with confidence and scale content production without losing alignment to business goals.
5. Content Quality Metrics
Assessing content quality requires measurable signals that map directly to reader satisfaction and search visibility. Below are seven practical metrics to track, each with a concise explanation and why it matters for editorial decision-making.
1. Readability Score
Explanation: UseFlesch-Kincaid or SMOG to quantify sentence and word complexity; aim for levels that match audience sophistication. Many CMS plugins surface this automatically, letting editors iterate copy quickly. Why it works: Readability correlates with time-on-page and comprehension, which reduces bounce and supports stronger user engagement.
2. User Feedback
Explanation: Capture qualitative ratings, inline comments, and short surveys (one- or two-question micro-surveys) at the article level. Combine with support logs or social mentions to surface recurring complaints. Why it works: Direct reader signals reveal gaps that quantitative metrics miss—tone, usefulness, and trustworthiness are often first reported here.3. Content Depth (Topical Coverage)
Explanation: Measure the number of unique subtopics, linked authoritative resources, and semantic keyword breadth inside the article. Use outlines to compare against competitive pieces and mark missing subtopics. Why it works: Deeper topical coverage increases probability of satisfying diverse search intents and reduces churn from users who need more than a surface answer.4. Visual Appeal and Layout
Explanation: Evaluate image relevance, caption quality, use of data visualizations, and scannability (headings, bullets, pull quotes). Score mobile appearance separately since most readers arrive on phones. Why it works: Visuals and layout drive comprehension and shareability; good formatting shortens the path between curiosity and conversion.5. Evidence & Source Quality
Explanation: Track the proportion of claims backed by primary sources, case studies, or reproducible examples. Flag content that relies on unnamed or dated sources for revision. Why it works: Trustworthy sourcing increases credibility and is essential for conversion-oriented content and enterprise audiences.6. Engagement Signals
Explanation: Monitor scroll depth, time-on-page, click-throughs to CTAs, and internal link paths. Segment by traffic channel to detect differences in intent. Why it works: Engagement patterns show whether content satisfies the promise of the headline and whether users continue their journey on-site.7. Content Scoring and Automation
Explanation: Implement acontent scoring framework that weights readability, depth, evidence, visuals, and engagement into a single health score; automate alerts for drops. Consider AI systems to surface low-performing pages for rewrites — for example, a platform that helps you predict your content performance. Why it works: A unified score makes prioritization objective and scales editorial decisions across large content sets.
Track these metrics in tandem rather than in isolation; the combined signal directs smarter edits and resource allocation. Understanding these principles helps teams move faster without sacrificing quality.
6. Social Metrics
Social metrics quantify how content resonates and spreads; focusing on the right ones turns noisy dashboards into prescriptive signals for editorial decisions. Below are the essential social metrics to track, why each matters, and practical examples that move conversations into measurable actions.
1. Shares
Explanation: Shares measure how often your content is redistributed by users, reflecting trust and virality potential. A single well-shared post can amplify reach exponentially without extra ad spend. Why it works: Shared content carries a social endorsement that increases organic reach and referral traffic, often yielding higher-quality visitors.2. Comments
Explanation: Comments indicate depth of engagement — questions, debates, and endorsements show meaningful interactions. Track sentiment and recurring topics inside comments to surface content ideas. Why it works: Comments provide direct audience feedback and signal topics worth expanding into blog posts or FAQs.3. Followers Growth
Explanation: Follower growth shows net audience expansion over time; segment by source (organic, paid, influencer) to spot scalable channels. Use monthly percentage growth rather than absolute counts for trend clarity. Why it works: Consistent follower growth predicts future organic reach and gives a larger base for content distribution.4. Engagement Rate
Explanation: Engagement rate aggregates likes, comments, shares, and saves relative to impressions or followers (engagement / impressions * 100). Compare platform-specific benchmarks to assess performance. Why it works: Engagement rate normalizes performance across audience sizes, making A/B tests and content experiments comparable.
5. Impressions & Reach
Explanation: Impressions count total views, reach counts unique viewers; both reveal distribution efficiency and saturation. Monitor frequency to avoid audience fatigue. Why it works: High impressions with low engagement indicate creative or targeting problems, guiding creative iteration.6. Click-through Rate (CTR)
Explanation: CTR measures how many viewers follow a link to your site or landing page; essential for content-to-conversion funnels. headlines, CTAs, and link placement to lift CTR. Why it works: CTR connects social activity to site behavior, enabling revenue and lead forecasting.7. Sentiment & Brand Mentions
Explanation: Track positive/negative mentions and keyword co-occurrence to understand reputation dynamics. Use volume spikes to triage PR or product feedback. Why it works: Sentiment trends predict churn risks and inform messaging adjustments before issues escalate.8. Save/Bookmark Rate
Explanation: Saves indicate content utility and intent to revisit; high save rates suggest evergreen value suitable for repurposing. Why it works: Saved content often has longer-term engagement and higher downstream conversion.social media metrics benchmarks
| Platform | Average Engagement Rate | Average Follower Growth (monthly) |
|---|---|---|
| 0.10% | 0.8% | |
| Twitter (X) | 0.045% | 0.6% |
| 1.10% | 2.5% | |
| 0.54% | 1.2% |
AI content automation to identify high-save posts and republish variations — reduces manual work and scales what’s already resonating.
Understanding these principles helps teams prioritize the metrics that drive distribution, not vanity.
📥 Download: Content Performance Metrics Checklist 2025 (PDF)
7. Customer Feedback Metrics
Collecting customer feedback is not optional — it’s the signal stream that guides product, content, and UX decisions. Start by mapping what you need to learn (satisfaction, friction points, feature requests, advocacy) and match each question to a measurement channel. That keeps feedback focused and reduces noise.
Use a mix of quantitative and qualitative inputs:
- Surveys — structured questions to track trends over time, especially
NPS, CSAT, and effort scores. Comments & support transcripts — rich qualitative context for recurring problems. Social listening — discovers sentiment and topical patterns at scale across public channels.
- Behavioral signals — micro-conversions, churn triggers, and engagement dips that correlate with sentiment.
- Define the metric set
- Pick collection cadence (continuous vs. campaign)
- Route feedback into a single searchable system for tagging and action
Measure these core metrics and why they matter:
- Net Promoter Score (NPS) —
(% promoters - % detractors) 100; good for tracking advocacy trends and predicting referral growth. Customer Satisfaction (CSAT) — short, transactional surveys after interactions; useful for pinpointing support or UX issues. Customer Effort Score (CES) — measures friction during a task; lower effort correlates with higher retention.
- Qualitative themes — tag free-text responses by topic to quantify recurring issues or feature asks. Sentiment trend (social listening) — monitors brand health and amplifies emergent problems before escalation.
Practical examples
- A 2022 industry study found that a SaaS product reportedly uses a post-onboarding CSAT to reduce churn by approximately 12% after redesigning setup flows.
- A consumer brand tracks social sentiment and spots a packaging issue within 48 hours, avoiding wider returns.
Operational tips
- Automate routing so
promotersget referral asks anddetractorsget immediate follow-up. - Use sampling to avoid survey fatigue; trigger surveys on meaningful events.
- Combine qualitative tags with behavioral cohorts to prioritize fixes by impact.
Tools for collecting customer feedback
Tools for collecting customer feedback
| Tool | Purpose | Cost |
|---|---|---|
| Google Forms | Simple surveys, free response export | Free |
| Typeform | Conversational surveys, conditional logic | Free tier; paid from $25/month |
| SurveyMonkey (Momentive) | Scalable survey platform, advanced analytics | Free tier; plans from $25/month |
| Qualtrics | Enterprise experience management, deep analytics | Enterprise pricing (custom) |
| Hotjar | Session recordings + on-site surveys | Free limited; paid from $39/month |
| Zendesk | Support + CSAT surveys, ticket-driven feedback | Support plans from $19/agent/month |
| Intercom | In-app messaging + surveys, routing workflows | Starter from ~$74/month |
| Sprout Social | Social listening, sentiment monitoring | Plans from $99/month |
| Mention | Brand monitoring, alerts, social analytics | Plans from $29/month |
| Delighted (by Qualtrics) | Quick NPS/CSAT/CES surveys, simple integrations | Plans from $49/month |
Integrating feedback into content and product cycles accelerates learning and reduces rework. Use automation to route insights and let teams act on signals rather than search for them. This is why workflows that connect survey output to prioritization boards and content pipelines produce measurable improvements in engagement and retention.
For teams scaling content, an AI-powered content pipeline can turn those insights into topic priorities and testable content experiments — consider Scale your content workflow with Scaleblogger for automating that translation from feedback to production.
Conclusion
The path forward is clear: map metrics to revenue, stop measuring vanity numbers in isolation, and automate measurement where repetitive tasks eat time. Teams that tie content to specific funnel stages and run small experiments—like A/Bing conversion-focused templates or automating lead attribution—consistently improve qualified leads and retention. If the immediate question is “How do I start?” begin by choosing one content type, defining the downstream KPI, and instrumenting a simple test; evidence suggests iterative learning outperforms big-bang overhauls.
For step-by-step playbooks and templates that make those experiments repeatable, explore the Scaleblogger resources and consider piloting an automated attribution workflow. When ready to scale, start small, measure rigorously, and iterate rapidly. Visit Scaleblogger.com for more insights on optimizing your content strategy.
