

Creating shareable content means going beyond likes and designing posts that people genuinely want to pass on to others.
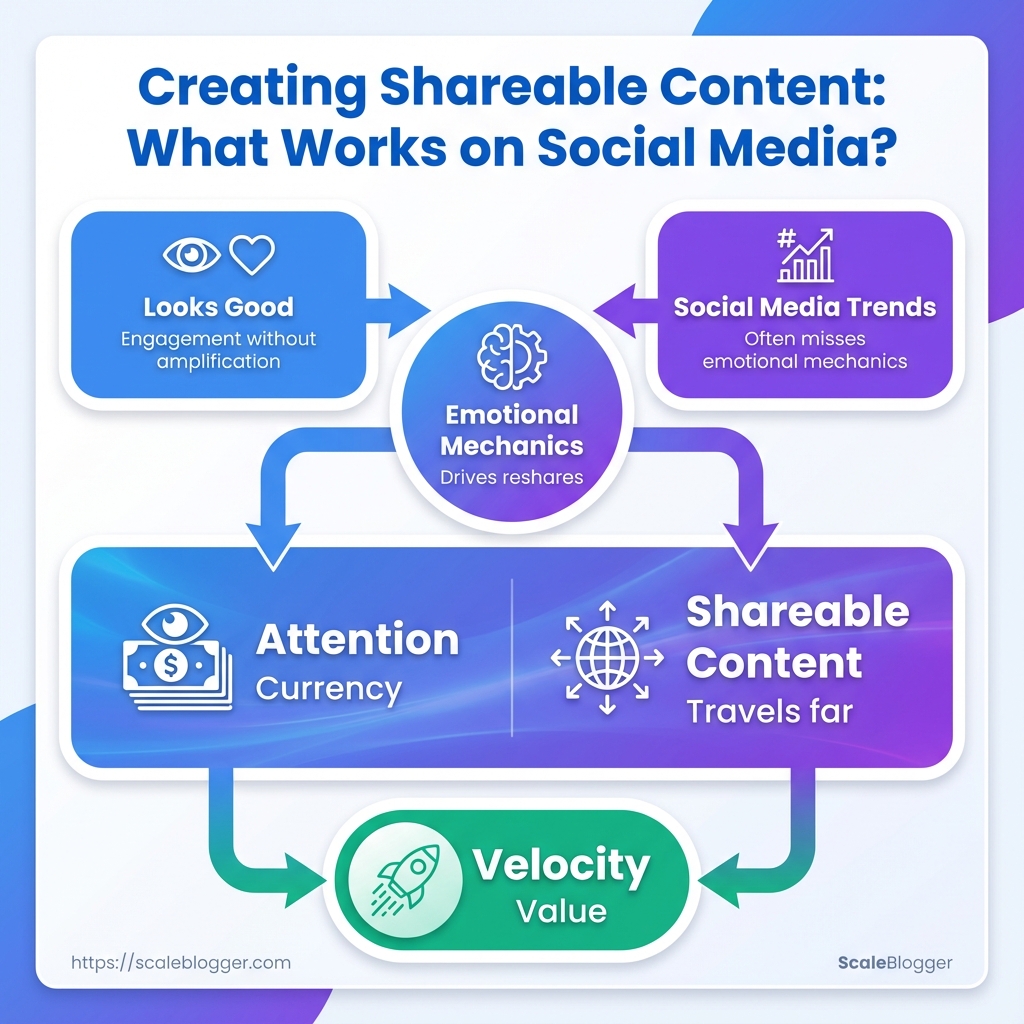
A well-designed image may attract attention, but attention alone doesn’t guarantee shares. The strongest social media content combines emotion, usefulness, curiosity, or a clear social signal that gives people a reason to share.
Instead of simply following social media trends, focus on understanding what makes your audience react, save, discuss, and distribute content.
With the right hooks, formats, and distribution strategy, passive impressions can turn into meaningful social media engagement and organic reach.
What You’ll Need
Start by understanding your audience and basic metrics. Without this knowledge, automated content just adds to the noise. Before building an AI-powered content pipeline, confirm who you’re writing for, what problems they face, and that you can measure outcomes. That foundation makes repurposing, distribution, and optimization actually move the needle.
Prerequisites checklist (quick scan):
- Audience persona & pain points: Defined buyer/persona profiles and 2–3 concrete pain points per persona. Access to analytics: Read-only or editor access to
Google Analytics (GA4)and any platform native insights. Content calendar template: A publish cadence (weekly/biweekly) and a reusable calendar file.
- Design & video tools: At least one design tool (Canva or Figma) and a simple video editor (CapCut/VEED). * Baseline content: Minimum of three existing posts to repurpose into short-form, newsletters, and social.
Audience persona: One- or two-paragraph sketch of the ideal reader, including role, goals, and content channels they use.
Pain point 1: Time-poor marketers who need repeatable, low-effort assets.
Pain point 2: Low organic traffic on evergreen posts that could be repurposed.
Pain point 3: No clear KPI linking content to leads or revenue.
- Make sure analytics access is usable.
- Confirm GA4 property permissions and that events/pages you care about are tracked.
- Connect platform insights (Facebook/Instagram/TikTok) for native engagement metrics.
- Prepare the content calendar.
- Use weekly columns: Topic, Format, Owner, Publish Date, Distribution Channels.
- Lock a 2–3 week sprint for initial repurposing and scheduling.
- Gather creative assets.
- Export latest 3 posts, hero images, and raw video clips for editing.
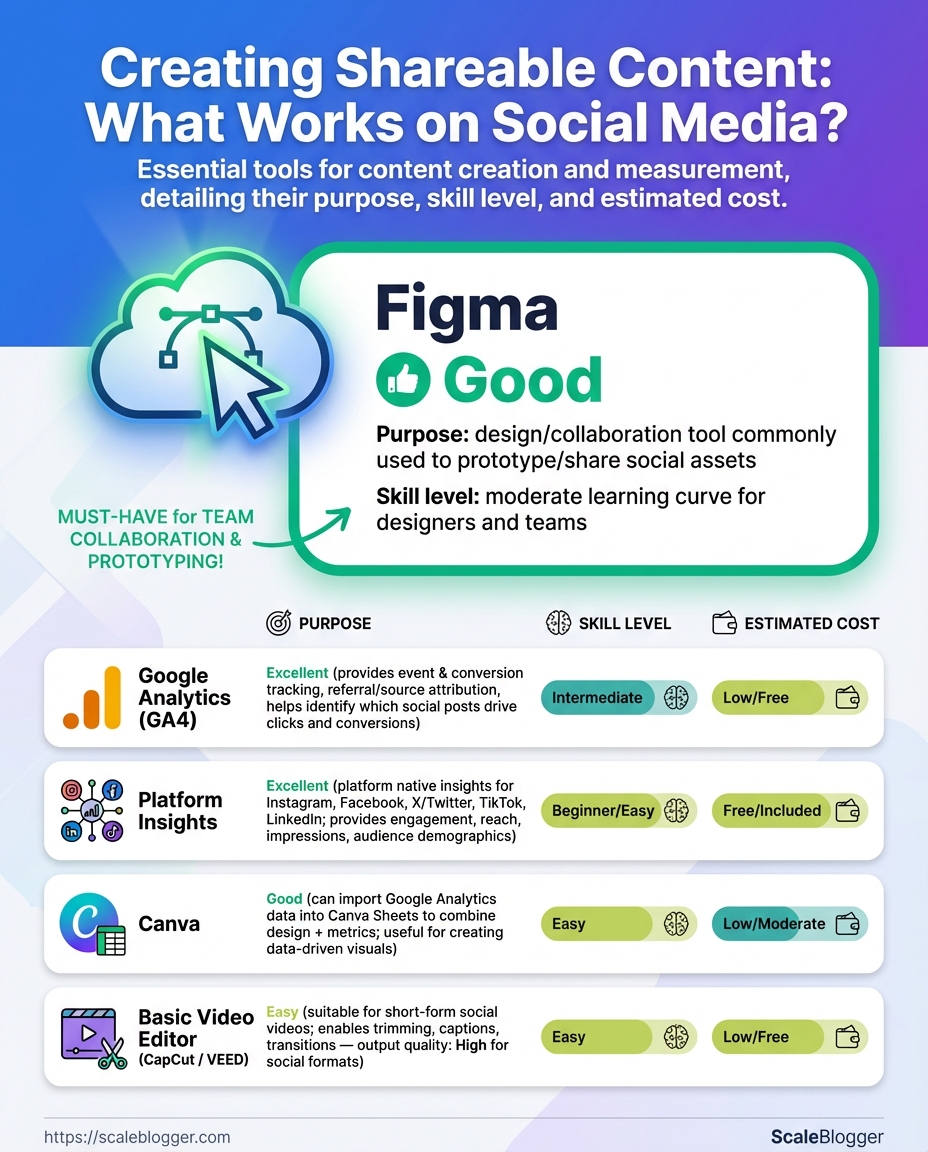
Essential tools, their role, and when to use them
Table: What You’ll Need (Prerequisites) — Tool, Purpose, Skill_level & more
| Tool | Purpose | Skill_level | Estimated_cost |
|---|---|---|---|
| Google Analytics (GA4) | Traffic, engagement, conversions tracking; event-based metrics | Beginner–Intermediate | Free |
| Platform Insights (Facebook/Instagram/TikTok) | Native post analytics, audience demos, paid vs organic split | Beginner–Intermediate | Free (basic); Business tools vary |
| Canva | Quick visuals, templates for social and blog headers | Beginner | Free; Pro $12.99/month |
| Figma | Component-based design and collaborative mockups | Intermediate | Free starter; Professional $12/editor/month |
| Basic Video Editor (CapCut / VEED) | Short-form video edits, captions, exports for social | Beginner–Intermediate | CapCut: Free; VEED: Free tier / Pro ~$18/month |
Covering both measurement and creative tools reduces friction when scaling. GA4 and platform insights give the numbers that decide what to repurpose. Canva and a lightweight editor let teams produce assets without developer support, while Figma keeps brand consistency if designers are involved.
These items keep the first sprint tightly focused: clear audience, measurable goals, a predictable calendar, and the minimal toolset to turn three posts into a week’s worth of shareable content. When those boxes are checked, automations and AI will actually save time instead of creating more work.
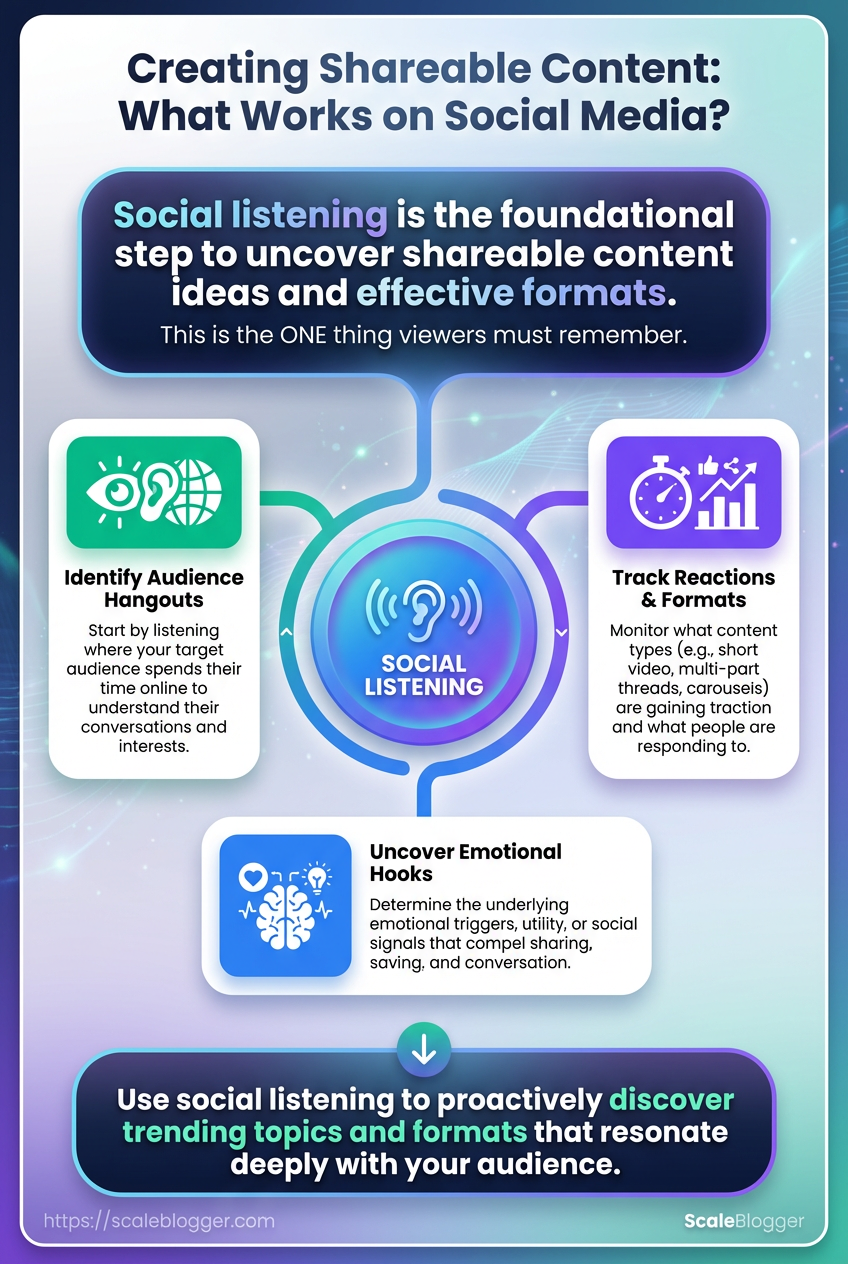
Find Shareable Ideas with Social Listening
Begin by listening in the places where your audience spends time. Social listening surfaces not just trending topics but the formats and emotional hooks that drive shares, saves, and conversation. Track what people react to, which formats are exploding (short video, multipart threads, carousel explainers), and which posts create meaningful engagement rather than vanity metrics.
Active social accounts: You need working profiles on at least two major platforms to validate trends.
A simple logging system: Spreadsheet, Airtable, or a lightweight content brief template.
Time budget: Plan 30–60 minutes daily for scanning and 2 hours weekly for clustering and prioritization.
Where to scan and what signals actually predict shareability
- Platform discover pages often show what’s seeded to wide audiences — perfect for format cues.
- High saves or bookmarks indicate evergreen utility.
- High comments-to-views ratio signals conversation potential and community investment.
- Rapid share velocity (shares per hour after posting) often precedes virality.
- Start each day on discovery feeds (TikTok Discover, Instagram Explore, YouTube Trending).
- Open top-performing posts and record: topic, format, primary emotion, and engagement ratios.
- Cross-check that idea in niche communities (relevant subreddits, X conversations) to validate depth of interest.
- Prioritize ideas that appear across 2+ platforms with strong engagement signals.
Trend sources and what signals to watch on each
Table: Find Shareable Ideas with Social Listening — Source, Best for, Shareability Signals & more
| Source | Best for | Shareability Signals | How to monitor |
|---|---|---|---|
| TikTok Discover | Short-form trends, audio-led formats | High view spike + high shares; trending sounds; rapid duet/stitch activity | Daily Discover tab; creator playlists; For You pattern sampling |
| Instagram Explore | Visual hooks, Reels, carousel how-tos | Saves, shares to stories, comments on Reels | Explore tab, Reels feed, hashtag pages, creator insight panels |
| Twitter/X Trends | Real-time news, opinable takes, threads | High reply-to-impression ratio; trending hashtags | Trends sidebar, advanced search, TweetDeck column for hashtags |
| Reddit (subreddits) | Deep interest validation, long-form discussion | Upvotes + long comment threads; cross-posts to other platforms | Subreddit hot/new pages, /r/all monitoring, keyword alerts |
| YouTube Trending | Long-form explainers, listicles, tutorials | High watch time, comment depth, shares to playlists | Trending tab, related searches, YouTube Studio analytics |
Key insight: scan a mix of discover-driven platforms (TikTok, Instagram) for format cues, and community-driven spaces (Reddit, X) to test whether interest runs deep enough to sustain evergreen content.
Practical examples that make this usable
- Example — Short explainer: Spot a TikTok audio trend about “why X happens”; recreate as a 45–60s Reel with clearer visuals and a CTA to save.
- Example — Thread: See a high-reply X thread; turn the core argument into a multi-part blog + Twitter thread for cross-posting.
- Example — Deep dive: Find repeated questions in subreddits; build a long-form guide optimized for search and shareable highlights for socials.
Use a simple scoring rubric when logging ideas: frequency across sources, engagement quality (saves/comments), and format fit for your resources. If automation helps, consider tools that feed trends into your editorial pipeline or use Scaleblogger.com to automate idea clustering and content scoring.
Scan consistently and log deliberately — the best shareable ideas look ordinary at first, until you catch the pattern that makes people stop, react, and pass it on.
Craft a Hook That Compels Sharing
A shareable hook grabs attention quickly and clearly promises to create curiosity, provide value, or evoke emotion. Start by picking one dominant emotional trigger—surprise, utility, doubt, pride, or nostalgia—and design the first 1–3 seconds (headline + visual) to activate it. The goal is to prompt viewers to react, click, or share.
Strong hooks work across formats: short video intros, social thumbnails, lead sentences, and captions. Below are six repeatable formulas with examples and a testing framework to pick the highest-performing variant.
Six proven hook formulas (with quick examples)
- Curiosity Gap: “You’re doing X wrong — here’s the tiny change that fixes it.”
- Stat-led: “According to recent research, 70% of teams miss this metric — here’s the fix.”
- How-to Promise: “How to write a viral headline in 60 seconds.”
- Myth-busting: “Most people believe X. That’s false.”
- Emotional Story: “She lost everything — then used this tactic to rebuild.”
- Fear of Missing Out: “Last chance to grab the framework that doubled engagement.”
Map hook formulas to emotional triggers and best formats
Table: Craft a Hook That Compels Sharing — Hook Formula, Emotional Trigger, Best Format & more
| Hook Formula | Emotional Trigger | Best Format | Example |
|---|---|---|---|
| Curiosity Gap | Surprise / Intrigue | Short video intro, headline | “Why Monday emails tank (and the 10s fix)” |
| Stat-led | Credibility / Shock | Infographic, caption | “Data shows 3x more clicks with this subject line” |
| How-to Promise | Utility / Control | Carousel, how-to video | “Write a headline that ranks in 5 steps” |
| Myth-busting | Doubt / Re-evaluation | Tweet thread, short post | “You don’t need backlinks to rank anymore” |
| Emotional Story | Empathy / Aspiration | Long-form post, video | “From zero to profitable in 6 months” |
Key insight: These formulas map cleanly to formats where behavioral friction is lowest—short videos and carousels for curiosity, stat visuals for credibility, and longer narratives for emotional payoff. Use the format that minimizes friction between the hook and the promised value.
What to A/B test (3–5 high-impact elements)
- Headline/first sentence: swap wording and voice. Thumbnail/visual: change color, face close-up, or icon. Caption/teaser: test length, emojis, and value framing.
- CTA: test direct vs. curiosity-driven CTAs. * Format length: 6–15s vs.
30–60s.
- Run a controlled A/B test with one variable changed at a time.
- Split traffic evenly and randomize exposure.
- Let tests run until you hit statistical and practical thresholds.
Sample size and timing advice
Industry analysis shows small audiences need longer tests. For reliable signals, aim for at least 1,000 impressions per variant or 100–200 interactions, and run tests across 3–7 days to avoid day-of-week bias. Shorter windows can work if you have high traffic, but beware novelty spikes.
Testing hooks is iterative—measure engagement and share rate, then scale the winner. Small wording shifts often produce the biggest gains, so refine relentlessly and automate the rollout where possible to accelerate learning.
Key Takeaway: Begin by selecting the format that best meets your goals and distribution channel. Then create a consistent production process to ensure quality and speed.
Create the Content (Formats & Production)
Begin by selecting the format that best meets your goals and distribution channel. Then create a consistent production process to ensure quality and speed. Production is where strategy turns into assets: scripts, visuals, accessibility layers, and final exports that meet platform specs. Keep templates for each format so the team doesn’t reinvent sizing, duration, or caption rules every time.
Tools & materials needed
- Camera/audio: DSLR or smartphone with external mic
- Editing: Premiere Pro, Final Cut, or CapCut for quick vertical edits
- Design: Figma or Canva for carousels and single-image posts
- Subtitles/alt text: Descript or Rev for captions; built-in CMS alt fields
- Automation: Scaleblogger.com for pipeline automation and scheduling
Provide format specs, ideal duration, and recommended tools
Table: Create the Content (Formats & Production) — Format, Aspect Ratio, Ideal Duration & more
| Format | Aspect Ratio | Ideal Duration | Recommended Tool |
|---|---|---|---|
| Short vertical video (Reels/TikTok) | 9:16 | 15–45s | CapCut / Adobe Premiere Rush |
| Instagram Carousel | 1:1 or 4:5 | N/A (3–10 cards) | Figma / Canva |
| Single-image post | 1:1 or 4:5 | N/A | Photoshop / Canva |
| Animated quote/GIF | 1:1 or 9:16 | 5–15s loop | After Effects / Lottie |
| Short blog/listicle | 16:9 featured image | 600–1,200 words | Google Docs / WordPress |
Key insight: Choose the format that maps directly to the distribution funnel — short vertical for reach, carousels for engagement, single images for quick brand posts, animated quotes for shareability, and short blogs for organic search. Use consistent tools to reduce friction between ideation and publish.
Step-by-step production checklist
- Draft headline and one-sentence angle.
- Write a short script or outline (vertical video: 3–6 beats; carousel: 3–7 cards).
- Create visual assets (shots, graphics, templates) following aspect ratios.
- Record audio/video; capture B-roll and a room tone clip.
- Edit to platform timing; tighten pacing and add motion.
- Add captions and on-screen text; check color contrast.
- Export with correct codec and bitrate; produce web and archive copies.
- Upload, write metadata, and schedule.
Accessibility essentials
Subtitles: Provide verbatim captions for videos.
Alt text: Describe images in 1–2 concise sentences.
Readable fonts: Use ≥16px body size and 4.5:1 contrast for text.
File naming: Date_slug_format_version (e.g., 2025-01-12_reel_productlaunch_v1)
Following these steps reduces rework and keeps publish cadence steady. Consistency in specs and templates saves hours per asset, and automating the final steps lets creators focus on ideas rather than exports.
Key Takeaway: Distribution begins with intention. Design content that makes sharing easy and obvious.
Distribution and Share Triggers
Distribution begins with intention. Design content that makes sharing easy and obvious. Then choose the right timing and prompts that boost early engagement. Focus on the first hour after publishing.
That’s when platforms decide whether to promote your content. Treat captions, CTAs, and formats as designed prompts that encourage tagging, reposting, and discussion.
Distribution Checklist
- Headline & hook: Write a single-sentence hook that fits the platform preview and sparks curiosity.
- Platform-tailored format: Convert the same idea into short video, carousel, and native link post before publishing.
- Primary CTA for shares: Add an explicit share/tag request in the first sentence of the caption.
- Seed audience: Line up 10–20 colleagues, superfans, and collaborators to engage in the first 10–20 minutes.
- Tracking signals: Set UTM parameters and monitor share counts, saves, comments, and CTRs.
- Boost guardrails: Decide boost budget and KPIs ahead of time; only promote if organic early signals meet thresholds.
- Schedule + automation: Queue native-first posts and cross-promote snippets in Stories/shorts within the first 60 minutes.
Caption Templates (use and adapt)
- Direct share ask: “If this helped, share this post with someone who needs it — tagging them makes it easier.”
- Tag request: “Tag one person who would try this today — I’ll follow up with a quick checklist.”
- Comment-to-share loop: “Drop your biggest challenge below — I’ll compile replies into a shareable guide and tag contributors.”
- Repost incentive: “Repost to your Story and mention me for a shout-out next week.”
When to boost vs organic push
- Decide boost only after
first-hourperformance: wait 60 minutes. - If engagement rate > platform average and CTR > target, allocate paid support.
- Use small A/B boosts (two audiences) to validate CTA effectiveness before scaling.
First-hour engagement best practices
- Seeding: Ask 10–20 insiders to like/comment within 0–15 minutes; that initial activity triggers algorithmic attention.
- Reply fast: Respond to first 50 comments within the hour to keep the conversation active.
- Micro-content: Post a 15–30s clip or carousel extract 20–40 minutes post-publish to capture different feeds.
- Monitor signals: Watch saves, shares, and profile visits — these beat simple likes for long-term distribution.
Optimal posting times and engagement signals per platform
Table: for Distribution and Share Triggers — Platform, Best Time Window, Share Signals to Watch & more
| Platform | Best Time Window | Share Signals to Watch | Format Preference |
|---|---|---|---|
| 9:00–11:00 & 19:00–21:00 local | saves, shares to Stories, DMs | short video, carousel, Reels | |
| TikTok | 18:00–22:00 local | rewatches, shares, duets | vertical short video (15–60s) |
| 13:00–16:00 local | reshares, comments, CTR | link posts, native video | |
| Twitter/X | 08:00–10:00 & 18:00–21:00 local | retweets, quote tweets, clicks | threads, short text + link |
| 07:00–09:00 & 17:00–18:00 weekdays | reshares, thoughtful comments, profile clicks | long-form post, article, carousel |
Key insight: These windows balance commuter browsing and evening scrolling. Treat each platform’s share signals differently — saves/rewatches indicate sticky content while shares/retweets indicate public endorsement — and formats to match those behaviors.
For teams that want to automate seeding, scheduling, and early testing, integrating an AI-driven pipeline can reduce manual steps and keep first-hour tactics consistent across posts. Use the checklist, adapt captions to voice, and treat the first hour as the tactical sprint that determines whether content earns the slow-burn rewards of wider distribution.
Key Takeaway: Start by treating communities and creators as distribution engines, not just promo channels. Focus on fit — audiences that already trust the creator and talk about topics adjacent to your content — and build a simple, repeatable workflow that…
Amplify Shareability with Community & Partnerships
Start by treating communities and creators as distribution engines, not just promo channels. Focus on fit — audiences that already trust the creator and talk about topics adjacent to your content — and build a simple, repeatable workflow that turns collaborations into measurable traffic and engagement.
Clear target audience: Know the audience segment the partner reaches and how it overlaps with your readers.
Content assets ready: Have a polished asset (article, video, or data visual) and 1–2 short versions sized for partner channels.
Measurement plan: Predefine the KPIs and UTM scheme before outreach begins.
How to identify high-match creators and communities
- Audience overlap: Look for creators whose comments and shares mirror topics in your content.
- Engagement quality: Prefer creators with thoughtful comments and repeat engagement over raw follower counts.
- Channel fit: Prioritize the platform where your content already performs (e.g., LinkedIn for long-form B2B, Instagram for visual).
Partnership and UGC workflow — step-by-step
- Map 20–30 potential partners by audience overlap and platform fit.
- Segment into three tiers (micro, mid, macro) and decide the outreach cadence for each.
- Prepare a concise pitch and asset package: main asset, short teaser, suggested captions, and
image/videosizes.
- Outreach using the template below, then follow up twice with value-first reminders.
- Collect UGC and co-created assets; give rapid feedback and finalize publishing windows.
- Track performance with campaign tags, adjust allocations, and scale the best-performing partnerships.
Outreach template (short and effective)
Subject: Quick collab idea for your [channel] audience
Hi [Name], I loved your recent post on [topic]. I have a short piece that would spark great discussion with your audience — includes a ready-made 45–60s clip and pull quote. Deliverables I can provide: article link, 45s video, 3 caption options, and suggested CTA.
What’s your rate or preferred swap, and when could you share it?
Best, [Your name]
Tracking and attribution best practices
- UTM consistency: Use
utm_source,utm_medium,utm_campaignand autm_contentvalue indicating creator name. - Campaign tags: Create a naming convention like
partnership_[creator]_[month]. - Native platform pixels: Ensure partner posts include tracked links or encourage link-in-bio redirects to capture conversions.
Scaleblogger’s automation can help scale this pipeline by generating caption options and automating UTM tagging for each partner link. When partnerships are treated like experiments — measured, iterated, and scaled — they stop being one-offs and become predictable growth channels.
Measure Shareability and Iterate
To measure shareability, focus on actions that drive real shares, not just surface-level metrics. Focus on a compact set of KPIs that connect creative elements to real sharing: who saw it, who engaged, who felt compelled to pass it on. This clarity makes A/B tests actionable and helps you establish a smooth iteration process.
KPI definitions
Share Rate: Shares divided by engagements. Alternate share rate: Shares divided by impressions (use when engagement is low). Engagement Rate: (Clicks + reactions + comments + saves) / impressions.
Amplification Ratio: New followers driven by shares / total shares. Share-to-Conversion: Conversions attributed to shared traffic / total conversions.
Dashboard fields to include
- UTM parameters: Track campaign, variant, and placement.
- Platform: Facebook, LinkedIn, X, TikTok, etc.
- Format: Video, carousel, long-form, short post.
- Hook: Headline or leading sentence variant.
- Share count: Absolute shares and shares/day.
- Impressions & engagements: Required to compute rates.
- Audience cohort: Organic vs. paid, demographic buckets.
- Conversion events: Newsletter signups, pageviews, purchases.
A/B testing cadence (practical sequence)
- Plan the test: define hypothesis, primary KPI (usually Share Rate), two clear creative variants.
- Launch with matched budgets and placements to avoid bias.
- Run until statistical thresholds met (see sample-size guidance), then evaluate primary KPI and secondary signals (amplification, conversion).
- If winner is clear, scale the creative; if inconclusive, iterate the creative or expand sample.
Sample-size and timing guidance
- Minimum exposure: Aim for at least 1,000–2,000 impressions per variant for social platforms before evaluating early signals.
- Behavioral events: If optimizing for shares, target 100+ share events per variant for reasonable confidence.
- Short windows: For time-sensitive trends, accept smaller samples but plan a rapid follow-up test.
- Statistical test: Use a two-proportion z-test or binomial comparison for share rates; many dashboards automate this.
A 30/60/90 testing and iteration plan with milestones
Table: Measure Shareability and Iterate — Timeframe, Focus, Actions & more
| Timeframe | Focus | Actions | Success Criteria |
|---|---|---|---|
| 0–30 days | Validate creative hooks | Deploy 3–4 hooks; track share rate, impressions, engagements | One hook ≥15% higher share rate vs baseline |
| 31–60 days | format and placement | A/B test format (video vs image) and platform allocation | Winner shows ≥10% uplift in share rate and positive conversion signal |
| 61–90 days | Scale winning combinations | Increase organic+paid reach for winners; add new audience cohorts | Scaled content maintains share rate within 5% of test result |
| Ongoing scale | Systematize learnings | Create template library, automate scheduling, measure long-term uplift | Increasing amplification ratio and lower CAC from shared traffic |
Key insight: A structured 30/60/90 plan turns one-off virality attempts into repeatable experiments. Track share-centric KPIs, keep dashboards granular (UTMs, hook, format), and treat share rate as the primary north star for organic distribution.
For end-to-end automation of testing and scheduling, consider using an AI content automation platform like Scale your content workflow to manage variants and benchmark performance. Iterate quickly—shareability compounds when tests are small, frequent, and measured against consistent metrics.
Troubleshooting Common Issues
Low shares and reach usually come from a mix of distribution problems, weak resonance with the audience, or technical blockers. Start by diagnosing what’s actually failing, then apply quick fixes to regain momentum and longer-term controls to stop it from happening again.
Confirm analytics access, publishing permissions, and current social metadata (titles, descriptions, images).
Diagnostic checklist — find the root cause
- Audience mismatch: Content topics, tone, or format don’t match the channel or follower expectations.
- Poor creative: Thumbnails, headlines, or opening lines fail to grab attention.
- Timing and cadence: Posting times or frequency are off for your audience’s activity windows.
- Technical blockers: Missing
og:tags, slow page load, or broken share buttons. - Distribution gaps: No paid amplification, partner mentions, or cross-posting strategy.
- Content discoverability: Weak SEO or unclear intent prevents organic reach.
Conclusion
You’ve walked through finding shareable ideas with social listening, crafting hooks that prompt action, producing formats that travel, and measuring what actually spreads. A mid-size ecommerce brand that leaned into trend-led short videos doubled referral traffic by focusing on one strong hook per campaign; a niche B2B newsletter increased forward rates by adding community-sourced anecdotes. If you’re wondering how often to test new hooks or what metric truly matters, start small: run weekly experiments, measure forwards and referral lifts, and treat patterns from social media trends as signals, not commandments.
- Prioritize one clear share trigger per piece (emotion, utility, or novelty).
- Batch ideation with social listening so content creation keeps pace with trends.
- Measure forwards and referral traffic, then iterate on formats that move the needle.
Move from ideas to systems: pick one workflow to automate this month—sourcing ideas, templating hooks, or scheduling distribution—and test it for four weeks. To that setup and scale consistent, shareable content, platforms like Automate your shareable content creation can handle the heavy lifting so teams focus on creativity, not busywork.
