

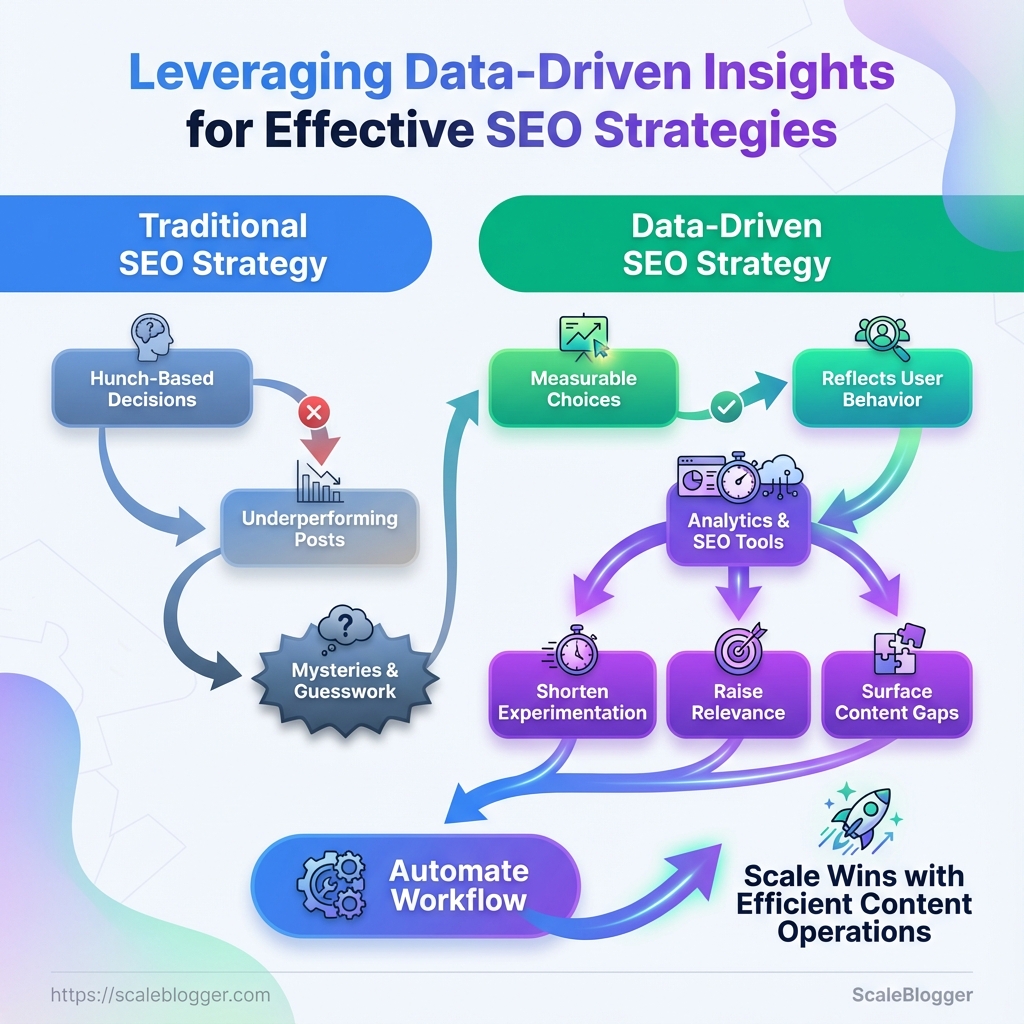
Leveraging data-driven insights for effective SEO strategies helps teams replace guesswork with measurable decisions based on real search and user behavior.
Instead of choosing topics, keywords, and page updates based on assumptions, data-driven SEO uses insights from Google Analytics, Search Console, SEO tools, and site audits to identify what deserves attention.
These insights can reveal ranking opportunities, content gaps, technical issues, and pages with strong potential for improvement.
With consistent SEO data analysis, teams can prioritize the right changes, measure their impact, and continuously improve organic performance.
What You’ll Need (Prerequisites & Tools)
Start with clean access and a tight toolset. Before starting any data-driven SEO work, confirm who owns the analytics and ensure proper permissions are set. Choose an SEO platform that fits your budget and goals. Also, set up reliable exports and storage to make sure nothing gets lost.
These steps speed up audits, make reporting consistent, and keep experiments safe.
Analytics accounts & permission levels: Make sure a team admin owns Google Analytics 4 and Google Search Console. SEO tool access: Service accounts or user seats for an SEO platform (Ahrefs, SEMrush) with export rights. Data export & storage: Centralized storage (Google Drive, AWS S3, or enterprise storage) and an automated export schedule.
Skillset baseline: Familiarity with GA4 events, basic SQL or spreadsheet formulas, and on-page SEO concepts.
- Grant permissions in this order:
- Add a team admin in Google Search Console.
- Add
EditororAdministratorin GA4 for the person running reports.
- Create an API key or service user for your SEO tool and test one sample export.
Tools & materials
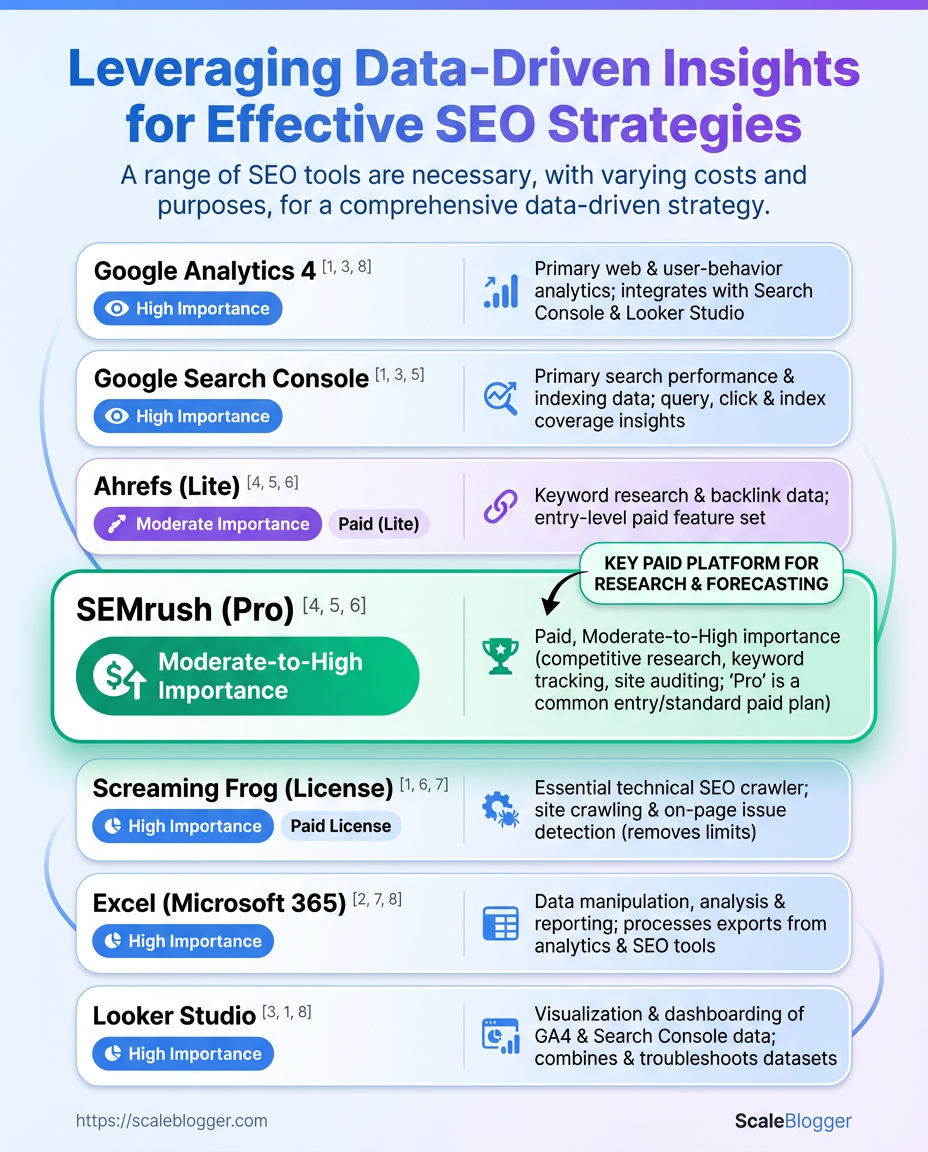
- Google Analytics 4: Core behavioral data and conversion tracking.
- Google Search Console: Search presence, index coverage, and query data.
- SEO platform (Ahrefs/SEMrush): Keyword research, backlink analysis, and site-level visibility.
- Crawl tool (Screaming Frog): Technical crawl data and URL-level metadata.
- Spreadsheet/BI tool (Excel/Looker Studio): Data modeling, dashboards, and visualizations.
Necessary tools, why they’re needed, and recommended plan tiers
Table: What You’ll Need (Prerequisites & Tools) — Tool, Purpose, Minimum Plan & more
| Tool | Purpose | Minimum Plan | Prep Action |
|---|---|---|---|
| Google Analytics 4 | Behavioral metrics, events, conversion tracking | Free | Create property, define events, verify data stream |
| Google Search Console | Search queries, index status, URL inspection | Free | Verify site, submit sitemap, assign owners |
| Ahrefs | Keyword research, backlinks, organic traffic estimates | Lite $99/mo | Create project, connect GSC, run site audit |
| SEMrush | Keyword tracking, competitor insights, content tools | Pro $119.95/mo | Add domain, configure position tracking, schedule exports |
| Screaming Frog | Full-site crawl, redirect chains, metadata issues | Free (500 URLs), License £219/yr | Install desktop app, set crawl config, export CSVs |
| Excel / Looker Studio | Data modeling, reporting, dashboards | Excel via Microsoft 365 $69.99/yr; Looker Studio free | Build templates, connect GA4/GSC, automate refreshes |
Key insight: Aligning permissions, export routines, and a mix of behavioral + crawl + keyword tools creates a reliable pipeline for data-driven SEO. Start with free Google tools, add an SEO platform for competitive depth, and use a crawl tool plus BI spreadsheets to turn data into action.
Confirming access and exports up front saves days later when chasing missing metrics. With these tools and the few setup steps above, the team can run repeatable audits, score content, and measure impact reliably.
For help automating the export-to-dashboard flow or scaling this stack, consider using an AI content automation partner like Scaleblogger.com to speed up pipelines and reporting.
Time Estimate & Difficulty Level
A mid-sized data-driven SEO project typically takes about 4–8 weeks from initial data collection to the first actionable monitoring loop. Complexity scales with site size and technical debt: smaller blogs finish at the low end; enterprise sites with custom platforms push toward the high end. Below are practical time budgets for each step and reasons why tasks differ in difficulty.
- Scope drivers: number of pages, CMS flexibility,
crawl budget, existing analytics quality. - Skill drivers: familiarity with SQL or BigQuery, experience running technical audits, and capacity to implement site changes.
- Tooling: using automated pipelines (for example, an AI-powered content automation platform) cuts the manual hours significantly.
- Data collection and access often gets delayed by permission issues and instrumentation gaps.
- Keyword and SERP analysis depends on API limits and how many queries you run.
- On-page opportunity work is fast when templates are editable; slower when each page requires manual edits.
- Technical audits vary with platform complexity—headless or custom CMSes add hours.
- Execution and monitoring pace depends on whether changes are deployable via CI/CD or need tickets and developer sprints.
Breakdown of time estimates and difficulty per major step
Table: Time Estimate & Difficulty Level — Step, Estimated Time, Difficulty & more
| Step | Estimated Time | Difficulty | Who should do it |
|---|---|---|---|
| Data collection & access | 8–24 hours | Medium — permissions + instrumentation | Analytics engineer / SEO analyst |
| Keyword & SERP analysis | 12–36 hours | Medium — tooling + API limits | SEO strategist / keyword researcher |
| On-page opportunity analysis | 16–40 hours | Medium-high — content mapping + templates | Content strategist / SEO analyst |
| Technical SEO audit | 20–60 hours | High — complex sites, JavaScript rendering | Technical SEO / DevOps |
| Execution & monitoring | 2–8 weeks (iterative) | Medium — dependent on deployment process | Dev team + SEO analyst |
Key insight: The table shows where bottlenecks typically appear — technical audits and execution are the most time-variable. Investing in automation and better instrumentation moves hours from manual analysis into repeatable pipelines.
For teams wanting to shorten the calendar, automating the data pipeline and using templated content updates reduces per-cycle time dramatically (this is where an AI content automation platform becomes cost-effective). Focus first on clearing access and analytics gaps; everything else moves faster once reliable data is available.
Step-by-Step Implementation: Collect & Clean Data
Think of data collection and cleaning as building a reliable foundation; everything else in the content work rests on top of it. Collect exact exports, normalize fields, run quality checks, and produce a single master table you can trust for analysis and automation.
Data sources: Verified access to Google Search Console (GSC), GA4 property, and a site crawl tool export (CSV). Tools & materials: Spreadsheet or database (BigQuery/Postgres), scripting environment (Python or R), and a crawl tool CSV (Screaming Frog, Sitebulb). Time estimate: 2–6 hours for small sites; 1–2 days for large sites with iterative validation.
- Export exact datasets and date ranges
- Export GSC:
Performance → Search Resultswithpage,query,clicks,impressions,ctr,positionfor the target date range (recommended: last 90 days).
- Export GA4:
Acquisition → Traffic acquisitionwithpage_path,sessions,engagement_time,conversionsfor same date range.
- Export crawl CSV: full crawl with
status_code,canonical,meta_robots,page_url.
- Normalize and map columns
- Standardize URLs: remove trailing slashes, force lowercase, strip UTM/query strings (keep important query params if needed).
- Map
page(GSC) andpage_path(GA4) to a canonicalpage_url. Use aurl_cleanfunction in code:normalize_url(url).
- Convert date fields to ISO (
YYYY-MM-DD) and numeric metrics to integers/floats.
- Quality checks and validation
- Row counts: confirm GSC rows ≈ expected unique page-query pairs; flag sudden drops.
- Value ranges:
clicks >= 0,impressions >= clicks,ctr <= 1.
- Cross-source joins: sample 100 URLs and validate that GSC clicks roughly align with GA4 sessions trends (not exact matches).
- Build the master dataset and rules
- Join on
page_urlwith preference order: canonical redirect resolution → crawl data → GSC → GA4.
- Create flags:
is_indexable(fromstatus_codeandmeta_robots),has_content(word count > 200),high_traffic(top 10% by impressions).
Sample schema for the master dataset after cleaning (columns, data types, source)
Table: Step-by-Step Implementation: Collect & Clean Data — Column Name, Data Type, Source & more
| Column Name | Data Type | Source | Transformation Rule |
|---|---|---|---|
| page_url | string | GSC / GA4 / crawl CSV | Normalize: lowercase, remove UTM, add trailing slash consistency |
| query | string | GSC | Trim, dedupe common stopwords, map synonyms if needed |
| clicks | integer | GSC | Cast to int, replace negative/null with 0 |
| impressions | integer | GSC | Cast to int, aggregate duplicates by page_url+query |
| crawl_status_code | integer | crawl CSV | Map to canonical set (200,301,404,410), infer is_indexable |
Key insight: This schema keeps strings and metrics separated, prioritizes canonical URLs from the crawl, and ensures numeric hygiene so downstream models and dashboards aren't poisoned by bad types or inconsistent URL formats.
For automation and scaling, pipe this workflow into a reproducible script or an ETL job. Tools like Scaleblogger.com can help automate content pipelines once the master dataset is reliable. Getting the collection and cleaning right saves hours later and makes analysis actionable.
Key Takeaway: Start by mapping user intent and SERP features in your content. This step quickly finds easy wins and long-term opportunities.
Step-by-Step Implementation: Analyze & Prioritize Opportunities
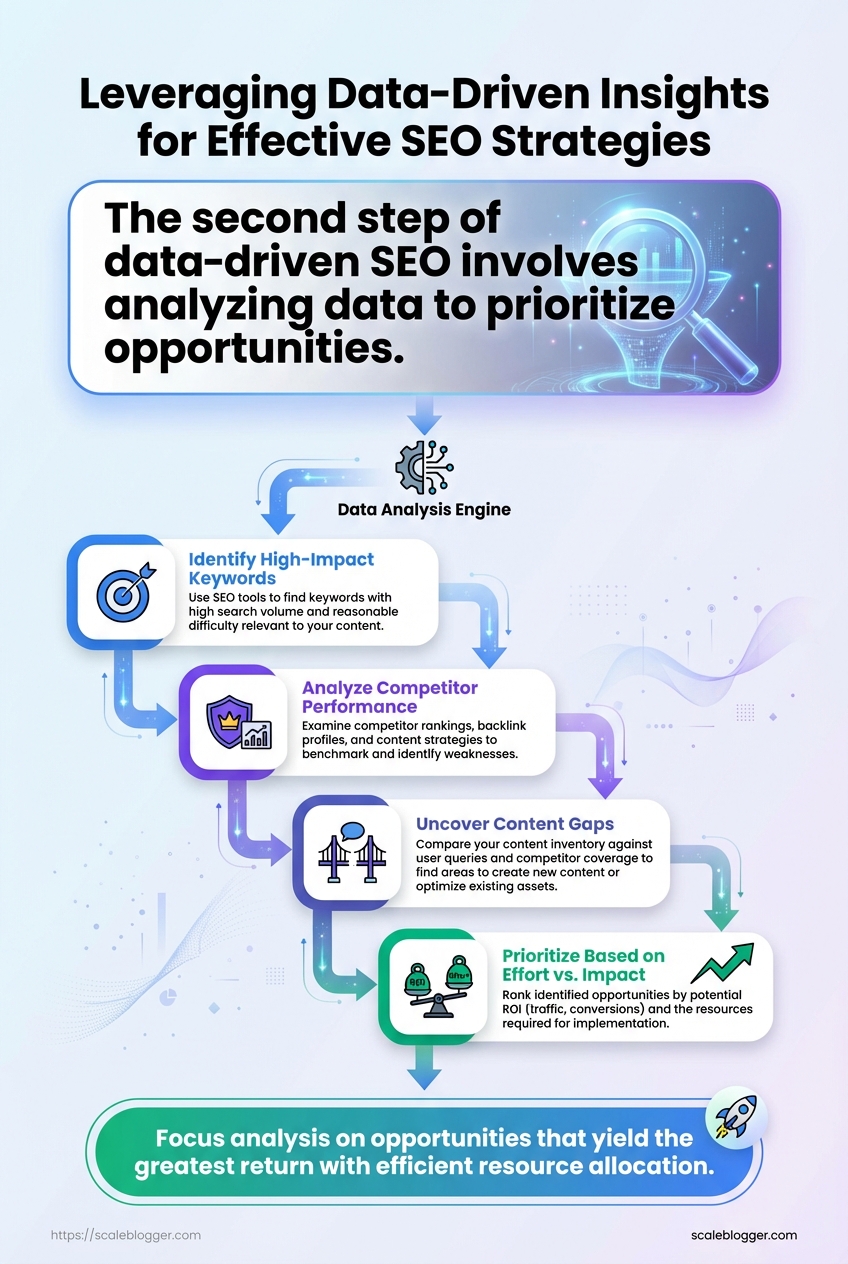
Start by mapping user intent and SERP features in your content. This step quickly finds easy wins and long-term opportunities. Then apply a repeatable competitor-gap methodology and a numeric opportunity score so decisions aren’t opinions but measurable trade-offs.
- Catalog intent segmentation and SERP feature mapping
- Perform competitor gap analysis
- Calculate opportunity scores with sample formulas
- Rank and bucket pages into priority lanes
- Create execution plan with estimated effort and metrics
Intent segmentation: Break queries into informational, commercial, transactional, and navigational buckets so optimizations match user expectations.
SERP feature mapping: Record whether a query returns featured snippets, People Also Ask, video, shopping, or local packs — these features change the tactics and expected traffic uplift.
Competitor gap methodology
Start with cleaned exports and fresh SERP snapshots, then:
- Baseline content audit: Identify pages with traffic but weak rankings (positions 6–20).
- Competitor content pull: Save top-10 competitor URLs and extract word count, headings, schema presence, and backlink counts.
- Gap signals: Flag missing formats (video, tables), missing intent matches, and absent schema as prime upgrade opportunities.
- Action mapping: Pair each gap with the simplest fix (add FAQ schema, restructure headings, or create a comparison table).
Opportunity scoring and sample formulas
Use a simple, transparent formula that weighs impact and effort. Example:
- **Opportunity Score = (Traffic Potential Click-Through Modifier Conversion Value) / Effort**
Implement with concrete proxies:
Traffic Potential= Search volume × (1 - current CTR)Click-Through Modifier= 1.0 for organic, 1.3 if page can gain a featured snippetConversion Value= estimated revenue per conversion (or lead score)Effort= hours to update + production time
Example numeric substitution: Opportunity Score = (2,000 0.7 0.5) / 10 = 70
Practical steps to keep this operational
- Automate exports: Schedule weekly keyword and rank pulls.
- Score consistently: Use the same proxies across pages to compare apples-to-apples.
- Triage quickly: Move anything scoring above your historical mean into an execution sprint.
Prioritization matrix comparing Opportunity Score, Effort, and Expected Impact
Table: Step-by-Step Implementation: Analyze & Prioritize Opportunities — Page / Query, Opportunity Score, Effort (hrs) & more
| Page / Query | Opportunity Score | Effort (hrs) | Priority |
|---|---|---|---|
| Top converting blog post | 120 | 8 | High |
| High-impression non-ranking page | 95 | 12 | High |
| Thin pages with crawl issues | 40 | 6 | Medium |
| Pages with rich results potential | 150 | 14 | High |
| High-value product pages | 110 | 20 | Medium |
Key insight: The matrix groups pages by realistic effort and upside so teams can assign sprints that move KPIs quickly. Pages with rich result potential and already-converting posts frequently offer the fastest lift when paired with schema and intent-aligned rewrites.
Where helpful, surface these scores into a shared dashboard or feed them into an automated pipeline like Scaleblogger.com to turn prioritized opportunities into scheduled work and measurable wins. Taking a data-driven, repeatable approach keeps the team focused on impact rather than busywork.
Key Takeaway: Make focused, reversible edits in the CMS and codebase to start. Then, run a thorough quality assurance loop before publishing.
Tips for Success & Pro Tips
Start by treating analytics and experiments like engineering work: instrument, test, observe, iterate. Clean data and well-defined tests help small content changes show real benefits instead of distractions. Team alignment makes these wins repeatable.
Analytics hygiene and validation
Good measurement starts before you publish anything.
Event taxonomy: Define consistent event names, properties, and required fields for every content type. Data retention rules: Keep raw event logs long enough to validate experiments and reprocess if tracking changes. Sampling checks: Compare aggregate metrics against raw logs weekly to catch dropped events or broken tags.
Practical example: if article_read sometimes lacks author_id, queries will undercount author-level performance — add a required author_id field and backfill when possible.
- Use consistent UTM conventions: standardize campaign and source values.
- Validate post-implementation: check a random sample of sessions for expected events within 48 hours.
- Automate alerts: set thresholds for sudden drops in pageview or conversion events.
Experimentation and measuring lift
Run experiments with the same rigor as product A/B tests.
- Define the metric hierarchy: primary KPI, guardrail metrics, and secondary outcomes.
- Estimate detectable effect sizes using baseline variance; if your traffic is low, prioritize high-impact changes or longer windows.
- Segment by intent and channel: a headline change may lift organic CTR but not paid traffic.
Example: a template change increased time-on-page by 12% for organic visitors but reduced referral conversions — splitting results by channel revealed the trade-off.
- Pre-register hypotheses: state expected direction and magnitude before testing.
- Use holdouts for seasonality: keep a small, stable control group across experiments.
- Measure cumulative lift: track how individual wins compound in the funnel.
Cross-functional workflows
Make experiments operational, not optional.
Content QA: Editors validate SEO and analytics hooks before publish. Dev handoff: Use feature branches with automated tests that assert analytics events fire. Growth syncs: Weekly 30-minute cadence between content, analytics, and engineering to review failures and wins.
When tooling helps, tie it to workflows—automated checks that fail a deploy when critical events are missing save hours of firefighting. For teams looking to scale execution and measurement, consider platforms that automate pipelines and benchmarking like Scaleblogger.com.
Small measurement improvements compound into reliable decisions; invest in hygiene, run thoughtful tests, and keep collaboration tight so insights actually turn into higher-performing content.
Measurement & Reporting Templates
Start by separating what executives need from what the team needs. Executives want concise trend signals and outcomes; the team needs diagnostic detail and action items. Create two linked dashboards. One dashboard should provide executives with a high-level view (weekly or monthly snapshots).
The other should be an operational workspace with daily and real-time widgets for PR, product, and engineering teams.
Executive metrics: Short list of outcome-focused KPIs that show direction and risk.
Operational metrics: Detailed diagnostics that explain why a trend moved and where to act.
Dashboard design essentials
- Clear ownership: Assign one person per widget. Single source of truth: Prefer
GA4for session/goal data,GSCfor query-level impressions/CTR, crawl exports for technical issues, and your conversion platform for final attribution. Actionability: Every widget should suggest a next step or responsible owner.
- Visibility rules: Executive dashboard emailed to leadership; operational dashboards pushed to Slack or the workflow tool.
- Map widgets to data sources.
- Define refresh cadence and distribution list.
- Build alerts and annotation rules.
Widget and data-source mapping works best when written down and versioned. Below is a practical blueprint to copy into any BI tool or Google Sheet.
Map dashboard widgets to data sources and update cadence
Table: Measurement & Reporting Templates — Widget, Data Source, Purpose & more
| Widget | Data Source | Purpose | Update Frequency |
|---|---|---|---|
| Top pages by impressions | GA4 & GSC | Surface pages driving visibility and where to prioritize optimization | Daily |
| CTR by query cluster | GSC & crawl exports | Detect content vs meta issues across topic clusters | Weekly |
| Organic conversions | GA4 & conversion platform | Tie organic traffic to revenue or goal completions | Daily |
| Technical issues by severity | crawl exports | Track site health, crawl errors, indexability blockers | Real-time / On crawl |
| A/B experiment results | conversion platform & GA4 | Measure lift and determine rollout decisions | At experiment completion / Weekly interim |
Key insight: This blueprint forces discipline — every widget lists a data source and cadence, which reduces “who owns this” debates. Daily refreshes for conversions and top pages keep the team nimble, while weekly query-cluster and experiment reviews balance signal stability with speed.
Practical reporting cadence and distribution:
- Daily: Operational alerts (technical failures, conversion dips) to owners via Slack. Weekly: Team sync with detailed diagnostics and action items. Monthly: Executive summary emailed with 3–5 strategic signals and resource asks.
- Quarterly: Deep-dive performance review with experiments and roadmap adjustments.
For a faster setup, plug this blueprint into your BI tool or use an automation partner to wire GA4, GSC, crawl data, and your conversion platform. Tools that automate these connectors save hours and keep dashboards honest — for example, implementing an AI-driven pipeline that standardizes metrics and schedules reports dramatically reduces manual churn; learn more at Scaleblogger.com.
Good measurement keeps the team aligned and prevents firefights over data. When widgets are mapped, cadences set, and owners named, reporting becomes a decision-support system instead of noise.
Conclusion
This process is about swapping guesswork for signals: start by getting your analytics clean, then use that clean dataset to prioritize pages where small changes move the needle. Teams that ran a focused clean-data sprint, reworked metadata on high-traffic pages, and tracked results saw measurable uplifts within a few weeks — proof that disciplined analysis beats intuition alone. Expect the work to follow a rhythm: clean the data first, prioritize high-impact pages, and measure before and after so decisions stay evidence-led rather than hopeful.
