Most content teams can point to steady traffic and still feel uncertain about value — pageviews rise while conversions stall and priorities blur. That disconnect usually traces back to a handful of overlooked signals: how SEO metrics map to business goals, which slices of content actually drive repeat engagement, and whether current measurement lets teams separate noise from meaningful change.
Too many leaders treat reporting as a daily ritual instead of a diagnostic. Clear wins come from aligning content performance with a repeatable benchmark, then testing only the variables that move that benchmark predictably. Practical benchmarking techniques start small, require consistent tagging and version control, and focus on lift rather than vanity. Explore Scaleblogger’s automation for content benchmarking
What You’ll Need (Prerequisites)
Start by treating setup as a gatekeeper: without the right data sources and basic skills, any benchmarking or content-performance work will be slow and noisy. You need reliable measurement, a way to manipulate data, and people who can interpret SEO metrics into actions. Below is a practical checklist that gets a team from zero to operational in a single planning session.
Core tools and access
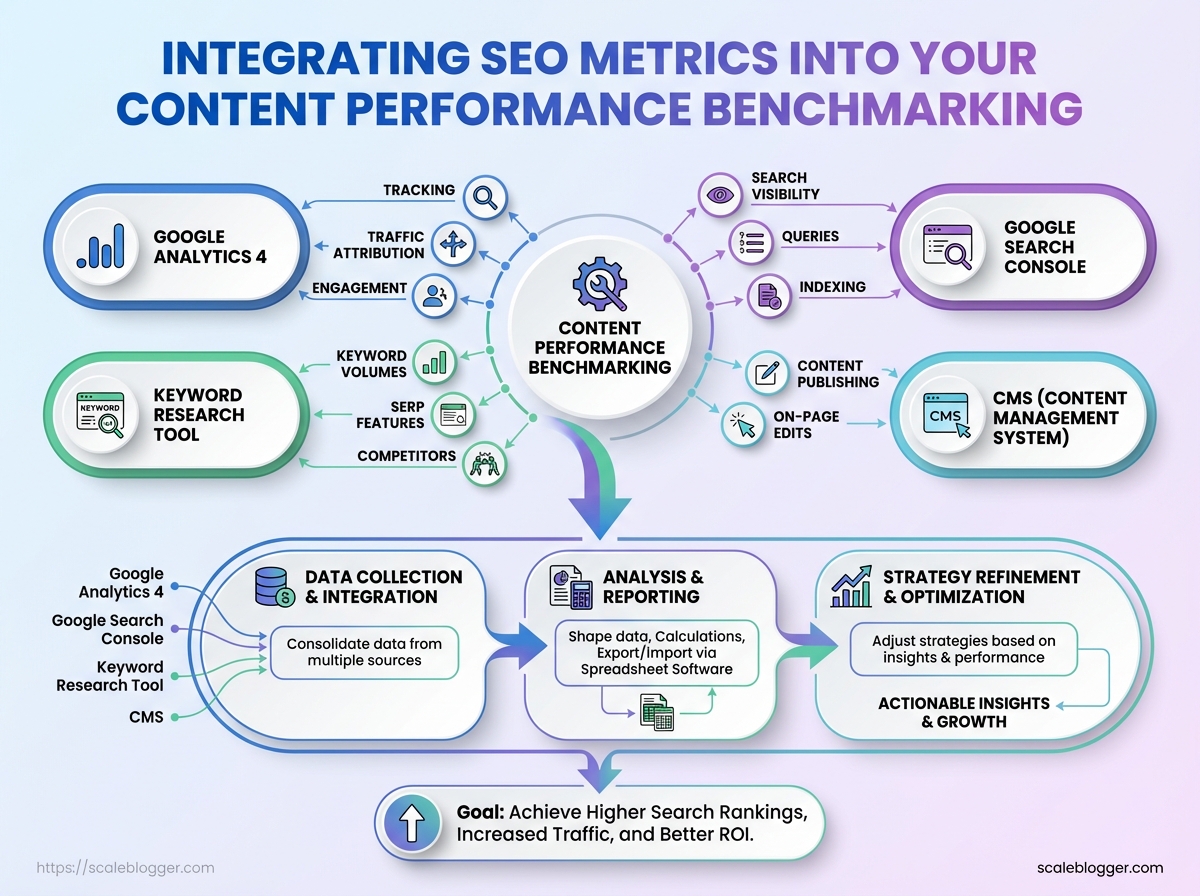
- Google Analytics 4 (
GA4) — tracking, traffic attribution, engagement metrics - Google Search Console — search visibility, queries, indexing issues
- Keyword research tool (Ahrefs/SEMrush/Moz) — keyword volumes, SERP features, competitors
- CMS (WordPress, Webflow, or equivalent) — content publishing and on-page edits
- Spreadsheet software (Google Sheets/Excel) — data shaping, calculations, export/import
Data ranges and history
- Minimum historical depth: 6 months of consistent data
- Recommended depth: 12 months for seasonality and trend smoothing
Essential skills
- Analytics literacy: understands sessions, users, conversions, and attribution windows
- Spreadsheet proficiency:
pivot tables,VLOOKUP/XLOOKUP, basicARRAYFORMULAor equivalent - SEO KPI fluency: ability to interpret impressions, CTR, average position, and organic conversions
Access checklist — sequential steps
- Request
Editoraccess to Google Analytics 4 andFullaccess to Google Search Console. - Obtain CMS admin/editor credentials or a documented publishing workflow and a Sandbox site for test changes.
- Provision a shared spreadsheet with version history and a template for KPI tracking.
Quick comparison of required tools, why they matter, and minimum access level
| Tool | Purpose | Minimum Access | Quick Setup Tip |
|---|---|---|---|
| Google Analytics 4 | Traffic sources, engagement, conversions | Editor | Enable GA4 integration and set up events before analysis |
| Google Search Console | Search queries, indexing, performance | Full (site verification) | Verify with DNS or GA4 and submit sitemap |
| Keyword research tool (Ahrefs/SEMrush) | Keyword volumes, gap analysis | Read-only API or user | Export keyword lists and SERP features weekly |
| CMS (WordPress/Webflow) | Publish edits, meta tags, structured data | Editor/Admin | Use a staging environment and update robots.txt only when ready |
| Spreadsheet (Google Sheets/Excel) | Data joins, KPIs, dashboards | Edit (shared) | Create master tab with raw imports and dashboard tab for viz |
Key insight: These five systems form the minimum data backbone. Granting the correct access levels up front and keeping a single canonical spreadsheet reduces duplicated effort and helps teams act on SEO metrics faster.
Understanding these requirements clears the runway for analysis and automation. When everyone has access and a shared data model, work transforms from ad-hoc reporting to repeatable performance improvements. This foundation lets teams prioritize execution over data wrangling.
Establishing Baseline Content Performance Metrics
Start by exporting a clean, timestamped snapshot of current content KPIs so analysis compares apples to apples. Capture both search-facing signals and engagement/conversion outcomes, label the file clearly, and avoid sampled data — that foundation determines whether optimizations move the needle or just shuffle noise.
What to export and why
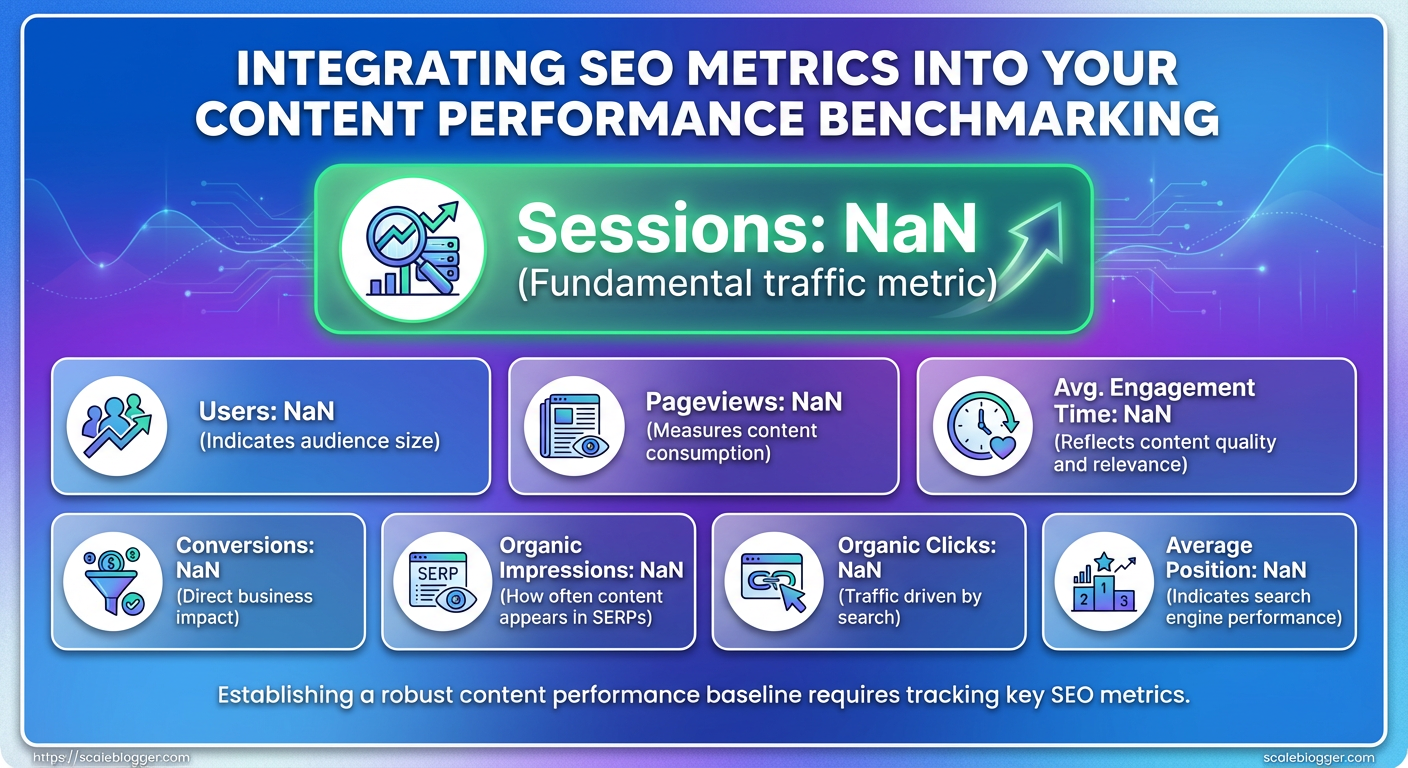
Sessions: Total visits to the page; shows general demand.
Organic Sessions: Visits originating from organic search; separates paid/social traffic.
Avg CTR: Click-through rate from Search Console; measures title/meta effectiveness.
Impressions: Total search impressions (12 months); indicates keyword reach.
Avg Position: Search visibility average (optional, noisy); use with caution.
Conversions: Primary goal completions (leads, purchases); ties content to business value.
Time on Page / Engaged Sessions: Engagement depth beyond simple bounce metrics.
Bounce / Engagement Rate: Quick health check on content relevancy and UX.
Step-by-step export process
- Log into
GA4andGoogle Search Console. - In
GA4, export page-level metrics for the last 12 months using thepage_pathdimension and includesessions,engaged_sessions,conversions, andaverage_session_duration. Export asCSV. - In
Search Console, export the performance report for the same 12-month range usingpage(orpage+queryif you need keyword mapping), capturingimpressions,clicks,ctr, andposition. Export asCSV. - Combine both CSVs in a spreadsheet or BigQuery, matching on normalized
page_pathor canonical URL. - Label the file with
export_date,date_range, andtool(example:content_baseline_GA4_SCC_2025-11-01_12mo.csv).
Export best practices
- Date range: Use 12 months to smooth seasonality.
- Sampling avoidance: Use API/BigQuery exports for large sites to prevent sampling.
- Labeling: Include tool, date range, export date in filename.
- Normalization: Strip query strings and trailing slashes when joining datasets.
- Verification: Spot-check 10–20 high-traffic pages to confirm joins.
Sample baseline export columns and example values to help readers map their own data
| Page/Cluster | Organic Sessions (12mo) | Avg CTR | Impressions (12mo) | Primary Goal Conversions |
|---|---|---|---|---|
| /blog/seo-basics | 18,450 | 4.2% | 420,000 | 120 |
| /guides/benchmarking-seo | 9,800 | 6.1% | 160,000 | 85 |
| /product/feature | 4,200 | 2.8% | 60,000 | 210 |
| /landing/category | 12,300 | 3.5% | 300,000 | 430 |
| /blog/top-converting-article | 22,700 | 7.4% | 310,000 | 1,025 |
Key insight: This combined view reveals which pages drive search volume versus conversions. High impressions with low CTR point to metadata opportunities; high CTR but low conversions often indicate a funnel or UX problem. Labeling and consistent date ranges make it trivial to rerun the same baseline quarterly and measure improvement.
Understanding and standardizing how baseline exports are created prevents later disputes about causality and helps teams prioritize pages where optimization will have the largest business impact. When the baseline is reliable, A/B tests and automation rules can be trusted to scale results.
Selecting the Right SEO Metrics for Benchmarking
Start by matching metrics to business objectives: each objective needs a single primary metric that ties directly to value, plus 2–3 supporting metrics that explain why the primary moved. Avoid vanity metrics unless they feed an action (e.g., impressions that trigger content rewrites). Weight metrics in a composite benchmark based on business impact, actionability, and data reliability.
How to map objective → metric (concise)
- Traffic-driven goals: Measure sessions and high-intent organic users, not just raw pageviews.
- Lead-generation goals: Favor conversions attributed to organic channels and assisted conversion metrics.
- Revenue goals: Track organic revenue and AOV (average order value), then use conversion rate as context.
Step-by-step: building a composite benchmark score
- Assign impact weight (40–60%) to the primary metric based on business priority.
- Assign explainability weight (20–40%) across supporting metrics to surface causes.
- Assign confidence weight (10–20%) for data quality (sampling, attribution noise).
- Normalize each metric to a 0–100 scale using historical min/max or industry percentiles.
- Calculate weighted sum and track movement week-over-week and against peer benchmarks.
Primary metric: The single number that signals success for the objective.
Supporting metric: Secondary measures that explain variance in the primary metric.
Actionable metric: A metric that directly informs a next step (e.g., “organic CTR up” suggests title/description A/B testing).
Practical examples and considerations
Example: For lead-gen, set primary = organic MQLs; supporting = organic sessions from priority landing pages, organic assisted conversions. Avoid: Using average time on page as a primary unless it correlates with conversion behavior in your funnel. * Data hygiene tip: Prefer GA4 event-driven metrics aligned to server-side or CRM data when possible.
Recommended SEO metrics across common objectives
SEO metrics comparison for objectives
| Objective | Primary SEO Metric | Supporting Metrics | Why it matters |
|---|---|---|---|
| Traffic Growth | Organic sessions | Organic unique users, organic impressions, organic CTR | Shows reach and early funnel demand; supporting metrics explain visibility vs. engagement |
| Lead Generation | Organic leads (MQLs) | Assisted organic conversions, landing page bounce rate, organic session quality | Directly ties SEO to pipeline; supporting metrics reveal conversion friction |
| Revenue / E-commerce | Organic revenue | Organic conversion rate, AOV, product page rankings | Measures bottom-line impact and per-visit value |
| Brand Awareness | Organic impressions | Branded search volume, organic share of voice, CTR on SERP features | Captures discoverability and brand preference signals |
| Product Education | Organic engagement (tutorial completions) | Time on resource, return visits, organic internal link clicks | Tracks usefulness of educational content and impact on product adoption |
Key insight: Pick one clear primary metric per objective, use supporting metrics to diagnose changes, and weight metrics in a composite score by impact, explainability, and data confidence.
Choosing the right metrics this way lets teams make decisions quickly while preserving signal quality for long-term strategy adjustments. When implemented consistently, this approach turns benchmarking from a reporting obligation into a decision-making tool.
Step-by-Step: Building Your Content Performance Benchmark
Start by defining what “good” looks like for your content channels, then measure everything against that baseline. A pragmatic benchmark focuses on the handful of SEO metrics that drive decisions—organic sessions, click-through rate, average time on page, conversion rate, and topical authority—and packages them into actionable scores and segments. Expect an initial setup time of a single workday; once in place the benchmark informs prioritization, content refreshes, and test design.
Time_estimate: 6–10 hours for the initial benchmark setup.
Difficulty_level: Intermediate.
Deliverables per step: Specific tables and charts — cleaned raw export, normalized metric table, composite score chart, priority segment list, action roadmap.
Tools & materials
- Data sources: GA4 or Universal Analytics export, Google Search Console CSV, CMS publishing logs, keyword tracking CSV.
- Analysis tools: Spreadsheet (Google Sheets/Excel), BI tool (Looker Studio/Power BI optional), simple Python/R scripts where available.
- Optional: AI-assisted tagging or content-scoring tools such as
Scaleblogger.comfor automated pipelines.
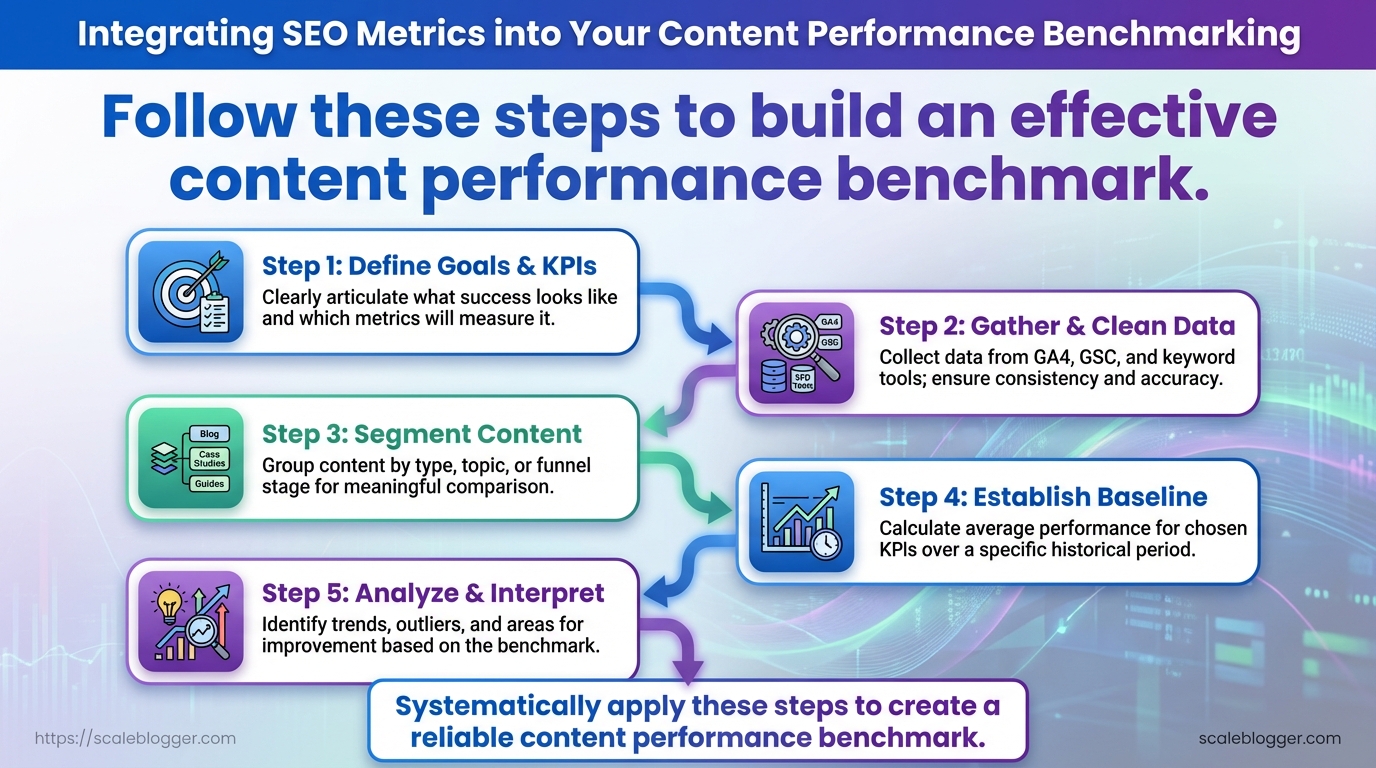
- Define objectives and KPIs.
- Export and clean data.
- Normalize metrics.
- Calculate composite scores.
- Segment and prioritize.
- Build action list.
- Assign tasks and timeline.
- Set re-benchmark cadence.
Decide which business outcomes the benchmark serves (traffic growth, lead generation, retention). Output a KPI manifest table listing metric, definition, and target range.
Pull last 12 months from analytics, remove crawl/referral spam, map URLs to content types. Output a cleaned CSV and a source-audit table.
Convert raw metrics into comparable scales (z-scores or min-max). Output a normalized metrics matrix ready for scoring.
Weight metrics by business impact and compute a content_score using a simple formula such as 0.4organic_sessions + 0.3ctr + 0.2time_on_page + 0.1conversion_rate. Output a sortable score table and distribution chart.
Create segments by topic, funnel stage, and performance band. Output priority buckets: High-impact wins, Refresh, Monitor, Archive.
Translate buckets into tasks: rewrite headlines, add internal links, update data, or repurpose into other formats. Output an action spreadsheet with estimated effort.
Map actions to owners, due dates, and dependencies. Output a Gantt-style timeline or cadence sheet.
Choose a re-run cadence (monthly for high-volume, quarterly otherwise). Output a process checklist and automated export schedule.
The step number, action, expected output, and estimated time
Key insight: this timeline balances rigor with speed — the first benchmark is heavier, subsequent runs focus on deltas and outcomes.
Understanding these steps lets teams implement a repeatable benchmarking practice that surfaces high-ROI work quickly and scales with automation. When implemented correctly, the process reduces time spent guessing and increases time spent executing high-value content updates.
Interpreting Benchmark Results and Prioritizing Actions
Begin by treating benchmark scores as decision signals, not final judgments. A high or low metric by itself doesn’t prescribe a fix — patterns across metrics, content type, and traffic source do. Read the numbers to surface clusters of opportunity (quick wins, structural fixes, and experiments) and convert those clusters into a prioritized action list tied to measurable KPIs.
How to read common score patterns High impressions + low CTR: indicates weak titles/meta or mismatched search intent. High sessions + short dwell time: suggests content meets discoverability but fails engagement. Low impressions across the board: points to topical relevance or indexability issues. Spikes in backlinks but no traffic lift: keyword targeting or on-page relevance is misaligned.
- Map each content item to impact and effort using two simple estimates: impact = expected traffic or conversion lift (low/med/high), effort = time or engineering resources (low/med/high).
- For each item, define a single primary KPI to measure success (example: organic
sessions,CTR, or goal conversions). - Convert estimated impact/effort to a ranked backlog and assign owners and deadlines.
Action priority matrix cross-referencing impact vs effort with example actions
| Impact | Effort | Recommended Action | Example KPI to Monitor |
|---|---|---|---|
| High impact / Low effort | Low | Rewrite title/meta, add list snippet | CTR, impressions |
| High impact / High effort | High | Revamp content cluster and internal linking | Organic sessions, SERP positions |
| Low impact / Low effort | Low | Small UX tweaks, add schema | Bounce rate, time on page |
| Low impact / High effort | High | Major redesign or re-platform | Conversions per visit |
| Monitor-only items | Varied | Watch seasonal or experimental content | Trend in impressions over 8 weeks |
Key insight: prioritize actions that move the needle quickly (High/Low) while planning resources for larger wins (High/High). Monitor low-impact items unless they support strategic initiatives.
Sample action templates (copy, adapt, execute)
- Rewrite Title + Meta: Update headline to include primary keyword and benefit; A/B test two titles; measure
CTRover 14 days. - Consolidate Content: Merge three thin posts into one authoritative piece; redirect old URLs; measure combined organic sessions and average position.
- CTA Test: Replace bottom-of-article CTA with contextual inline CTA; run experiment for 30 days; track conversions per session.
Estimate effort vs impact conservatively and re-score after one measurement cycle. Use automation to export scorecards and feed the prioritized list into your publishing pipeline — tools like Scaleblogger can help automate scoring and scheduling. Understanding these principles helps teams move faster without sacrificing quality.
Tracking, Automation, and Re-benchmarking Cadence
Automate measurement so the team sees problems before they become crises. Set up scheduled exports, real-time alerts for key signals, and a regular re-benchmark cadence tied to content type. That combination reduces busywork, keeps benchmarks current, and makes re-optimization a predictable part of the workflow.
Automating GA4 → Looker Studio → Spreadsheet sync
- Configure GA4 export.
- In GA4, create a custom report with core SEO metrics (
sessions,engagement_rate,average_engagement_time,conversions) and save it as an Explore or an API exportable view. - Build the Looker Studio dashboard.
- Connect Looker Studio to GA4 and create visual tiles for each metric by page or landing cluster.
- Automate spreadsheet sync.
- Use the Looker Studio scheduled CSV export or a connector (e.g., Sheet Connector, Supermetrics) to push daily or weekly rows into a Google Sheet.
- Version and archive on export.
- Each automated export writes a dated tab or a timestamped CSV to a versioned folder in Google Drive or your data lake.
Tip: Keep one column with benchmark_version so queries can compare current performance to the correct baseline.
Suggested alert thresholds and cadence
- Active campaign pages: Daily monitoring; alert if sessions drop >20% vs 7‑day moving average.
- Evergreen blog content: Weekly monitoring; alert if organic clicks decline >15% month-over-month.
- Product pages: Daily monitoring; alert if conversion rate falls >10% vs prior 30 days.
- Category/landing pages: 3x weekly monitoring; alert if bounce rate increases >12% vs baseline.
- Knowledge base/help: Weekly monitoring; alert if search exits increase >20%.
How to version and archive benchmark data
Benchmark snapshot: Save exported baseline as YYYYMMDD_benchmark_v# with metadata (source, filters, segment).
Version control: Increment v1, v2 when major changes occur (site redesign, taxonomy change, tracking updates).
Archive policy: Keep weekly snapshots for 3 months, monthly snapshots for 2 years, and critical baseline versions indefinitely.
Recommended re-benchmark cadence and monitoring frequency by content type
Recommended re-benchmark cadence and monitoring frequency by content type
| Content Type | Monitoring Frequency | Re-benchmark Cadence | Alert Thresholds |
|---|---|---|---|
| Active campaign pages | Daily | Every 2–4 weeks | Sessions ↓ >20% vs 7‑day MA |
| Evergreen blog content | Weekly | Every 3–6 months | Organic clicks ↓ >15% MoM |
| Product pages | Daily | Every 1–3 months | Conversion rate ↓ >10% |
| Category/landing pages | 3x weekly | Every 2 months | Bounce rate ↑ >12% |
| Knowledge base / help articles | Weekly | Every 6 months | Search exits ↑ >20% |
Key insight: Prioritize shorter re-benchmark cycles for pages tied directly to revenue or active campaigns; stretch cadence for evergreen and help content. Automating exports and clear versioning removes friction and makes re-benchmarking a regular, low-effort activity. When implemented correctly, this approach reduces overhead and lets teams act quickly on real signals while preserving clean historical baselines.
Troubleshooting Common Issues
Start by treating measurement problems like a detective case: identify where data diverges, create a short hypothesis, then run targeted corrections and verify results. Most measurement issues trace to mismatched tagging, sampling, or external noise (bots, seasonality). The fastest wins come from aligning identifiers across systems, fixing canonical and UTM consistency, and applying simple statistical filters for outliers and seasonal swings.
Common issues, probable causes, immediate fixes, and verification steps
| Issue | Probable Cause | Fix | Verification Step |
|---|---|---|---|
| Missing organic sessions | Improper utm parameters overriding organic channel |
Remove or standardize utm_source/utm_medium for internal links; use rel="noopener noreferrer" for third-party widgets |
Check organic sessions over 7 and 28 days in GA4, compare to landing page trends |
| Search Console impressions mismatch | URL variants (trailing slash, www/non-www) or canonical mismatches | Ensure rel="canonical" matches preferred domain and sitemap contains only preferred URLs |
Compare Search Console URL impression counts to sitemap and server logs for 14 days |
| High sampling in GA4 | Very large reports or unoptimized exploration with high cardinality | Narrow date range, add filters, or use BigQuery export for unsampled data | Re-run reports with smaller windows; validate totals against BigQuery or raw exports |
| Blocked bots inflating pageviews | Missing bot filters, server-side crawlers not identified | Implement server-side bot filters, update robots.txt, exclude known bot user agents in analytics |
Compare pageviews before/after filter; inspect user-agent lists in logs |
| Attribution errors for conversions | Cross-domain tracking or payment gateway redirects losing client IDs | Implement consistent client_id across domains via linker params and ensure post-redirect parameters persist |
Complete test conversion with debugger; confirm same client_id in entry and conversion hits |
Diagnosis checklist: Scan server logs for anomalies, Compare GA4 vs server vs Search Console, Isolate by date ranges.
- Reproduce the problem with a short controlled test (single page, single conversion).
- Audit tagging: export all
utmparameters, canonical tags, and hreflang values. - Apply one fix at a time and monitor 48–72 hours of new data.
Handling seasonality and outliers: Apply rolling 28-day averages, use year-over-year comparisons for the same date range, and flag outliers with z-score > 3 before benchmarking. When benching, exclude known campaign spikes and normalize metrics by traffic cohort.
When alignment fixes are applied, run a side-by-side comparison for at least two full cycles (weekly or monthly) to confirm stability. Consistent verification reduces churn and keeps the team focused on optimization rather than firefighting. This approach reduces noise and lets content teams act on reliable signals.
📥 Download: Content Performance Benchmarking Checklist (PDF)
Tips for Success and Pro Tips
Start with tight governance: versioned content artifacts, a clear taxonomy for topic clusters, and small, measurable experiments that validate benchmarking assumptions. Those three practices prevent chaos as an editorial team scales and make performance signals actionable instead of noisy.
Begin with version control and labeling conventions.
Version control: Use a single canonical spreadsheet or repo for benchmarks, with vYYYYMMDD suffixes and a changelog column so every edit is traceable.
Labeling convention: Standardize tag formats (use topic:subtopic, intent:informational|transactional) and enforce them in the CMS metadata fields.
Practical steps to implement quickly:
- Create a benchmark master file and store it in a controlled location (Google Drive with version history or a Git repo).
- Define a taxonomy table that maps clusters to primary/secondary tags and target keywords.
- Run a three-week experiment cadence: pick one cluster, run the change, measure SEO metrics and page-level engagement, then iterate.
Operational tips that save time and reduce rework: Automate audits: Schedule weekly crawls with a tool that exports to CSV so the benchmark sheet updates automatically. Enforce ownership: Assign a content owner and an analytics owner for each cluster; make approvals part of the publishing workflow. * Record context: Always add a Why field to experiments—what hypothesis is being tested and what success looks like.
Taxonomy and experiment examples
Experiment example
- Pick a 6–10 post cluster with clear intent alignment.
- Re-optimize internal linking and header structure on three pages.
- Measure
organic clicks,average position, andengagement rateat 14 and 28 days. - Decide: roll forward, iterate, or revert.
Taxonomy: Map clusters to site sections, audience segments, and conversion events so analytics reporting can join content performance to business outcomes.
Quick reference of governance actions, tools to use, and where to document each item
| Governance Action | Tool/Template | Location to Document | Recommended Owner |
|---|---|---|---|
| Benchmark spreadsheet versioning | Google Sheets v naming + changelog template |
Shared Drive > Benchmarks/Benchmark_Master.xlsx | Analytics Lead |
| Content cluster taxonomy | Taxonomy template (CSV) | CMS > Taxonomy Library / Confluence | Head of Content |
| Experiment tracking template | Google Sheets A/B experiment tracker | Projects/Experiments/Experiment_Tracker.xlsx | Growth PM |
| Dashboard ownership | Looker Studio dashboard template | BI Folder / Dashboards/Content_Performance | Analytics Lead |
| Alerting rules | GA4 alerts + Slack webhook config | Ops Runbook / Alerting.md | DevOps / Analytics |
Key insight: The table pairs a governance action with a simple tool and living document location so teams know where to look and who decides. Implementing these five controls reduces duplicated work and produces cleaner performance signals.
Understanding and applying these practices lets teams move faster without sacrificing quality. When governance is embedded in daily workflows, decisions become data-driven and repeatable.
Case Study Example (Worked Example)
This worked example walks through applying a content scoring framework to five pages, showing how raw metrics translate into a composite score and a recommended action. The example uses a sanitized GA4/Search Console export and a simple scoring rule: Composite Score = (Sessions rank 0.5) + (CTR rank 0.5) where rank is 1–5 (higher is better). The goal is to identify where to invest optimization time versus where to scale or consolidate content.
Dataset: Sanitized GA4/Search Console export with Organic Sessions and CTR for each URL.
Scoring rule: Composite Score uses normalized rank weighting (sessions and CTR equally weighted).
Tools & materials
- Data export: GA4 or CSV file with page-level metrics.
- Spreadsheet: Google Sheets or Excel for rank computations.
- Automation (optional): AI content automation like Scale your content workflow from Scaleblogger.com to generate update drafts.
Step-by-step process
- Export page-level metrics and load into a spreadsheet.
- Rank pages separately by Organic Sessions (1 lowest → 5 highest) and CTR (1→5).
- Compute composite score using
Composite Score = (SessionsRank 0.5) + (CTRRank 0.5).
4. Map composite score to action thresholds: 4.5–5: Scale — produce more topic-cluster content. 3–4.4: Optimize — update on-page SEO and internal links. * <3: Consolidate — merge with stronger pages or remove.
Practical example table
Sample dataset used in the worked example (pages, metrics, computed score, recommended action)
| Page | Organic Sessions | CTR | Composite Score | Recommended Action |
|---|---|---|---|---|
| /blog/seo-basics | 9,200 | 4.8% | 4.5 | Scale |
| /guide/benchmarking | 6,500 | 6.1% | 4.0 | Optimize |
| /product-features | 3,100 | 2.9% | 2.0 | Consolidate |
| /category/seo-tools | 4,800 | 5.4% | 3.5 | Optimize |
| /support/faq | 1,200 | 3.3% | 1.5 | Consolidate |
Key insight: The highest sessions page also performs well on CTR and is the best candidate for scaling into a topic cluster. Mid-tier pages benefit most from targeted on-page updates and internal linking improvements, while low-scoring pages should be evaluated for consolidation to reduce content bloat.
This worked example shows how scoring rules convert noisy metrics into clear actions quickly. Applying this regularly lets teams prioritize high-impact work without overanalyzing every page. Understanding these principles helps teams move faster without sacrificing quality.
Conclusion
By tying baseline measurements to the metrics that actually move business outcomes—engagement depth, conversion rates, and channel-level attribution—you turn fuzzy performance debates into prioritized workstreams. The article’s walkthrough of selecting SEO metrics, building a benchmark, and the worked example that re-prioritized a content slate demonstrates a repeatable pattern: measure what maps to revenue, automate the repetitive comparisons, and re-benchmark on a predictable cadence. Build a single source of truth for content performance, start with a quarterly re-benchmark, and prioritize pages with the largest gap between traffic and conversion.
If questions linger about cadence or which KPIs to trust, start small: choose one engagement metric and one conversion metric, test the benchmark for one quarter, then expand. If automation is a roadblock, teams that automate benchmarking free up bandwidth to act on insights rather than assemble them. For teams looking to streamline that process, Explore Scaleblogger’s automation for content benchmarking: Explore Scaleblogger’s automation for content benchmarking. That tool is one practical next step among options — combine it with the step-by-step approach above to move from vague metrics to measurable impact this quarter.
