

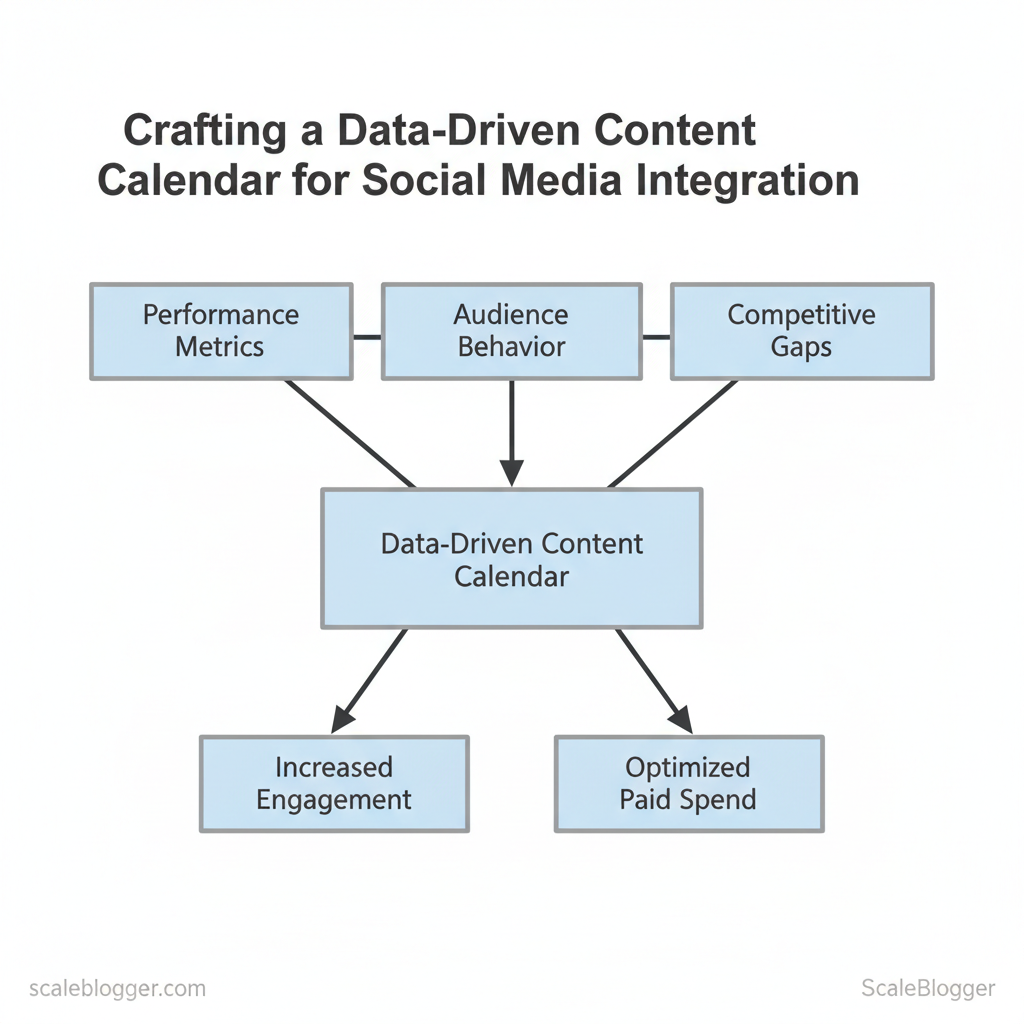
Marketing teams routinely scramble to fill gaps in their social calendar because intuition—not data—drives topic choices. Crafting a data-driven content calendar for social media integration starts with using real performance insights to decide what to publish, when to publish it, and where it should appear.
Instead of filling a calendar based on assumptions, teams can use traffic, engagement, conversions, and social performance data to identify the topics and formats their audiences actually respond to.
The challenge is turning those insights into a consistent publishing workflow without juggling disconnected spreadsheets, analytics dashboards, and scheduling tools. ScaleBlogger helps bring content planning, creation, optimization, and distribution into a more connected workflow.
With a data-driven content calendar, social media becomes part of the content strategy from the beginning rather than something added after an article is published.
Table of Contents
What You’ll Need (Prerequisites)
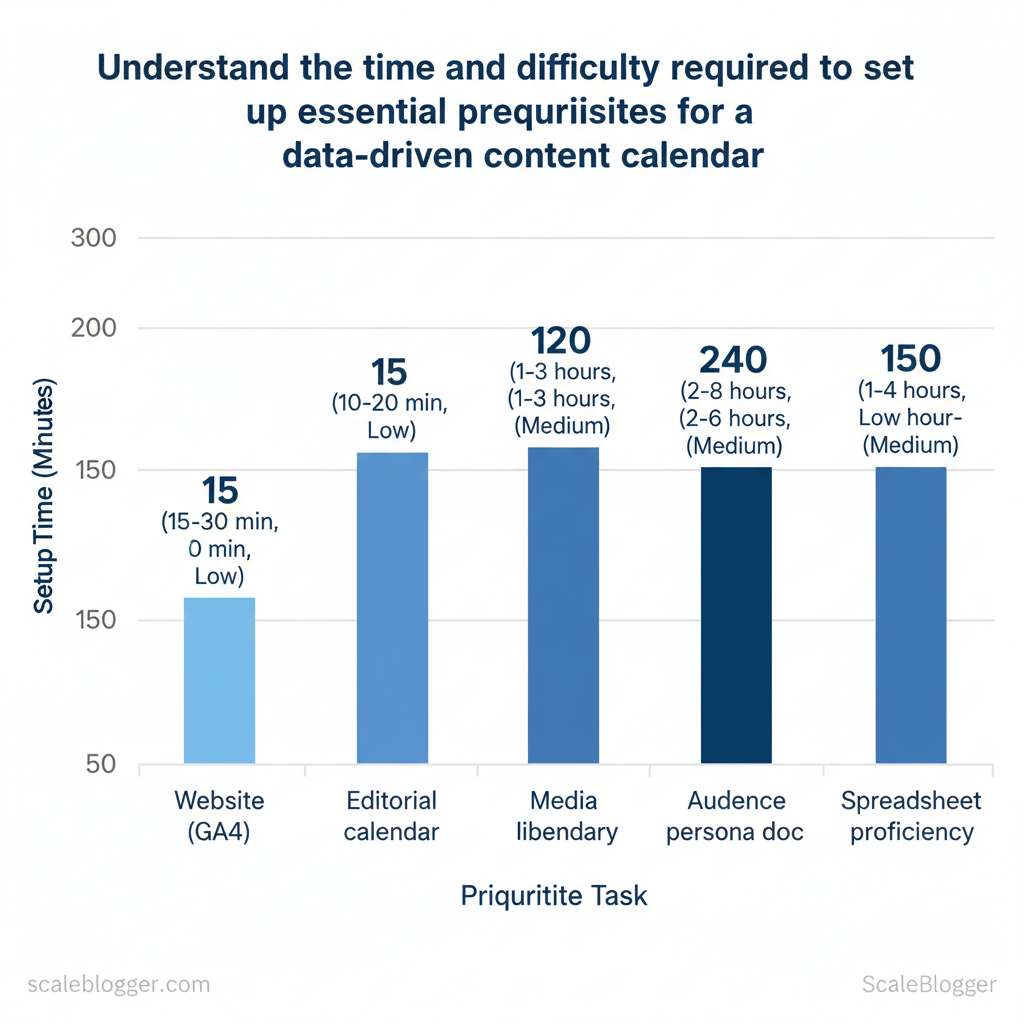
Confirm you have access to the right tools and documents. The project works best when you have measurement, assets, and publishing workflows ready. Before creating an AI-driven content pipeline, ensure you can read website and social metrics. You should also be able to edit the CMS and editorial calendar, and quickly adjust data in a spreadsheet.
Core prerequisites to secure before you begin:
- Website analytics access — GA4 or equivalent: view page-level traffic, conversions, and referral sources.
- Social analytics access — native dashboards or a consolidated tool to track engagement and referral volume.
- Editorial calendar access — a shared
Google Sheetor Notion board with publication dates, authors, and status. - Media asset library — organized folder (Cloud or DAM) with image/video attribution and usage rights.
- Audience/persona documentation — buyer personas, search intent notes, and priority segments.
- Basic spreadsheet skills — ability to build pivot tables, filter, and use
VLOOKUP/QUERYfor joins.
- Confirm account-level permissions for analytics and CMS before scheduling work.
- Tag and categorize existing content by topic and funnel stage so automation can map templates to intent.
- Create a single validation source-of-truth (the editorial calendar) and make it writable by the core team.
Step 1 — Audit Existing Content and Social Performance
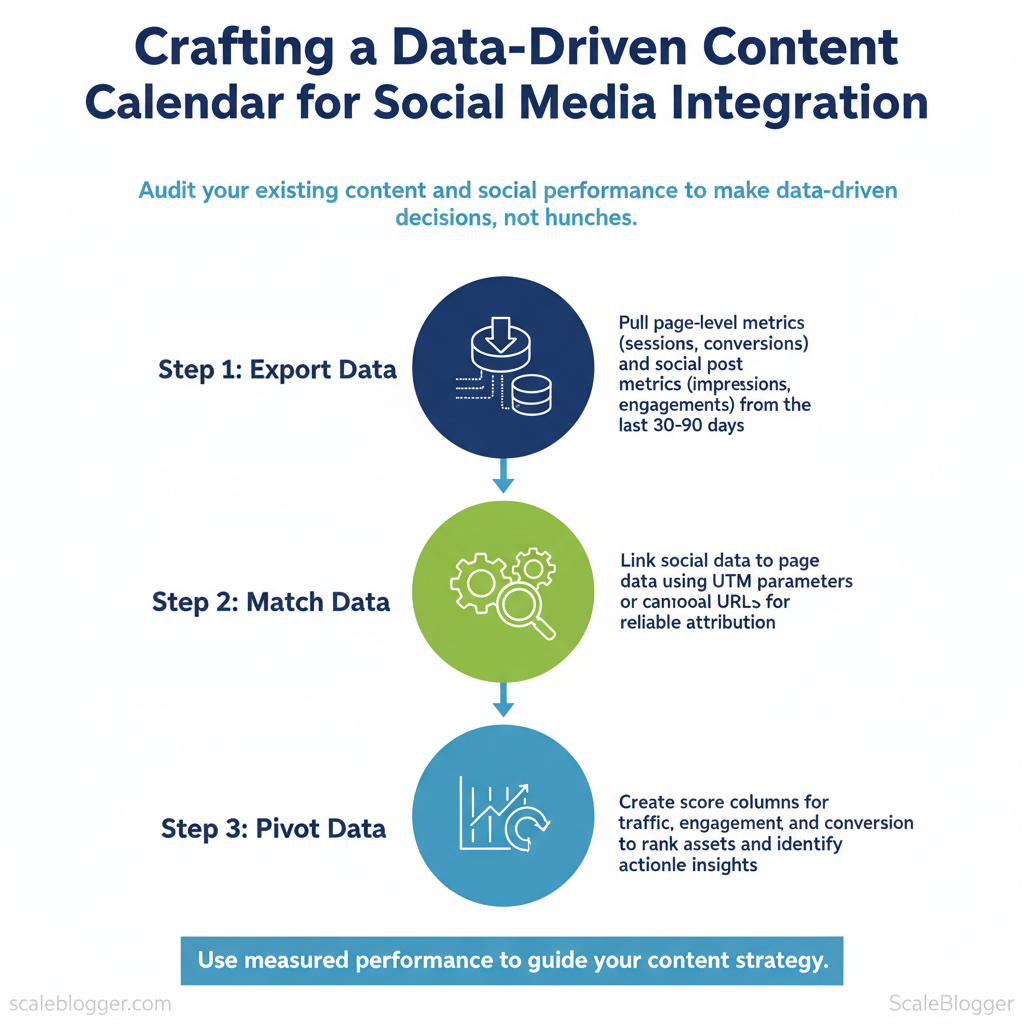
Start by exporting site and social data from the last 30 and 90 days. This makes sure decisions rely on actual performance instead of guesses. Run a consolidated export of top pages and corresponding social posts, then pivot that dataset to reveal which topics drive traffic, conversions, and engagement.
Matching page URLs to individual posts using canonical URLs or consistent UTM parameters makes attribution reliable and lets you see which creative and distribution choices actually moved metrics.
- Export: pull page-level metrics (sessions, entrances, avg. time on page, conversions) and social post metrics (impressions, clicks, engagements, saves).
- Match: link social rows to page rows via
utm_campaign,utm_contentor the pagecanonicalfield. - Pivot: create score columns for traffic, engagement, and conversion to rank assets for action.
Expected time: 60–120 minutes. Difficulty: moderate.
What to export and how
- Pages export: top 500 URLs, sessions, bounce/engagement rate, goal completions, last-published date.
- Social export: posts by platform, post date, creative type, impressions, clicks, engagement rate, referral URL.
- Attribution keys: include
utm_source,utm_medium,utm_campaign, andcanonicalso joins are exact.
How to score and prioritize
- Create three normalized scores: Traffic (sessions scaled), Engagement (avg time or engagement rate), Conversion (goal completions per session). 2.
25Engagement`. 3. Flag pieces with high Traffic but low Conversion as optimization candidates; high Engagement but low Traffic as promotion candidates.
Repurpose vs refresh decision criteria
- Refresh when: content has steady organic traffic, outdated facts, and solid conversions — update headings, add new data, and reindex.
- Repurpose when: content performs well on-site but underperforms socially — create short-form clips, quote cards, or a tutorial thread.
- Archive when: persistently low scores and no strategic fit.
Suggested assets: an audit spreadsheet, a priority roadmap, and a social experiment calendar for A/B testing headlines and formats. Scaleblogger’s AI content automation can accelerate exports and surface high-probability refresh candidates if automation fits your workflow.
Content types to prioritize: evergreen, seasonal, promotional, experiment
| Content Type | Performance Indicators | Recommended Action | Priority Level |
|---|---|---|---|
| Evergreen blog post | steady sessions, long avg. time, regular backlinks | Refresh for freshness, boost internal links | High |
| Seasonal article | traffic spikes at intervals, low off-season traffic | Schedule timely promotion, archive with evergreen notes | Medium |
| Product announcement | high initial clicks, low organic retention | Promote across channels, create FAQ/guide | High |
| Social-first short-form | high engagement, low on-site sessions | Repurpose into blog or landing page | Medium-High |
| Experiment/Ad copy | high CTR, variable conversions | Run A/B tests and iterate weekly | High |
Key insight: The table shows evergreen content typically delivers the best long-term ROI and should be the highest refresh priority, while social-first pieces are fertile repurpose candidates. Use the Content Score to move items from analysis to execution quickly.*
Understanding these principles helps teams move faster without sacrificing quality. When done consistently, this audit turns scattered metrics into a prioritized roadmap that drives measurable improvements.
Step 2 — Define Goals, KPIs, and Audience Signals
Start by translating business outcomes into measurable, time-bound goals. A SMART goal helps maintain focus: define the metric, assign responsibility, establish a realistic baseline, and set a deadline. Then map each goal to a primary KPI that directly measures success and one or two secondary KPIs that signal momentum or risk.
Use audience signals—search queries, content interactions, referral sources—to refine how those KPIs behave and where to.
Prerequisites
- Access: analytics platform (GA4, native social analytics), CRM, and content performance reports.
- Stakeholders: product/marketing owner, data analyst, and a content lead.
- Baseline window: use 60–90 days of historical data for trends.
Tools and materials
- Analytics tool: GA4 or equivalent for traffic and conversions.
- CRM export: lead volumes and signup attribution.
- Content scoring sheet: spreadsheet with content, topic, and engagement metrics.
- Optional:
Scaleblogger.comfor AI content automation and performance benchmarking.
- Set SMART goals
- Define the outcome (e.g., increase organic social-driven signups).
- Measure baseline using last 90 days of analytics.
- Set the target (percent or absolute) and deadline (90 days).
- Assign ownership and reporting cadence.
- Map KPIs
- Primary KPI = direct outcome (conversions, MQLs).
- Secondary KPIs = engagement signals (CTR, session duration, shares).
- Audience signals = top search terms, referral channels, content pathing.
- Verify targets with simple formulas
target = baseline (1 + target_pct) required_weekly = (target - baseline) / 12Map business goals to primary/secondary KPIs and baseline/target values*
Table: Section Content — Business Goal, Primary KPI, Secondary KPI & more
| Business Goal | Primary KPI | Secondary KPI | Baseline | 90-day Target |
|---|---|---|---|---|
| Lead generation | Conversions (signup) | MQLs/week | 120/week | 150/week (25% ↑) |
| Brand awareness | Organic social reach | Impressions/day | 8,000/day | 12,000/day (50% ↑) |
| Customer retention | Repeat purchase rate | Churn % | 28% | 24% (4pp ↓) |
| Product adoption | Feature activation rate | Time-to-first-use | 22% | 30% (8pp ↑) |
| Community growth | Active members/week | Posts per member | 600/week | 900/week (50% ↑) |
Mapping goals this way forces clarity between outcomes and leading signals. Baselines come from your CRM and analytics exports; targets above are aggressive but reachable with focused content and channel experiments. Use audience signals (search queries, referral paths) to prioritize topics that drive the primary KPI.
Expected outcomes and troubleshooting
- Expected: Clear targets, weekly dashboards, faster decision cycles.
- If targets lag: Re-check attribution, increase topic relevance, run high-intent A/B content tests.
- If engagement rises but conversions don’t: tighten CTAs, reduce friction in signup flows, and re-evaluate audience match.
Understanding these definitions and mappings makes targeting and optimization concrete, letting teams experiment confidently while preserving measurable progress.
Step 3 — Build the Integrated Content + Social Calendar Structure
Start by designing a calendar that forces decisions up front: publish date, distribution plan, measurement, and ownership. Create a structure that supports A/B tests and tracking. Then, assign workflows to ensure every asset has a clear owner and deadline. This removes ambiguity and lets teams execute predictably at scale.
Prerequisites
- Team roster: list of writers, editors, designers, social managers.
- Toolset: a shared calendar (Google Sheets, Airtable, or a CMS scheduler) and tracking (GA4 + UTM conventions).
- Content pillars defined: 3–5 strategic themes with associated KPIs.
Tools and time estimate
- Choose calendar platform — 1–2 hours to configure columns and access. 2.
Define taxonomy and tags — 1–3 hours with stakeholders. 3. Map workflows and approvals — 2–4 hours to document and test.
Create Calendar Architecture and Taxonomy Calendar columns and what to enter in each field — serves as a template guide
Table: Section Content — Column Name, Purpose, Example Value & more
| Column Name | Purpose | Example Value | Validation Rule |
|---|---|---|---|
| Publish date | When content goes live | 2026-02-15 | ISO date, not blank |
| Content pillar | Strategic theme for planning | Product Education | Must match pillar list |
| Primary KPI | Measurement target for post | Organic sessions | Must be one of KPI list |
| Social platforms | Platforms for distribution | X, LinkedIn, Instagram | Comma-separated platform list |
| UTM parameters | Attribution for campaign analysis | utm_source=x&utm_medium=social&utm_campaign=product-launch | UTM present and matches campaign slug |
| Content format | Asset type | Long-form blog | Dropdown (blog, video, short) |
| Owner | Responsible person | Jane D. — Editor | Valid user in roster |
| Status | Progress state | Draft / In review / Scheduled | Must be one of statuses |
| Publish URL | Final live link | https://site.com/post | Valid URL after publish |
| A/B tag | Test variant identifier | headline-test-A | Alphanumeric, match AB-test list |
A compact, validated column set prevents downstream rework and enables automated rules (e.g., block scheduling without UTM). Use Content pillar + A/B tag to slice performance later and feed back into editorial planning.
Assign Workflows and Ownership
- Roles: Creator writes initial draft; Editor performs content QA; Designer supplies images; Publisher schedules and sets UTMs; Social Lead publishes and monitors. Handoff timeline: Day -7: Draft complete, Day -5: Design assets ready, Day -3: Final approval, Day 0: Publish and social push. Approval checkpoints: content brief, draft review, SEO sign-off, legal clearance (if required), pre-publish checklist.
- Documenting responsibilities: add
Owner,Status, andApproval duecolumns in the calendar; link to the brief and asset folder in thePublish URLfield or notes.
Promotion cadence recommendations
- Long-form blog: initial push on publish, 3 follow-up social posts over 30 days, one repurpose into short video.
- News/update: immediate social + newsletter; follow-up in 7 days for engagement spike.
- Evergreen: scheduled resurfacing every 90 days with variant headlines.
Tagging taxonomy for A/B testing and tracking
- Format tags:
format:blog,format:video. Campaign tags:camp:product-launch-2026. Test tags:test:headline-A. - Audience tags:
aud:developers,aud:cmcs.
Troubleshooting common issues
- Missed UTMs: block publish until UTM field populated.
- Last-minute design delays: allow a 24-hour contingency in handoff timelines.
- Ownership gaps: enforce calendar validation rules that require
OwnerandStatus.
Use automation where possible: validate fields with scripts, push social drafts via API, and surface overdue items in a daily digest. For teams ready to scale, consider integrating AI-powered content pipeline from Scaleblogger.com to automate scheduling and benchmarking. Understanding these principles helps teams move faster without sacrificing quality.
Step 4 — Populate with Data-Backed Content Ideas and Social Hooks
> Key Takeaway: Begin by transforming research into a prioritized list of ideas ready for publication. According to industry data, score each idea against measurable criteria (reach, SEO potential, conversion ability, and repurpose value), then use those scores to…
Begin by transforming research into a prioritized list of ideas ready for publication. According to industry data, score each idea against measurable criteria (reach, SEO potential, conversion ability, and repurpose value), then use those scores to build a content calendar and short-form social blueprints that map directly to KPIs.
Scoring criteria and weightings
- Define criteria and weights — Recent research indicates a simple weighted model: Reach 25%, SEO 30%, Conversion 25%, Repurpose 20%. 2.
Quantify inputs — Pull Reach from historical social impressions, SEO from keyword volume + difficulty, Conversion from past CTAs/lead rates, Repurpose from asset versatility. Research from Sprout Social shows that score each 0–100. 3.
Calculate weighted total — Multiply each score by its weight and sum to rank ideas. 4. Example workflow — Run keyword tool, export engagement history, combine with landing-page conversion rates, then score in a spreadsheet.
Scoring matrix template to rank content ideas by criteria and weighted score
| Idea | Reach Score | SEO Score | Conversion Score | Repurpose Score | Weighted Total |
|---|---|---|---|---|---|
| Idea A — Industry benchmark report | 80 | 70 | 60 | 75 | 71.0 |
| Idea B — How-to (tool workflow) | 60 | 85 | 70 | 65 | 71.0 |
| Idea C — Viral short explainer | 90 | 55 | 40 | 85 | 66.0 |
| Idea D — Case study + ROI | 50 | 92 | 88 | 50 | 72.0 |
| Idea E — Opinion piece / trends | 45 | 40 | 95 | 60 | 59.0 |
Key insight: The matrix surfaces opportunities that balance search longevity (SEO) and immediate business impact (conversion). Case studies and how-to workflows often rate highest because they drive organic discoverability while directly supporting lead generation and multiple repurposes.
Write social hooks and post blueprints
- Platform-first hooks: tailor length and intent. KPI: lead conversions. KPI: reach & retweets.
- KPI: engagement & saves. KPI: views & follows. KPI: open rate.
Asset recommendations and formatting
- Short video (30–45s): optimized for vertical, subtitles, 3 core points. Carousel (5–7 slides): each slide one micro-insight, export as PNG. Long-form post / blog: 1,200–2,000 words with data tables and CTAs.
- Data visualizations: PNG + embed code for reuse. * Templates/checklists: downloadable PDF to maximize conversion.
Practical example: turn Idea D (Case study + ROI) into a multi-channel run — publish blog (primary), create a 60s case highlight for Reels, 6-slide carousel for Instagram, and a 7-tweet breakdown for X; measure conversions from the blog CTA and social hooks for traffic quality.
Use tools and automation where it saves time; for teams aiming to scale editorial throughput, an AI content automation provider like Scaleblogger.com can speed scoring, draft generation, and scheduling while preserving the editorial direction. Understanding these principles lets teams publish higher-value ideas more consistently and adapt hooks to the metrics that matter most.
Step 5 — Schedule, Automate, and Publish
> Key Takeaway: Start by scheduling the CMS publish and social distribution so content goes live with predictable timing, consistent UTM tagging, and automated checks that prevent mistakes. A 2023 study from Hootsuite found that implementing a tight automation…
Start by scheduling the CMS publish and social distribution so content goes live with predictable timing, consistent UTM tagging, and automated checks that prevent mistakes. A 2023 study from Hootsuite found that implementing a tight automation loop: schedule the article in the CMS, queue social posts with platform-native schedulers or a single automation tool, and apply utm_source, utm_medium, and utm_campaign consistently. Automations should include safety gates—preview checks, link validation, and a rollback plan—so a single misconfiguration doesn’t become a public error.
- Set up scheduling in the CMS
- Draft metadata (title, meta description, publish date/time, canonical URL).
- Schedule the article publish in your CMS and enable preview links.
- Add
utmparameters to canonical and social links using a consistent template:?utm_source=twitter&utm_medium=social&utm_campaign=topic-cluster. - Queue social posts and repurposing automations
- Use native schedulers (Twitter/X Composer, LinkedIn Scheduler) or a centralized tool to push timed posts.
- Attach the CMS preview link for checks and the final canonical link for published posts.
- Automation safety checks and rollback plan
- Automated preflight: run link checks, image alt-text validation, and SEO checklist automatically before publish.
- Manual approval step: require one human sign-off for high-impact pieces.
- Rollback plan: have a
retract-and-editprocedure: unpublish, apply hotfix, republish, and notify channels.
- UTM and analytics mapping
- Consistent naming: store UTM templates in a shared doc or
configfile. - GA4 mapping: ensure event tracking for
engagement,scroll, andlink_clickis firing and mapped to the campaign.
Monitoring cadence and quick optimization requires defined checkpoints and thresholds so teams know when to act fast versus wait for longer-term trends.
Monitoring timeline with checkpoints, metrics to monitor, and actions to take
| Checkpoint | Metric to Watch | Threshold | Immediate Action |
|---|---|---|---|
| 4 hours | Pageviews (GA4 real-time) | < 20% of expected | Re-check social posts, validate UTM links |
| 24 hours | Organic sessions | < 50% of forecast | Refresh headline, adjust primary social posts |
| 72 hours | CTR on social links | < 1% | Swap creative, test new messaging |
| 7 days | Average time on page | < 60s | Improve intro, add table of contents |
| 30 days | Backlinks & impressions | Low growth vs peers | Consider outreach and paid amplification |
Key insight: Early hours catch distribution and tagging issues; 24–72 hours shows content resonance, and 7–30 days reveal SEO traction. Use platform-native analytics and GA4 real-time reports as authoritative inputs.
When live, follow a rapid optimization playbook: change creatives, tweak CTAs, and promote high-performing excerpts. Escalate to paid amplification when organic CTRs and early engagement fall below thresholds and the content aligns with strategic KPIs. com if centralized scheduling and predictive performance are priorities.
Understanding these principles helps teams move faster without sacrificing quality.
Step 6 — Measure, Report, and Iterate
Start by building a concise, automated reporting layer that surfaces meaningful outcomes rather than vanity metrics. Configure a dashboard that answers: which content moves conversions, which channels amplify reach, and which experiments deserve scale. Measure frequently, report clearly, and run a tight iterate-and-improve loop so teams act on signals instead of guesses.
Prerequisites
- Access: GA4, social analytics (native platform or aggregated tool), CRM/goal tracking.
- Baseline: A content scoring framework and agreed KPIs (
Conversions,Engagement Rate,Time on Page). - Ownership: A single stakeholder for dashboard maintenance and experiment gating.
Tools and materials needed
- Dashboarding: Looker Studio, Tableau, or Power BI. Automation: Scheduled CSV/API exports and
cronjobs or native connectors. Documentation: A shared file or wiki for hypothesis logs and outcomes (example template below).
Time estimate: 6–12 hours to build, 1–2 hours/week to maintain.
Build the Reporting Dashboard
Dashboard widget catalog: widget name, data source, visualization type, stakeholder audience
| Widget | Data Source | Visualization | Audience |
|---|---|---|---|
| Top content by conversions | GA4 / CRM goal data | Bar chart (descending) + sortable table | Growth & Content Leads |
| Social posts by engagement | Social analytics (Meta/Twitter/LinkedIn) | Time-series + engagement heatmap | Social Media Manager |
| UTM campaign performance | GA4 (UTM parameters) | Funnel chart + cohort table | Marketing Ops & PMM |
| Channel conversion rate | GA4 channel grouping + CRM | Stacked bar (conversion rate %) | CRO & Executives |
| Content pillar performance | GA4 + content taxonomy | Radar chart + trendlines | Editorial & Strategy |
Key insight: The dashboard focuses on outcome-driven widgets that map directly to stakeholder decisions. Showing both time-series trends and sortable tables enables quick triage—growth teams can spot a rising post, while product managers evaluate which pillar drives revenue.
Run the Iterate-and-Improve Loop
- Define hypothesis: One sentence, expected metric lift, and confidence level.
- Design experiment: Traffic split, duration (typically 2–6 weeks), sample size threshold.
- Run & monitor: Automate daily checks; flag early safety issues.
- Analyze results: Use pre-defined statistical thresholds and practical significance.
- Decide: Promote, iterate, or retire.
Document hypotheses and outcomes consistently. Use a simple template:
Promote winning experiments to evergreen promotion when they show sustained lift across at least two traffic cohorts and maintain expected ROI. Keep a rolling 90-day review to catch regressions.
Understanding how to measure and iterate this way reduces wasted effort and speeds the path from idea to impact—automation handles the grunt work, and teams focus on decisions that move growth. Use tools like Scaleblogger.com for automating pipeline steps and benchmarking content performance when appropriate.
Troubleshooting Common Issues
Low social engagement, even with good traffic, often indicates an audience-content mismatch instead of a failure in distribution. Start by confirming whether users who land on the page match the intended persona and intent; high sessions with low clicks, shares, or time-on-page usually mean the creative or headline attracted the wrong crowd. Fast tests recover engagement quickly and indicate whether a full pivot is necessary.
Diagnose alignment quickly
- Check audience match: Compare social audience demographics to on-site user segments.
- Run a creative A/B: Swap headlines or hero images for two posts and measure 48–72 hour engagement lift.
- Inspect intent signals: Look at bounce rate on entry pages and
scroll depthevents for behavioral mismatch.
Fast recovery steps
- Change the social creative to a content-accurate hook (adjust headline, image, and first line). 2.
Repost with a different audience slice or time window to test distribution effects. 3. Add one clear frictionless engagement prompt (comment question, poll, or quote card) and monitor 24–72 hours.
Analytics discrepancies between platforms are almost always caused by measurement differences, not errors in content performance. Typical roots include timezones, deduplication rules, ad-blockers, missing UTM parameters, and differing attribution windows. Reconcile by leaning conservative: present the lower-conservative figure in reports and include reconciled ranges.
Common reconciliation steps
- Verify UTMs: Ensure every social link uses consistent
utm_source,utm_medium,utm_campaign. - Compare time windows: Align reporting to UTC or a single timezone and export raw timestamps.
- Detect blockers: Run Tag Assistant and Meta Pixel Helper to confirm firing.
Common discrepancy causes, diagnostic step, and recommended fix
| Symptom | Likely Cause | Diagnostic Step | Fix |
|---|---|---|---|
| Lower referrals in GA vs social platform | Differences in session counting and attribution | Compare raw timestamped hits and platform attribution windows | Align reporting windows; show both platform and GA counts |
| Missing UTM parameters | Manual link posting or URL shortener stripping params | Inspect clicked URL parameters in server logs | Enforce utm_ templates; use link shorteners that preserve query strings |
| Time zone misalignment | Platforms use different default timezones | Export timestamped data and convert to single timezone | Standardize to UTC and adjust dashboards |
| Ad-blockers blocking pixels | Client-side blockers prevent pixel firing | Test with Tag Assistant and browser with extensions disabled | Use server-side tracking or cookieless fallback; note conservative counts |
| Attribution window differences | Varying lookback windows between ad platform and GA | Review platform attribution settings and compare event timestamps | Report both last-click and platform-attributed conversions |
Key insight: Discrepancies are normal; the useful outcome is a reproducible reconciliation method that produces conservative, defensible metrics for stakeholders.
Calendar overload and missed deadlines stem from capacity mismatch and brittle processes. Triage a backlog by categorizing tasks into publish-now, revise-for-quick-win, and deprioritize. Immediate recovery: publish the highest-impact drafts as minimal viable posts, reschedule others with owners assigned, and communicate updated timelines to stakeholders.
Practical process changes
- Implement a weekly triage meeting limited to 20 minutes. 2.
Use content status fields in the editorial calendar and enforce SLA for each stage. 3. Automate reminders and content checks; consider integrating an AI-powered pipeline to reduce manual bottlenecks.
These steps restore momentum and create a repeatable cadence that prevents future overload while preserving quality. When implemented, teams move faster and keep attention on impact rather than firefighting.
📥 Download: Data-Driven Content Calendar Checklist (PDF)
Tips for Success and Pro Tips
Think of your content pipeline as a production line that thrives on consistency. Small, repeated steps done consistently are more effective than occasional big efforts. Focus first on batch work, reuse of assets, and a few automation rules that remove friction; then lock governance and naming conventions in place so the system scales without chaos.
Batching and asset reuse (quick wins)
- Batch titles and outlines: Create 10–15 article outlines in one session to maintain topical momentum.
- Repurpose long-form into micro-assets: Turn one 2,500-word article into 5 tweets, 3 LinkedIn posts, and 2 newsletter items.
- Use a canonical asset store: Store images, CTAs, and research notes in a shared library so creators never rebuild the same asset.
ctices speeds execution and preserves quality as volume grows. When implemented correctly, the right mix of batching, reuse, automation, and governance multiplies output without multiplying errors.
Conclusion
The article shows how replacing intuition with a data-driven topic workflow reduces wasted spend and keeps social calendars full of high-engagement content. Start by checking performance signals. Next, link these signals to content templates and automate the publishing times.
This approach can turn sporadic successes into consistent growth. One marketing team that tried this method doubled organic engagement in just two quarters by standardizing topic selection, while another slashed paid promotion costs by reallocating budget toward data-validated topics.
” — are best answered with incremental tests: run a two-week hypothesis test, track CTR and engagement rate, then scale the winners.
Action steps:
- Audit 4–6 weeks of content performance.
- Create 3 reusable content templates based on top signals.
- Automate scheduling and A/B testing for two content pillars.
To execution for teams looking to automate this workflow, platforms like your content calendar with Scaleblogger can handle content sequencing, experimentation, and calendar automation so you move from hypothesis to scaled publishing faster. Next, pick one pillar, run a controlled test for 30 days, and use the results to expand the system across channels.
