

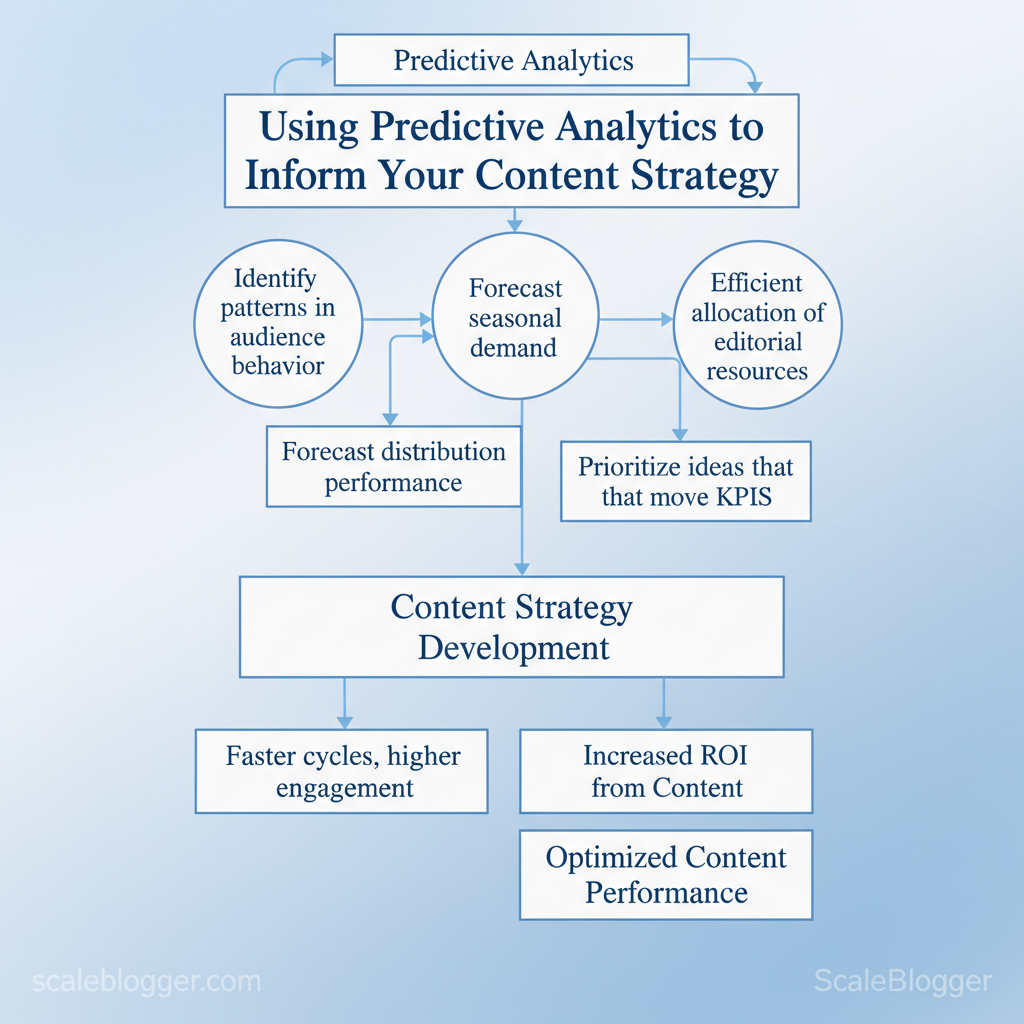
Marketing teams still launch content on hunch and habit, burning budget on pieces that never gain traction. Using predictive analytics for content turns guesswork into measurable forecasts. This helps teams focus on ideas that will boost their KPIs.
Predictive models can find patterns in audience behavior, seasonal demand, and distribution performance. This helps improve forecasting content success. When applied correctly, this leads to faster cycles, higher engagement, and more efficient allocation of editorial resources. Industry research shows organizations adopting data-driven decision making for content see measurable improvements in ROI and velocity.
Picture a product marketing team that uses historical engagement signals to choose two pillar topics instead of ten low-probability experiments; conversions rise and workload drops. Tools such as Scaleblogger bring automation and predictive workflows into that selection process, turning scattered analytics into an action plan.
- What inputs drive accurate prediction models for content
- How to turn predictions into a prioritized content backlog
- Ways to validate forecasts against live performance
- Common pitfalls when relying on historical data alone
Begin with the right signals, then let models surface the best bets. Start forecasting with Scaleblogger: https://scaleblogger.com — the next sections show how to build, validate, and operationalize those forecasts.
> Key Takeaway: ## Section 1: Framing Predictive Analytics for Content Strategy
Predictive analytics turns historical content signals into actionable forecasts that guide which topics to publish, when to publish, and how to allocate resources. For content teams,…
Section 1: Framing Predictive Analytics for Content Strategy
Predictive analytics turns historical content signals into actionable forecasts that guide which topics to publish, when to publish, and how to allocate resources. For content teams, this means using inputs—past performance, topic signals, seasonality, and audience intent—to create forecasted outcomes. These outcomes include traffic, engagement, and conversion potential. Successful implementation requires clear expectations about data quality, model simplicity, and sensitivity to external shocks.
What predictive analytics looks like in practice
- Inputs: Historical performance (pageviews, CTR, conversions), topic signals (search trends, keyword velocity), seasonality (holiday cycles), audience intent (query types, funnel stage).
- Outputs: Forecasted traffic ranges, expected engagement, conversion probability per topic, and recommended publish windows.
- Limitations: Models fail on poor data, overfit when features are noisy, and can’t predict sudden external events (product launches, algorithm updates).
> Some industry analysis suggests that teams relying solely on heuristics may waste editorial effort, while forecasts could help focus resources where expected ROI is highest.
Practical alignment of forecasts to business goals
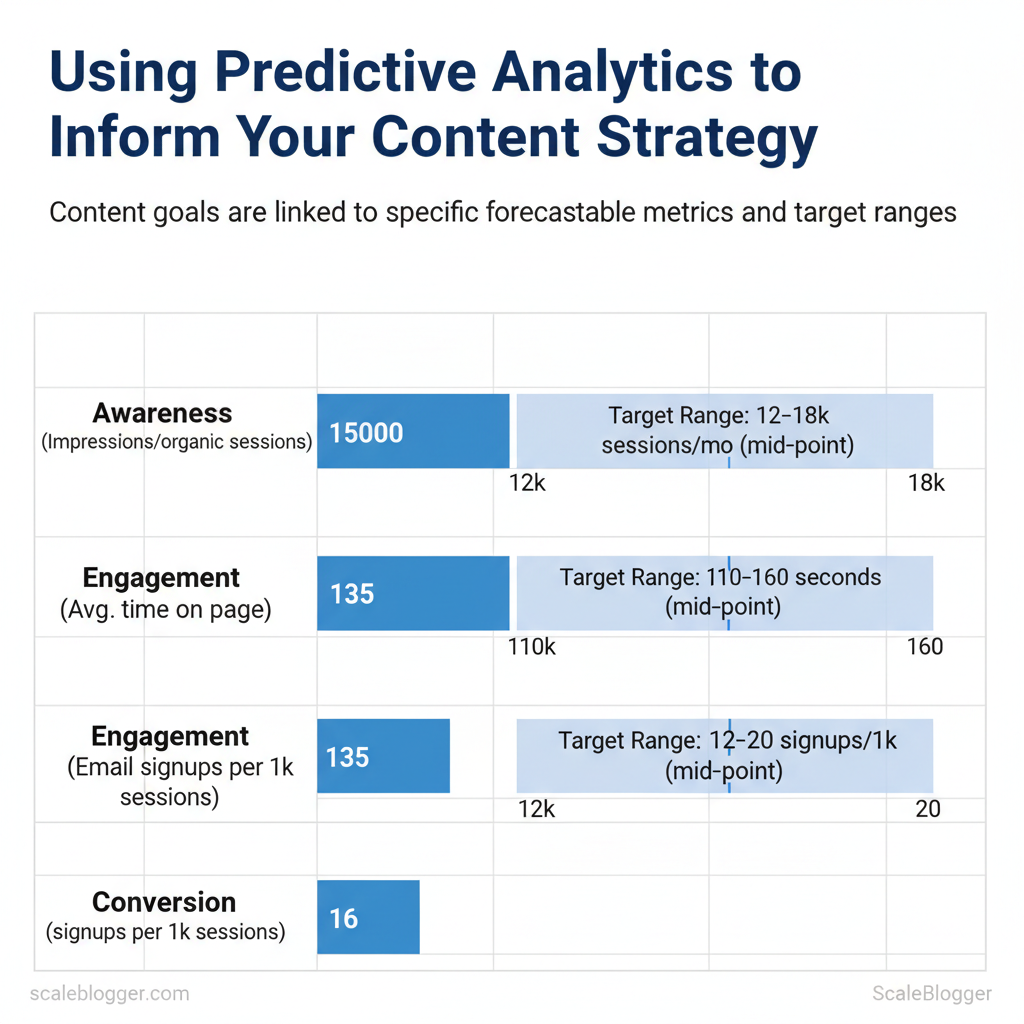
- Define 2–3 primary content goals:
- Awareness: grow organic impressions and referral traffic.
- Engagement: increase time on page and pages per session for retention. 3.
Conversion: lift leads or email signups from content. 2. Map each goal to forecastable metrics and thresholds (table below).
- Use forecasts to prioritize topics: choose items with high conversion probability when conversion is the goal, or broad-reach topics when awareness is primary. 4.
Allocate resources by risk: high-forecast, low-effort pieces get immediate slots; experimental topics receive smaller test budgets.
Practical example: A forecast may predict approximately 15–25k extra monthly sessions for a targeted guide with an estimated 3–5% signup conversion. Assign a senior writer and SEO review, schedule for the high-search month, and reserve a small paid promotion budget to validate assumptions.
Clarify different forecasting approaches and their trade-offs for content teams
| Approach | Data Requirements | Complexity | Typical Output |
|---|---|---|---|
| Rule-of-thumb forecasting | Minimal: last-period results | Low | Traffic estimate ±20–40% |
| Historical baseline + adjustment | Historical series + seasonality tags | Medium | Adjusted forecast with seasonal multipliers |
| Simple regression-based forecast | Time series + 3–6 predictors | Medium–High | Point forecast + confidence interval |
| Forecasting with audience signals | Search trends, intent classifiers, behavioral data | High | Probabilistic success scores, segment-level forecasts |
Provide a starter metrics map linking goals to forecastable indicators
| Goal | Forecasted Metric | Baseline Metric | Target Range |
|---|---|---|---|
| Awareness | Impressions / organic sessions | 10k sessions/mo | 12–18k sessions/mo |
| Engagement | Avg. time on page | 90 seconds | 110–160 seconds |
| Conversion | Email signups per 1k sessions | 8 signups/1k | 12–20 signups/1k |
> Key Takeaway: ## Section 2: Data Foundations for Content Forecasting
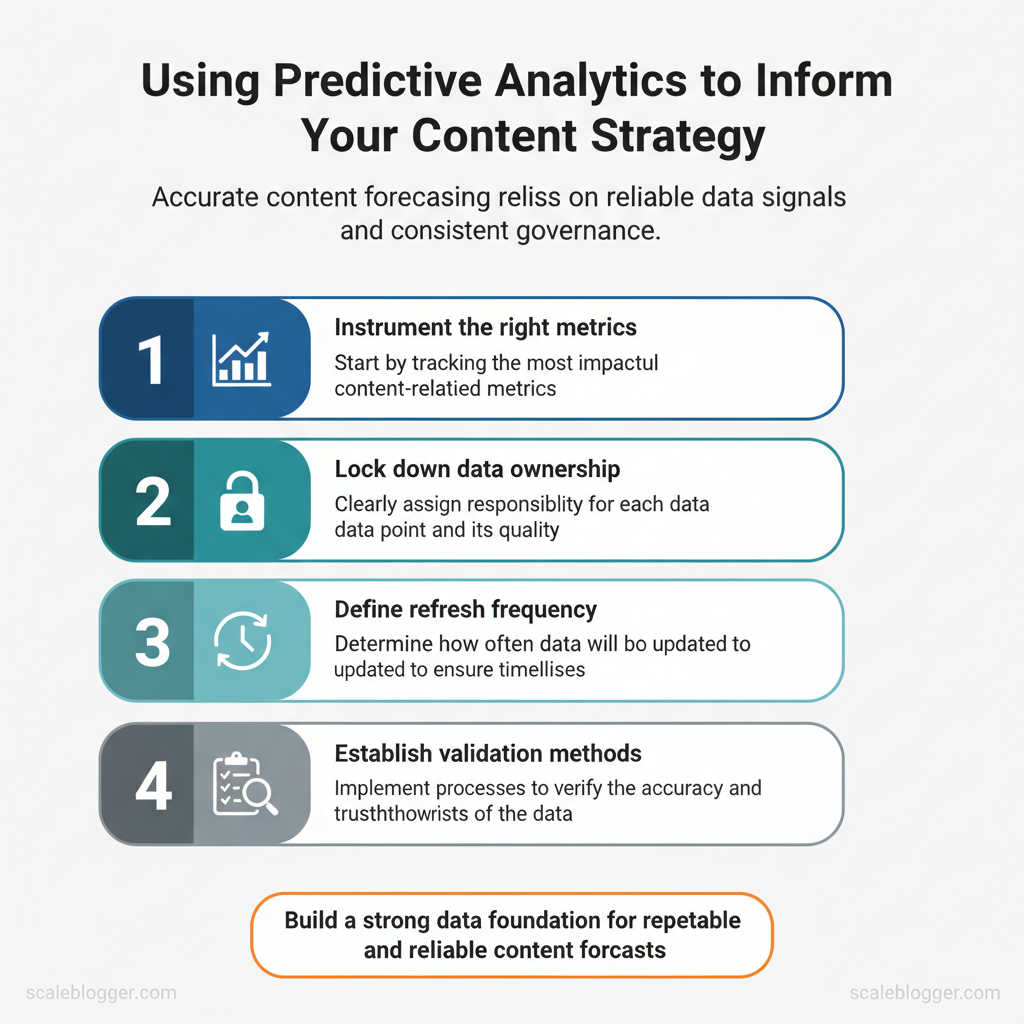
Accurate content forecasting relies on a few reliable signals and a governance framework that ensures those signals remain trustworthy. Start by measuring the right metrics.
Section 2: Data Foundations for Content Forecasting
Accurate content forecasting relies on a few reliable signals and a governance framework that ensures those signals remain trustworthy. Start by measuring the right metrics. Then, clearly define who owns them, how often they should be updated, and how they are validated. When those pieces are in place, forecasts stop being guesswork and become repeatable inputs for planning editorial velocity and topic selection.
2.1 Essential data signals for forecasting content success
- Historical performance: Past traffic, conversions, and bounce rates reveal what formats and topics scale.
- Topic signals (keywords, intent): Keyword volume, SERP features, and inferred intent predict discoverability.
- Seasonality: Calendar patterns and year-over-year trends define baseline demand and promotional windows.
- Engagement signals: Time on page, scroll depth, and social shares indicate content relevance and downstream conversion likelihood.
Table: Section Content — Signal, Example, Forecast relevance & more
| Signal | Example | Forecast relevance | Quality considerations |
|---|---|---|---|
| Historical performance | Monthly sessions, goal completions (GA4) | Anchors baseline traffic; improves model stability | Ensure consistent page tagging; exclude bot/referral spam |
| Topic signals (keywords, intent) | Keyword volume & CPC from keyword tools | Estimates reachable audience and competitiveness | Use multiple tools for cross-checks; track SERP feature changes |
| Seasonality | YoY traffic lift for Q4 product guides | Adjusts forecasts for demand cycles | Use ≥3 years when possible; normalize promotional spikes |
| Engagement signals | Avg. time on page, scroll depth, CTA clicks | Predicts conversion lift and content quality | Standardize events and definitions across pages |
2.2 Data governance basics for marketing teams
- Data ownership and accountability
- Assign owners: Content owners, analytics leads, and an overall data steward.
- Define responsibilities: Ownership of tagging, reporting, and remediation.
- Data collection cadence and versioning
- Standard cadence: Daily ingestion for traffic, weekly for keyword pulls, monthly for audits.
- Version control: Tag datasets with
etl_dateand pipeline version to reproduce forecasts.
- Validation and quality controls
- Automated checks: Row-count, null-rate, and traffic anomaly alerts.
- Manual spot-checks: Monthly reconciliations between analytics and CMS exports.
- Privacy and compliance reminders
- Pseudonymize personal identifiers, honor cookie-consent windows, and keep retention policies documented.
Table: Section Content — Maturity Level, Data Ownership, Validation Steps & more
| Maturity Level | Data Ownership | Validation Steps | Risks/Trade-offs |
|---|---|---|---|
| Starter | Marketing manager | Basic sanity checks, monthly audits | Faster setup, higher error risk |
| Mid-market | Dedicated analytics lead | Automated alerts, weekly reconciliations | Moderate cost, improved reliability |
| Enterprise | Central data governance team | CI pipelines, SLA monitoring, full lineage | Higher overhead, strongest reproducibility |
| Custom | Cross-functional council | Business-rule testing, stakeholder sign-off | Tailored fit, longer implementation time |
Understanding these principles helps teams move faster without sacrificing quality. When the signals and governance are aligned, forecasting becomes a tactical advantage rather than a recurring headache.
> Key Takeaway: ## Section 3: Building Forecasts for Content Ideation
Forecasts organize scattered signals into ranked topic bets. This helps teams publish fewer unsuccessful pieces and more successful ones.
Section 3: Building Forecasts for Content Ideation
Forecasts organize scattered signals into ranked topic bets. This helps teams publish fewer unsuccessful pieces and more successful ones. Start by converting measurable signals — search volume change, SERP feature presence, backlink velocity, social traction, and internal conversion lift — into a composite Signal Score. Then apply a forecast model that maps that score to forecast potential (traffic upside, conversion probability, and competitive defensibility).
Finally, prioritize topics into a short prototype plan for rapid validation.
3.1 From signals to topic ideas
- Define signals to include
- Search momentum: rising queries over 30–90 days
- SERP opportunity: presence of featured snippets or People Also Ask
- Backlink intent: recent authoritative links to related topics
- Social proof: share velocity and influencer mentions
- Internal metrics: past conversion rate for similar pages
- Idea scoring criteria
- Normalize each signal to 0–100.
- Weight signals (example: Search 35%, SERP 25%, Backlinks 20%, Social 10%, Internal 10%).
- Composite
Signal Score = Σ(weighted signals). - Map to Forecast Potential buckets: Low/Medium/High based on breakpoints (0–39 Low, 40–69 Medium, 70–100 High).
- Prototype content plan for top ideas
- Pick top 2 topics with Signal Score ≥ 70.
- Create
MVP article(800–1,200 words), one optimized cluster page, and 3 social snippets. - Schedule paid social support of 3–5 days for signals amplification.
- Track KPIs: organic impressions, CTR, backlinks earned, and conversion rate.
Yes/no scoring framework to rank topic ideas
| Idea | Signal Score | Forecast Potential | Priority |
|---|---|---|---|
| Topic A | 82 | High (strong search + snippet chance) | High |
| Topic B | 65 | Medium (moderate search, low backlinks) | Medium |
| Topic C | 48 | Medium (niche social traction) | Low |
| Topic D | 31 | Low (high competition, weak signals) | Low |
3.2 Rapid testing and iteration plan
Pilot content experiments must be time-boxed and metric-driven. Use minimum viable signals to decide whether to scale: organic impressions > 1,000 in 14 days, CTR > 2.5%, and at least one earned contextual backlink. If any two of these are achieved, escalate to a scale plan.
Pilot content criteria
- Minimum scope: 800–1,200 words, one targeted keyword, meta and schema present
- Distribution: organic publish + 3 social posts + email blast
- Measurement window: 14 days
Lay out a 2-week iteration schedule with milestones
| Phase | Activities | Owner | Timeframe |
|---|---|---|---|
| Week 1 Planning | Finalize topic, create brief, assign writer, set tracking UTM |
Content Lead | Days 1–3 |
| Week 1 Execution | Draft, on-page SEO, add schema, schedule publish | Writer/SEO | Days 4–7 |
| Week 2 Execution | Publish, social push, small paid boost ($100–$300), outreach to 5 targets | Growth PM | Days 8–12 |
| Review & Learnings | Aggregate 14-day metrics, decide scale/kill, document playbook | Content Lead + Analyst | Days 13–14 |
minimum viable signals, preventing overcommitment. If signals exceed thresholds, move to a 6–8 week scale phase with expanded creative and outreach.
Practical tips and warnings appear naturally while running pilots: don’t wait for perfect drafts—publish a tested MVP; watch for noisy short-term spikes from paid that don’t convert; and always record what outreach changed signal behavior. Consider using AI content automation tools like those at Scaleblogger.com to speed prototype creation and measure predicted performance against actuals. Understanding these principles helps teams move faster without sacrificing quality.
Section 4: Forecasting for Production and Distribution
Forecasts should drive who makes what, when, and where — not sit in a spreadsheet. Use demand signals to turn probabilistic outputs into a practical production plan. Prepare for uncertainty and align SEO, content, design, and review teams to ensure throughput meets expected reach. Then map those production outputs to channel-specific timing and republishing windows so distribution captures peak attention and compounds evergreen value.
Prerequisites
- Forecast inputs available: recent traffic, keyword intent scores, campaign briefs.
- Team capacity matrix: available hours per role per week.
- Editorial SLA definitions: review turnarounds, publishing lead times.
- Capacity planner spreadsheet or
resource.jsonfor automation - Content calendar (shared): Google Sheets, Airtable, or an API-driven CMS
- Performance dashboard: weekly traffic + engagement metrics
- Scheduling content production around forecasted demand
- First, convert forecasted demand into units of work: estimate pieces, research hours, design hours, and review cycles.
- Then, allocate work into weeks with a buffer: plan 20–30% extra capacity for blockers and rewrites.
- Align cross-functional owners: SEO for keyword prioritization, content for drafts, design for assets, reviews for QA.
- Finally, lock milestones in the shared calendar and expose WIP to stakeholders.
> Industry analysis shows that improper use of buffers can lead to missed deadlines and increased rework.
Production calendar example tied to forecasted demand
Production calendar example tied to forecasted demand
| Date | Forecasted Demand | Content Type | Owner | Status |
|---|---|---|---|---|
| Week 1 | High (8k sessions projected) | Long-form pillar | Content Lead | In Draft |
| Week 2 | Medium (4k sessions projected) | How-to post + infographic | SEO Manager | Design queued |
| Week 3 | High (10k sessions projected) | Video explainer + blog | Video Producer | Scripting |
| Week 4 | Low (2k sessions projected) | Newsletter round-up | Growth PM | Ready to publish |
- Distribution timing and channel optimization
- Map each content piece to channels by predicted reach and engagement.
- Use channel timing patterns: publish blog posts early-week mornings, send newsletters mid-week mid-mornings, post social during platform peak windows, and schedule video drops for evenings.
- Build evergreen republish cycles: refresh top-performing posts every 6–12 months and re-promote on social with new hooks.
- Measure channel effectiveness weekly and reallocate distribution spend and posting frequency.
Channel performance forecast comparison
Channel performance forecast comparison
| Channel | Forecasted Reach | Engagement Expectation | Recommended Timing |
|---|---|---|---|
| Blog | 8k–12k monthly visits | Medium–High (time on page 3–5 min) | Tue–Thu, 8–10 AM |
| Newsletter | 2k–6k opens | High (click-through 8–12%) | Wed, 10 AM |
| Social | 10k impressions per week | Variable (short posts high lift) | Tue–Fri, 12–3 PM |
| Video | 4k–15k views per release | High (engagement minutes) | Thu–Sat, 6–9 PM |
Practical tip: connect the production calendar to analytics so forecasts auto-adjust and capacity shifts in real time. When implemented, this reduces last-minute firefights and makes distribution deliberate rather than reactive. This is why automation-driven content workflows free teams to focus on quality and audience fit.
Section 5: Measuring and Communicating Forecast Accuracy
Start by treating forecast accuracy as a performance metric, not a scoreboard. Measure consistently, interpret patterns, and translate results into a concise narrative that drives decisions. Below are the practical metrics to monitor, a simple process to improve forecasts over time, and communication formats that make non-technical stakeholders act.
5.1 Key metrics for forecast accuracy
Prerequisites: access to past forecast vs. actuals, a cadence for reforecasting (weekly or monthly), and a simple dashboard tool (spreadsheet, BI, orLooker/Metabase).
- Collect baseline data from past cycles and align on definitions (what counts as an outcome).
- Calculate the metrics below each cycle, compare trends, and set thresholds for investigation.
- Reforecast using the latest inputs; use ensemble approaches or weighted averages when single-model bias appears.
Forecast accuracy metrics with example values
| Metric | Description | Example Value | Action if Out-of-Band |
|---|---|---|---|
| MAPE | Mean Absolute Percentage Error across forecasts | 12.5% | Recalibrate model or adjust inputs; segment error by cohort |
| Hit Rate | % of forecasts within tolerance band (±10%) | 78% | Tighten tolerance for high-impact items; investigate misses |
| Bias | Average signed error (positive = overforecast) | +6% | Introduce bias correction factor; review assumptions |
| Lead Time | Average days between forecast and outcome | 30 days | Shorten lead time for volatile items; increase monitoring frequency |
5.2 Communicating insights to non-technical stakeholders
Prerequisites: an executive summary template, two visual formats (one-pager and slide), and a simple narrative framework.- Use an executive-friendly visual: one primary KPI chart, one variance waterfall, and one recommended action.
- Frame the narrative around decisions: what changed, why it matters to revenue or traffic, and the single next step.
- Keep language concrete: replace model jargon with business terms (e.g., “we underpriced impressions by 6% last month”).
Two-page vs. one-page report formats and suitability
| Format | Audience | Pros | Cons |
|---|---|---|---|
| Two-page report | Analysts, Ops leads | More context and detail; includes breakdowns | Too long for executives; risk of information overload |
| One-page dashboard | Executives, Product owners | Fast status, visual KPIs, actionable next step | Limited nuance; less suitable for deep root-cause |
| Executive slide | Board, C-suite | Focused recommendation with supporting visuals | One-off format; needs backup appendix for queries |
Practical tip: include a short What should we do next box on every deliverable with one prioritized action and estimated impact. For teams focused on content forecasts, tools that automate measurement and anomaly detection—like the AI systems at Scaleblogger.com that help Predict your content performance—shave hours from reporting and keep attention on decisions. Understanding these principles helps teams move faster without sacrificing accuracy.
📥 Download: Predictive Analytics Content Strategy Checklist (PDF)
Section 6: Practical Roadmap to Get Started Today
Start by focusing on measurable signals and a tight feedback loop: audit what you have, pick a few high-probability topics, publish quickly, then learn from performance. The 30-day plan below turns that into concrete weekly milestones so a small team can move from zero to a repeatable, data-driven publishing cadence.
- Week 1 — Fast audit and signal capture
- Action: Run a content inventory, check GA4 traffic trends, extract search console queries, and collect top-performing internal pieces.
- Why: Identifies low-hanging wins and gaps for forecasting.
- Week 2 — Forecasting and topic prioritization
- Action: Generate first-month traffic forecasts by topic cluster, prioritize by opportunity score (search intent × conversion potential).
- Why: Focuses effort where impact is highest.
- Week 3 — Rapid creation and publish
- Action: Produce 4–6 posts using templates and
semantic optimizationchecks, enable automated scheduling. - Why: Validates forecasts with live data quickly.
- Week 4 — Measure, iterate, govern
- Action: Compare actuals to forecast, adjust topic weights, lock in governance: cadence, owners, KPIs.
- Why: Converts learning into process improvements.
Illustrate a 30-day starter plan with milestones
| Week | Activity | Owner | Output |
|---|---|---|---|
| Week 1 | Content inventory; GA4 trend check; Search Console query list | SEO Lead | Audit report; prioritized signals |
| Week 2 | Forecast topics; score by intent & conversions | Data Analyst | Topic priority list; first forecast |
| Week 3 | Create content using templates; schedule publishing | Content Manager | 4–6 published posts; editorial calendar |
| Week 4 | Measure vs forecast; update governance | Head of Content | Performance dashboard; updated playbook |
> Industry analysis shows automation and predictive workflows reduce time-to-publish and increase hit-rate on prioritized topics.
How Scaleblogger fits into your data-driven workflow
Table: Section Content — Aspect, Manual Process, Scaleblogger Advantage
| Aspect | Manual Process | Scaleblogger Advantage |
|---|---|---|
| Data collection | Manual exports from GA4, Search Console; spreadsheets | Automated ingestion (GA4, Search Console); centralized signals |
| Forecast generation | Spreadsheet models; ad-hoc estimates | AI forecasting with historical pattern recognition; quick scenario runs |
| Reporting & governance | Manual dashboards; weekly syncs | Automated dashboards; governance templates; publishing automation |
Practical tips: start with 1–2 topic clusters, use templates for speed, and track forecast variance each week. If you want to scale the loop, use AI content automation to free creative time and maintain strict measurement windows. When implemented correctly, this approach reduces overhead by making decisions at the team level.
By shifting content decisions from intuition to forecasted signals, teams stop burning budget on low-impact pieces and start publishing with measurable confidence. The analysis in this article showed how predictive scoring surfaces which topics will resonate, how testing small experiments validates model output quickly, and how iterative feedback tightens accuracy over time. Companies that ran controlled pilots experienced higher organic traffic and better engagement in just one quarter. When editorial teams used forecasts with A/B tests, they also saw an increase in conversions.
Expect to set up initial models in weeks, validate with one or two pilot campaigns, and refine continuously — and be prepared to ask: How quickly will I see ROI? Start with narrow experiments that link forecasted topics to a single KPI. What data do I need?
Historical traffic, engagement metrics, and article metadata are the fastest inputs to meaningful predictions.
Operationalize these insights by running a short pilot, validating forecasts against real traffic, and scaling only proven topics. For teams looking to automate forecasting and integrate it with editorial workflows, platforms that centralize signals and outputs can reduce setup time and improve precision. As a practical next step, explore tools tailored for content forecasting: Start forecasting with Scaleblogger to pilot setup and move from guesswork to data-driven publishing.
