

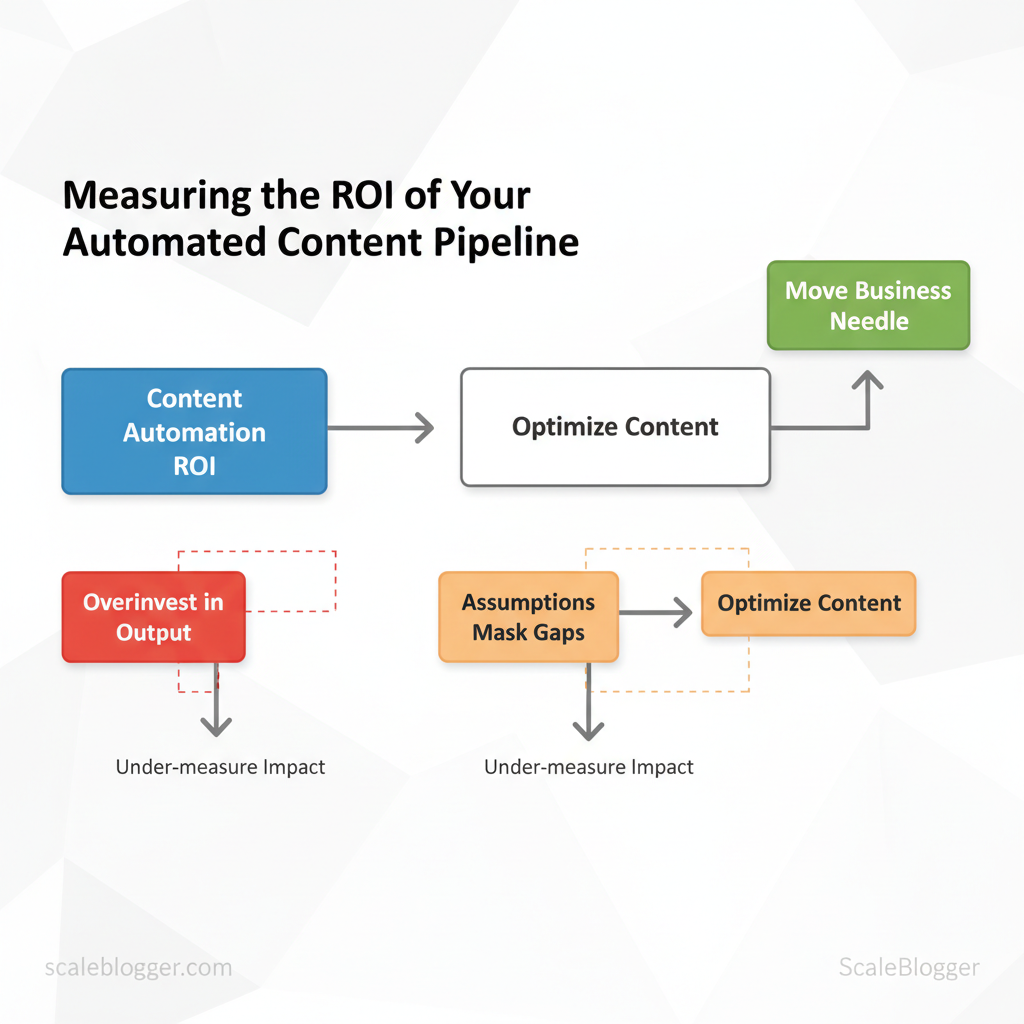
Marketing teams often focus too much on output and not enough on measuring impact. This can hide growth opportunities that are easy to see. When the pipeline is automated, assumptions about efficiency can mask gaps in actual returns — that’s where content automation ROI becomes the decisive metric rather than simple volume or throughput. By focusing on the right signals, teams stop guessing and start optimizing content that moves the business needle.
To measure content success, map workflows to outcomes, select the right KPIs, and attribute results across channels. That makes content marketing metrics and attribution models essential tools, not afterthoughts. Picture a team reallocating resources from low-performing templates to high-converting topic clusters and increasing qualified traffic without adding headcount.
- What to measure to calculate true ROI from automation
- How attribution changes when publishing scales rapidly
- Practical
KPItemplates for content funnels and lead impact - Ways to validate experiments without harming baseline performance
- How to use automation data to inform editorial strategy
Try Scaleblogger to automate content workflows and measurement — it streamlines tracking, standardizes KPIs, and surfaces the revenue signals that matter for measuring content success. The next sections walk through a repeatable, step-by-step approach to convert automation into measurable business value.
> Key Takeaway: ## Prerequisites & What You’ll Need
Start with the practical minimum: to measure ROI from content automation you need clean tracking, baseline performance, basic data skills, and aligned goals. If you don’t have 90 days of historical metrics and…
Prerequisites & What You’ll Need
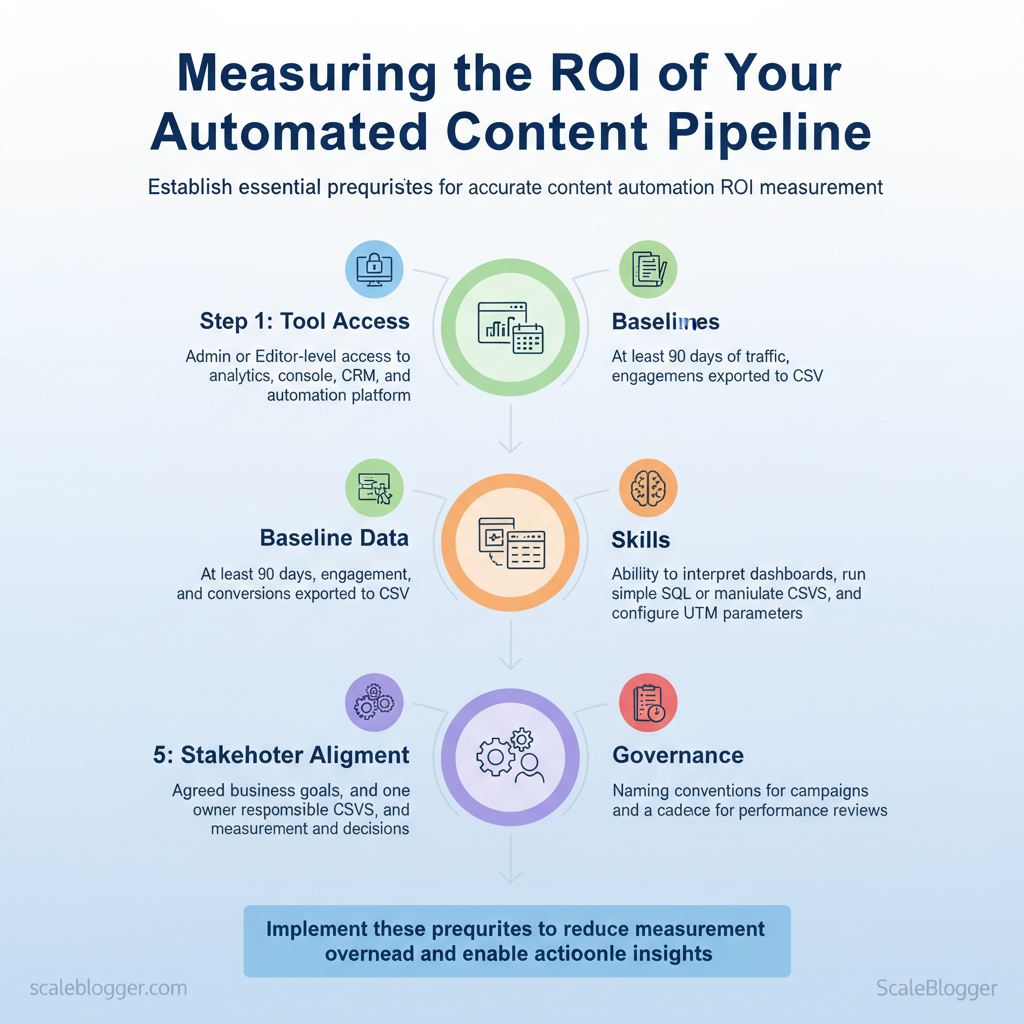
Start with the practical minimum: to measure ROI from content automation you need clean tracking, baseline performance, basic data skills, and aligned goals. If you don’t have 90 days of historical metrics and admin access to analytics and publishing platforms, any automation experiment will be guessing. The list below establishes the concrete tools, access levels, and quick setup actions that unlock reliable measurement and iteration.
Here’s what you need to get started:
- Tool access: Admin or Editor-level access to analytics, search console, CRM, CMS, and any automation platform. Baseline data: At least 90 days of traffic, engagement, and conversions exported to CSV so you can model seasonality and trends. Skills: Ability to interpret dashboards, run simple SQL or manipulate CSVs in
Google Sheets/Excel, and configure UTM parameters.
, traffic, leads, revenue) and one owner responsible for measurement and decisions. * Governance: Naming conventions for campaigns and a cadence for performance reviews (weekly for launch, monthly for optimization).
Map required tools and why each is required for ROI measurement
content automation tools checklist
| Tool/Resource | Purpose | Required Access Level | Quick Setup Action |
|---|---|---|---|
| Google Analytics (GA4) | Behavioral metrics, conversion funnels, engagement time; event-based tracking | Editor or Admin with property-level access | Create conversion events, enable cross-domain, link to Search Console |
| Google Search Console | Organic discovery, impressions, CTR, index coverage | Owner or Full user for site property | Verify site, submit sitemap, enable URL inspection |
| Marketing Automation / CRM (e.g., HubSpot, Salesforce) | Lead capture, attribution, LTV tracking, multi-touch attribution | Admin with API / integration rights | Map lead lifecycle fields, tag campaigns with UTMs, enable web tracking |
| Content Automation Platform (content pipeline/tooling) | Workflow automation, content generation, scheduling, publish APIs | Project Admin or Integrator | Connect CMS via API, configure publishing templates, set content scoring rules |
| Spreadsheet (Google Sheets / Excel) | Data consolidation, pivot analysis, simple attribution models | Editor access with sharing enabled | Import CSVs, build pivot tables, add date, source, campaign columns |
- Export 90-day baseline CSVs from GA4 and your CRM before enabling automation.
- Define 2–3 primary KPIs (traffic, marketing-qualified leads, revenue) and map them to events or CRM fields.
- Automate campaign naming and UTM tagging to preserve clean attribution.
Understanding these prerequisites avoids noisy experiments, speeds up valid A/B tests, and makes ROI conclusions actionable. When implemented correctly, this setup reduces measurement overhead and lets teams focus on content that actually moves business metrics.
> Key Takeaway: ## Define Clear Objectives & Success Criteria
First, translate your business goals into 2–4 measurable KPIs that will guide all content decisions. Pick 2–4 KPIs per objective, fix attribution rules up front, and use historical performance to set…
Define Clear Objectives & Success Criteria
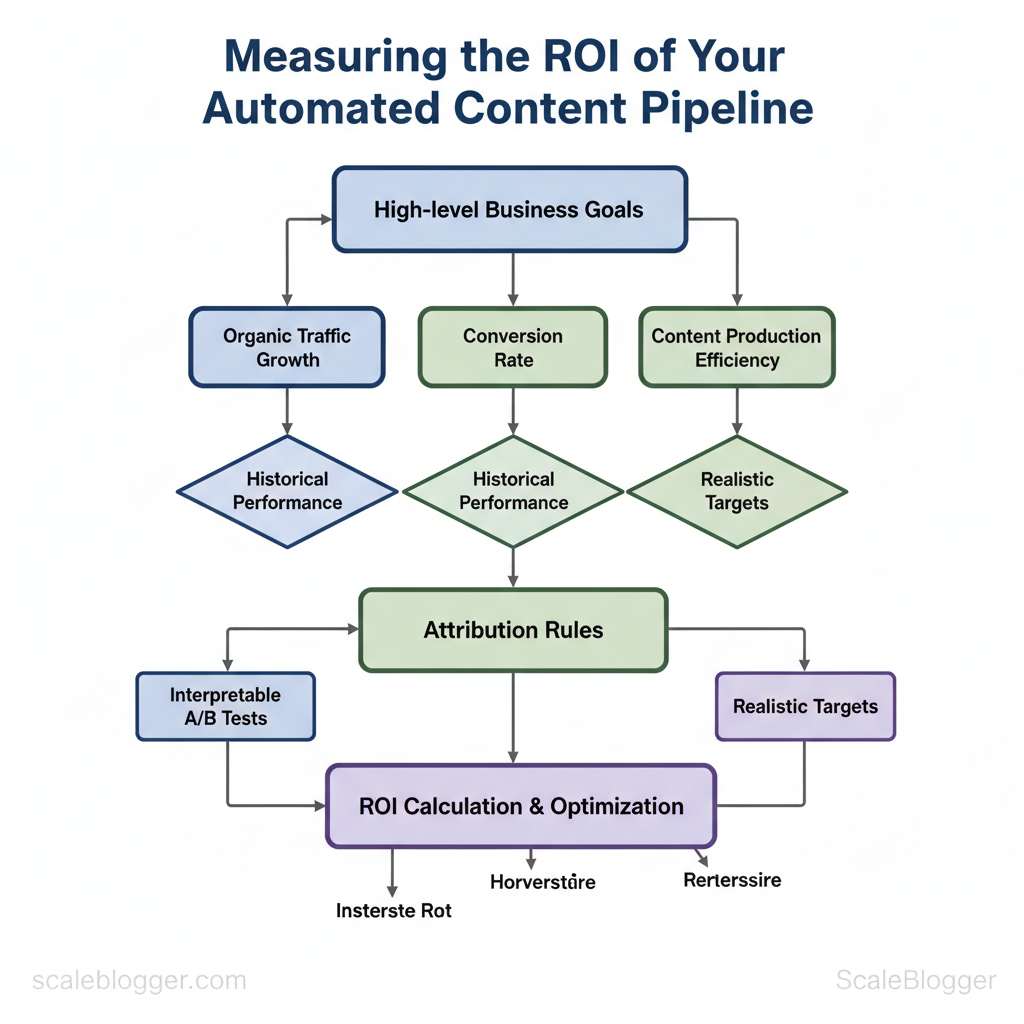
First, translate your business goals into 2–4 measurable KPIs that will guide all content decisions. Pick 2–4 KPIs per objective, fix attribution rules up front, and use historical performance to set realistic targets. That discipline prevents chasing vanity metrics and makes A/B tests interpretable.
Why this matters
- Focus: Narrow KPIs keep teams aligned on outcomes rather than outputs.
- Clarity: Attribution rules avoid post-test confusion about which channel ‘deserves’ credit.
- Pacing: Realistic targets reduce churn from repeated failed experiments.
Prerequisites
- Access to historical analytics data (GA4, CRM conversion history, ad platform reports).
- A documented attribution model (first-touch, last-touch, multi-touch).
- A centralized goal tracker (spreadsheet, BI dashboard, or an automation like Scaleblogger.com for content pipelines).
- Convert business goals into 2–4 measurable KPIs
- Map the business objective to a single Primary KPI (the metric you’ll ).
- Choose 1–3 Secondary KPIs to monitor side effects and health signals.
- Set a Recommended Timeframe based on funnel length and historical velocity.
- Use historical data to set baseline and realistic targets
- Pull the last 6–12 months of relevant metrics.
- Calculate median growth or conversion lift to set conservative/optimistic targets.
- Lock targets and the attribution model in writing before launching tests.
- Document targets, attribution, and measurement rules
- Capture metric definitions (
sessions,engaged sessions,MQL) and filters (exclude internal traffic). - Specify where each KPI lives (dashboard, spreadsheet) and who owns it.
Common measurement definitions
- Primary KPI: The main outcome (e.g.,
organic sessions,SQLs,new revenue). - Secondary KPI: Supporting signals (e.g., CTR, bounce rate, assisted conversions).
- Attribution rule: Which touch gets the credit (e.g.,
last non-direct click).
Common content objectives and their recommended KPIs
content marketing metrics examples
| Business Objective | Primary KPI | Secondary KPIs | Recommended Timeframe |
|---|---|---|---|
| Brand awareness | Impressions / Reach | CTR, social shares, branded search volume | 30–90 days |
| Lead generation | MQLs / Form fills | Conversion rate, CPA, assisted conversions | 30–90 days |
| Direct revenue | Attributed revenue | AOV, conversion rate, repeat purchase rate | 3–6 months |
| User engagement | Engaged sessions / Time on page | Pages per session, scroll depth, bounce rate | 30–60 days |
| SEO growth | Organic sessions | Top-3 keyword count, domain authority, organic CTR | 3–12 months |
Troubleshooting tips
- If targets are routinely missed, revisit baseline data and attribution assumptions.
- If secondary KPIs move opposite the primary KPI, pause and diagnose before scaling.
- If ownership is unclear, assign a single KPI owner responsible for reporting and next steps.
Understanding these principles helps teams move faster without sacrificing measurement integrity. When targets and attribution are agreed up front, experiments become learning vehicles instead of noise.
> Key Takeaway: ## Instrument Your Pipeline: Tracking & Attribution Setup
Start by treating tracking as if it were a code-based system. Standardize identifiers, capture micro-conversions, and connect analytics to CRM records to create a single source of truth.
Instrument Your Pipeline: Tracking & Attribution Setup
Start by treating tracking as if it were a code-based system. Standardize identifiers, capture micro-conversions, and connect analytics to CRM records to create a single source of truth. This approach prevents attribution drift, speeds up optimization cycles, and provides content teams with clear signals to prioritize topics and formats.
- Establish identifier conventions (1–2 hours)
- Define
content_idschema. Use a short, unique slug per asset (example:pillar-2025-seo-guide-v1). Store it in the CMS and expose as a meta tag anddata-attribute. - Standardize UTM parameters. Use fixed values for
utm_source,utm_medium,utm_campaign, and addutm_contentfor thecontent_id. Provide a one-line template for link builders.
?utm_source=newsletter&utm_medium=email&utm_campaign=may_launch&utm_content=pillar-2025-seo-guide-v1Expected outcome: All channel-level reports align; campaign tables never require manual normalization.
- Implement event tracking for micro-conversions (3–6 hours)
- Identify micro-conversions. Examples:
scroll_50,cta_click,time_on_content_180s,email_signup_step2. - Map events to
content_id. Sendcontent_idanduser_idwith every event payload. - Use consistent naming. Prefer
snake_caseorkebab-caseand document in a tracking plan.
Expected outcome: Ability to measure engagement quality per asset, not just pageviews.
- Link analytics to CRM and attribution system (4–8 hours)
- Persist identifiers server-side. When a lead converts, write
content_id, first-touch UTM, and recent events to the CRM lead record. - Sync bi-directionally. Pull CRM lifecycle stage back into analytics for funnel reporting.
- Reconcile deduplication logic. Decide on
first_touchvslast_touchrules and surface both in reports.
Expected outcome: Closed-loop reporting: content → engagement → conversion → revenue.
Practical examples and templates
- UTM template: Use the code snippet above and provide a one-click URL generator in editorial tooling.
- Event payload example:
{"event":"cta_click","content_id":"pillar-2025-seo-guide-v1","user_id":"anon_123","timestamp":...}
Troubleshooting tips
- Mismatch between CRM and analytics: Check for lost
content_idduring redirects or cross-domain flows. - Low-quality event data: Audit naming inconsistencies and duplicate events at the tag manager level.
Suggested tools and assets
- Tag manager: centralize event wiring; analytics: configure custom dimensions; CRM: add custom fields for identifiers. Consider integrating AI-powered orchestration like Scale your content workflow from Scaleblogger.com for automated tagging and publishing where relevant.
Understanding and enforcing these standards lets teams trust signals and move faster on optimizations without chasing inconsistent reports. When tracking is treated as infrastructure, content decisions become repeatable and measurable.
Collect & Normalize Data
Collecting and normalizing data means converting disorganized exports from different systems into one reliable dataset that guides content decisions. Start by aligning time ranges, canonical identifiers, and timezone references; then deduplicate conversion rows and validate that every event maps to a consistent content ID. The objective is a clean daily dataset that answers: which pieces earned traffic, which converted, and which distribution channels drove value.
Prerequisites
- Access: API or export permissions for Analytics, CRM, CMS, Ad platforms, and your automation tool.
- Standard IDs: A canonical
content_idorslugused across systems. - Time baseline: Agreement on
timezone(preferUTC) and reporting window.
Tools / Materials
- Extraction: platform APIs (GA4, HubSpot, WordPress REST API, Facebook Ads API)
- Normalization: Python/pandas or ETL tools (Airbyte, Fivetran) and a staging database
- Validation: simple SQL queries and checksum scripts
Step-by-step process
- Export consistent date ranges from every system (use identical start/end timestamps in
UTC). 2.
Normalize identifiers: map external IDs to a single content_id and add content_type. 3. Convert all timestamps to UTC and store both event_time and event_date.
- Deduplicate conversion records using composite keys (
content_id + user_id + conversion_type + date). 5.
Validate totals against source reports and surface mismatches for manual review.
Practical examples
- Example CSV header:
csv content_id,slug,event_time,event_date,channel,session_id,user_id,conversion_type,amount- Normalization rule: Map
utm_campaign→campaign_nameand trim to 64 chars. - Dedupe logic: Keep earliest
event_timefor identicalsession_id+conversion_type.
Example fields to export from each system and why they matter
| System | Field | Purpose | Example Value |
|---|---|---|---|
| Analytics | event_time | Timestamp for session-level alignment | 2025-05-28T14:22:03Z |
| Analytics | page_path | Link content to CMS slug | /blog/how-to-scale |
| CRM | contact_id | Tie conversions to user records | 0035a00001LxZ9A |
| CRM | deal_close_date | Revenue attribution timing | 2025-05-30 |
| Automation Platform | campaign_id | Map messaging to content outcomes | camp_72f3 |
| Automation Platform | send_time | Correlate sends to traffic spikes | 2025-05-28T13:00:00Z |
| CMS | content_id | Canonical content identifier | cb-2025-001 |
| CMS | word_count | Content quality signal | 1,450 |
| Ad Platform | ad_id | Ad-level spend attribution | 98234 |
| Ad Platform | cost | Paid spend to include in ROI | $312.45 |
Troubleshooting tips
- If totals don’t match, confirm timezone and
event_timeparsing first. - If many unmatched rows appear, expand matching keys to include
page_pathandreferrer.
When normalized correctly, data becomes actionable—teams can attribute content ROI, automate reporting, and distribution without repeated manual fixes. This is why automating the collection and normalization step pays dividends in speed and reliability.
Calculate ROI: Step-by-Step Formulae
Start by attributing revenue where it’s clearest, then layer in attribution sophistication as data permits. For many content teams, a straight revenue-attribution formula gives quick, defensible ROI; multi-touch or algorithmic models follow when channels and touchpoints multiply. The approach below converts engagement and attribution metrics into business-ready ROI statements that stakeholders understand.
- Choose an attribution model that matches your funnel complexity
- Convert channel metrics into monetary value (lead value, average order value)
- Aggregate costs (content creation, tools, distribution, paid media)
- Calculate raw ROI with
ROI = (Gain from Investment - Cost of Investment) / Cost of Investment - Adjust for time (annualize or apply cohort windows) and model uncertainty (confidence ranges)
Practical formulae and examples
- Basic revenue attribution: assign revenue from tracked conversions directly to content:
Content Revenue = Tracked Conversions × Average Order Value - Normalized ROI:
ROI = (Content Revenue - Total Content Cost) / Total Content Cost - Multi-touch weighted revenue: allocate revenue by touchpoint weight:
Weighted Revenue = Σ (Revenue × Touchpoint Weight_i) - Lifetime value adjustment: use
LTVfor subscription or repeat-purchase models:Adjusted Revenue = Tracked Conversions × LTV
Example calculation
Tracked conversions: 120 Average order value: $80 Total content cost (monthly): $6,000

Content Revenue = 120  $80 = $9,600 According to jasper.ai, ROI = ($9,600 - $6,000) / $6,000 = 0.6 → 60%
Attribution model comparison for choosing the right method
Attribution models: simplicity, accuracy, data requirements, best use case
| Attribution Model | Simplicity | Data Requirements | Best Use Case |
|---|---|---|---|
| Last-Click | Very simple | Minimal: conversion path logs | Short funnel, few touchpoints |
| First-Click | Very simple | Minimal: entry source data | Brand-awareness campaigns |
| Linear | Moderate | Full path data across sessions | Consistent cross-channel influence |
| Time-Decay | Moderate | Timestamped touchpoint sequences | Short sales cycles with recency bias |
| Algorithmic/ML | Complex | Full-funnel signals + modeling | Enterprise multi-channel optimization |
Practical tips and warnings
- Start simple: run last-click pilots to validate measurement flows before complex attribution.
- Estimate conservatively: when using LTV or multi-touch weights, apply a 10–30% uncertainty margin for decision-making.
- Automate reporting: integrate attribution into dashboards to spot trends quickly — consider
Scale your content workflowtooling to reduce manual reconciliation.
Understanding how to map metrics to dollars speeds decisions and clarifies investment priorities; when implemented correctly, this approach reduces argument time and directs spend where it consistently grows revenue.
Run the Measurement Plan: Step-by-Step Implementation
Begin by putting the plan into motion with a disciplined, repeatable sequence. Execute tracking, validate data quality, run calculations, and present findings so decisions follow evidence rather than intuition. The process below turns measurement design into operational reality and ensures stakeholders can trust the numbers.
Prerequisites
- Access: Admin-level access to analytics, tag manager, and data warehouse.
- Instrumentation checklist: Event names, parameters, and expected values documented.
- Owner alignment: Clear assignment of who owns each metric and cadence for reporting.
- Analytics platform:
GA4,Mixpanel, orAdobe Analytics - Tag manager:
Google Tag Manageror equivalent - Query engine:
BigQuery,Snowflake, or your SQL-ready warehouse - Visualization:
Looker,Data Studio, or a BI tool
Step-by-step execution
- Audit and deploy tracking. Verify that each event from the measurement plan is deployed in the tag manager and firing on the intended pages or API calls.
- Validate payloads. Use
networkinspector and tag-manager preview to confirm event names and parameter values match the specification.
- Instrument server-side where necessary. Move critical conversion events to server-side capture to eliminate client-side loss.
- Backfill and reconcile. If historical comparisons are needed, backfill events into the warehouse or compute modeled estimates for gaps.
- Run final calculations. Use reproducible SQL scripts or stored procedures to compute metrics, cohorts, and funnel conversions.
- Create visualizations. Build charts that map directly to stakeholder questions: trend lines, cohort tables, and funnel drop-off visualizations.
- Peer review. Have a data engineer or analyst re-run scripts and verify logic; look for attribution edge cases and sampling artifacts.
- Schedule automated refreshes. Configure daily/weekly refreshes and alerts for metric anomalies.
Example SQL snippet for a simple conversion rate
sql SELECT date, SUM(CASE WHEN event_name = 'purchase' THEN 1 ELSE 0 END) / NULLIF(SUM(CASE WHEN event_name = 'view_item' THEN 1 ELSE 0 END),0) AS conversion_rate FROM events WHERE date BETWEEN '2025-01-01' AND '2025-01-31' GROUP BY date;Presenting results
- Bold visualization: lead with a one-slide summary card that answers the business question. * Context row: show expected vs. actual, confidence intervals, and known tracking caveats.
- Action layer: attach recommended experiments or content changes.
Validate tracking before trusting numbers and present visuals that enable immediate action. Proper implementation reduces rework and turns the measurement plan into a reliable engine for decisions.
Interpret Results & Present Findings to Stakeholders
Begin by translating metrics into business impact: state the revenue uplift, change in CPA, or customer LTV delta before diving into technical attribution caveats. Stakeholders care about dollars and decisions, not raw charts. Be explicit about where results are confident and where attribution is probabilistic so decision-makers can act with appropriate risk assumptions.
Start here: convert outcomes into three headline metrics—revenue impact, cost-per-acquisition (CPA) movement, and predicted ROI—then walk through what drove those numbers.
Prerequisites
- Access: latest analytics exports (GA4/CSV), ad-platform spend reports, CMS engagement data.
- Alignment: agreed attribution model and reporting window.
- Audience: list of stakeholders and their decision scope.
Tools & materials
- Data extracts: GA4, Google Ads, CRM revenue exports.
- Visualization: Tableau/Looker/Google Data Studio.
- Template: slide deck and appendix CSVs (prepared for audit).
- Prepare headline slides that lead with business impact.
- Show attribution certainty: present deterministic vs probabilistic splits.
- Prioritize actions by projected ROI and implementation effort.
How to present results (step-by-step)
- Create an executive slide that opens with net change in monthly revenue and CPA delta; include projected 3-month ROI if recommended steps are taken. 2.
Explain methodology with a clear statement of the attribution model, confidence intervals, and any data gaps. 3. Surface top-performing assets with concrete KPIs: traffic, conversions, conversion rate, and revenue per asset.
- Offer 3 prioritized recommendations with expected lift, required resources, and estimated timeline to value.
Reporting and Recommendations table
Suggested slide deck structure and what each slide should contain
| Slide Title | Content | Data Visual | Takeaway |
|---|---|---|---|
| Executive summary | Monthly revenue change: +$45,000; CPA change: -12% | Area chart: revenue vs. spend | Quick decision metric: invest in channel A |
| Methodology & attribution | Attribution: probabilistic MMM + last-click layer; confidence ±8% | Sankey + confidence band | Attribution uncertainty documented |
| Top performing assets | Top 5 posts: page, conversions, revenue | Bar chart: revenue by asset | Focus content refresh on top 3 |
| Recommendations & next steps | 3 steps: scale paid, refresh content, test landing pages; cost $12k | Gantt + ROI forecast | Expected 3x ROI in 90 days |
| Appendix: raw data | GA4 exports, ad spend CSVs, model code snippets | Tables & downloadable CSV | Auditable evidence for stakeholders |
When proposing next steps, tie each recommendation to a dollar forecast and required resources so leaders can approve quickly. Understanding these principles helps teams move faster without sacrificing rigor.
Troubleshooting Common Issues
Start by isolating the failure mode: whether tracking, attribution, or data ingestion is broken. Reproduce the symptom, capture logs, then run targeted diagnostics—this prevents chasing transient noise. Below are repeatable steps, validation techniques, and escalation paths that fit a production content measurement pipeline.
Prerequisites
- Access: analytics account with debug permissions, CRM import logs, publishing platform logs
- Tools: GA debug view or
gtm.debugconsole, CRM CSV sample, network tab, API clientcurl - Time estimate: 10–60 minutes per issue depending on complexity
Immediate diagnostics and remediation
- Reproduce the symptom in a controlled environment (incognito, no extensions). 2.
Capture the Network tab and check for 200/400/500 responses on tracking pixels and API calls. 3. debug` or GA debug view.
- Re-run ingestion after fix and compare record counts to baseline.
Common Problems and Fixes Map problem → symptom → diagnostic step → fix
Table: Section Content — Problem, Symptom, Quick Diagnostic & more
| Problem | Symptom | Quick Diagnostic | Fix |
|---|---|---|---|
| Missing UTM | Sessions show direct or referral instead of campaign |
Check landing page URL in server logs and GA debug view for absent utm_* params |
Append utm_source/medium/campaign, enforce canonical redirects preserving query strings |
| Duplicate content IDs | Page-level events tied to two IDs; inflated event counts | Inspect page HTML and data-content-id with browser console; compare to CMS export |
Normalize to single content_id, deploy redirect or CMS template fix |
| Analytics sampling | Reports show sampling warning; metrics unstable | Open GA report sampling indicator or check BigQuery query limits | Use unsampled exports (BigQuery), reduce date range, or increase property quota |
| CRM import mismatch | Contacts fail import or fields misaligned | Review CRM import logs and sample CSV rows vs. field map | Align header names/types, use consistent email or external_id, re-run import with dry-run first |
| Time zone discrepancies | Dayparting reports off by several hours | Verify GA property time zone and server timestamps in logs | Standardize on UTC for ingestion, adjust reporting layer timezone conversions |
- Confirm event appears in GA debug view within 30 seconds
- Compare pre/post row counts in CRM import summary
- Run the same test across 3 different networks/browsers
- Log a timestamped screenshot and network HAR for audit
Escalation paths
- Analytics engineer: for tag/container regressions or sampling fixes
- CRM admin: for mapping, deduplication, or import reconfiguration
- Platform ops: for server-side redirects and time zone standardization
Link-worthy assets to add to the workflow include a HAR capture checklist, an import mapping template, and a content_id normalization script. When these diagnostics become routine, teams resolve issues faster and reduce measurement debt. This approach shortens incident cycles and keeps reporting reliable without adding manual overhead.
📥 Download: Content Automation ROI Measurement Checklist (PDF)
Tips for Success & Pro Tips
Treat your content operations like a production system from the start. Define clear inputs, remove bottlenecks, and check quality at every step. Automate routine tasks, enforce clear naming and version control, and present results with uncertainty built into reporting so stakeholders make better decisions.
Prerequisites
- Team alignment: agree on KPIs, publishing cadence, and ownership.
- Baseline data: a 3–6 month performance snapshot of traffic, CTR, and conversions.
- Access controls: single source of truth for content assets (CMS + cloud storage).
Tools / materials needed
- Version control: Git or a CMS with revision history. com` for accelerating workflows). Analytics: Google Analytics / GA4, Search Console, and a reporting spreadsheet or BI tool.
- Naming convention template: a short
site-section_slug_v01_yyyymmddspec.
- Standardize file and content naming
- Define a single pattern: create a one-line rule such as
topic-channel_language_version_date. - Enforce with templates: use CMS templates and CI checks for filenames and front-matter.
- Outcome: faster audits, fewer duplicate drafts, easier rollback.
- Automate repeatable tasks
- Automate QA checks: run spellcheck, broken-link scans, and metadata completeness checks on pull or pre-publish.
- Automate scheduling: use an automated scheduler to avoid manual publish errors and to maintain a steady cadence.
- Outcome: lower human error and predictable throughput.
- Use version control and branching
- Use branches for major rewrites: keep
mainfor publish-ready content andfeature/for drafts. - Tag releases: tag content rollouts with
vX.Yso performance experiments map to specific versions. - Outcome: traceability between changes and performance.
- Present results with confidence intervals
- Include ranges: report metrics as
mean ± CIwhere practical, or provide week-over-week ranges for small samples. - A/B experiments: always accompany lift claims with sample size and p-values or Bayesian credible intervals.
- Outcome: stakeholders get realistic expectations and reduce overreaction to noise.
Pro tips (quick wins)
- Use clear slugs: short, intent-driven URLs improve discoverability.
- Automate summaries: generate executive summaries from analytics weekly.
- Build topic clusters: group content by intent and internal-link systematically.
Understanding these principles reduces rework and helps teams move faster while keeping quality intact. When implemented consistently, automation and disciplined versioning free creators to focus on content that drives outcomes.
Next Steps: Operationalizing ROI Measurement
Start by assigning clear owners, automating as much of the pipeline as possible, and locking a review cadence that forces learning. That combination removes ambiguity about who tracks what, reduces the time analysts spend on repetitive reporting, and creates a regular feedback loop for improving attribution and content investments.
Prerequisites and tools
- Defined goals: revenue, leads, assisted conversions, or engagement.
- Instrumentation stack:
GA4or server-side analytics,BigQuery/data warehouse, CRM integration, and campaignUTMstandards. - Automation platform: ETL tool or scheduling (Airflow, Fivetran, or built-in publisher APIs).
- Reporting layer: Looker Studio, Tableau, or a lightweight dashboarding tool.
What follows is a practical 90‑day rollout and a reproducible process for continuous measurement.
90-day rollout: step-by-step
- First 2 weeks: establish measurement owners and minimal instrumentation.
- Weeks 3–4: implement automated data pipelines and baseline dashboards.
- Month 2: validate attribution models and integrate business metrics.
- Month 3: automate alerts, finalize KPI SLAs, and train stakeholders.
- Ongoing: continuous improvement and model recalibration.
Time estimates: Week 1–2 (setup, 40–60 hours), Week 3–4 (automation, 60–80 hours), Month 2 (validation, 30–50 hours), Month 3 (scale & training, 30–50 hours). Expect steady maintenance of 4–8 hours/week afterwards.
Operational rules of thumb
- Owner model: Assign a single measurement owner (content or growth lead), a data engineer for pipelines, and an analyst for model maintenance.
- Automation first: Move routine reporting to scheduled queries and dashboards within 30 days.
- Review cadence: Weekly slice reviews, monthly stakeholder reviews, quarterly strategy adjustments.
sql -- Example scheduled query: weekly content ROI SELECT content_id, SUM(revenue) AS revenue, SUM(cost) AS cost, (SUM(revenue)-SUM(cost))/SUM(cost) AS roi FROM project.analytics.content_attribution WHERE event_date BETWEEN DATE_SUB(CURRENT_DATE(), INTERVAL 7 DAY) AND CURRENT_DATE() GROUP BY content_id;Deliverables to produce
- Content measurement playbook (roles, data sources, definitions).
- Scheduled dashboards with drill-downs to campaigns and landing pages.
- Training session for PMs and writers on reading ROI dashboards.
90-day rollout plan with milestones and owners
90-day rollout plan with milestones and owners (content measurement rollout plan)
| Timeline | Milestone | Owner | Success Criteria |
|---|---|---|---|
| Week 1-2 | Define KPIs, owners, and instrumentation | Content Lead | KPIs documented; UTM taxonomy set; ownership sheet signed |
| Week 3-4 | Build ETL to warehouse and baseline dashboards | Data Engineer | Automated ETL runs; dashboard shows last 30 days data |
| Month 2 | Implement attribution model and CRM join | Analytics Lead | First attribution model validated; CRM match rate > 80% |
| Month 3 | Automate weekly reports and stakeholder training | Growth Manager | Weekly reports auto-delivered; 2 training sessions completed |
| Ongoing | Recalibrate models and continuous optimization | Measurement Owner | Quarterly model updates; ROI-informed content roadmap live |
Operationalizing ROI measurement is an execution problem as much as a technical one—clear roles and automation remove friction, while a steady review rhythm converts data into decisions. When teams adopt this approach, measurement becomes a driver of content strategy rather than a retrospective chore.
Conclusion
When measurement aligns with content production, teams stop guessing and begin to optimize. Centralize attribution, automate repetitive tasks, and focus on topics that demonstrably move pipeline — those steps reduce wasted output and reveal growth opportunities. For example, teams that automated attribution and prioritized conversion-driving topics often reallocated budget to higher-ROI campaigns and shortened time-to-lead; another group that standardized briefs and templates cut content turnaround by weeks while improving engagement rates.
Expect initial setup to take a few weeks, with measurable wins appearing within one to two quarters; if wondering what to track first, prioritize leads influenced, conversion rate by topic, and content-to-pipeline velocity. Begin by auditing where manual work piles up, then standardize briefs, instrument attribution, and automate reporting so analysis becomes a routine deliverable rather than an afterthought. For teams looking to accelerate that transition, platforms like Try Scaleblogger to automate content workflows and measurement can orchestration and make measurement repeatable.
Next steps: run a two-week audit, create three standardized templates, and schedule the first automated attribution report. Those actions surface low-effort wins fast and create momentum for broader content transformation.
