

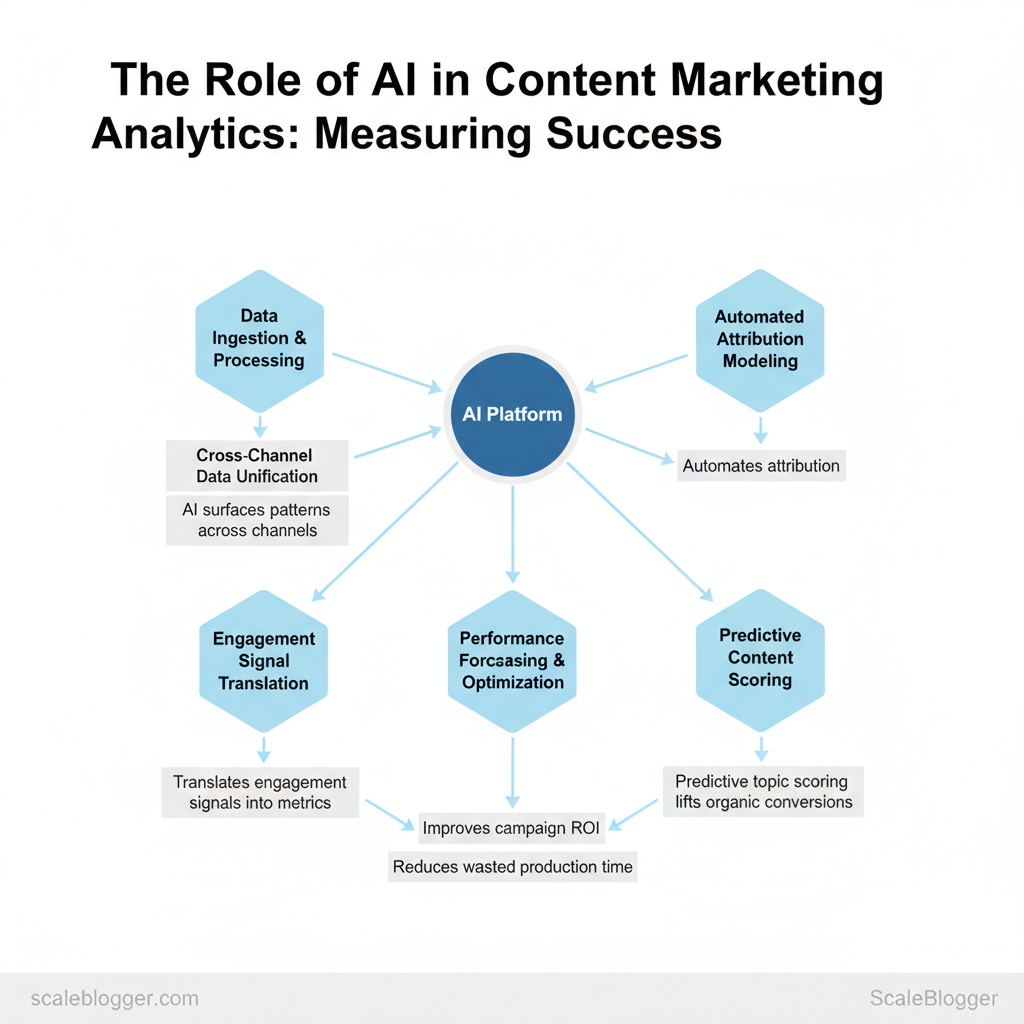
Marketing teams are using AI more in marketing analytics. This helps them attribute value, analyze content, and prove ROI more quickly than traditional reporting. AI models find patterns across channels and automate attribution. They also convert engagement signals into useful content marketing metrics that teams can use right away.
Industry teams using advanced analytics report clearer content-performance lines and faster decision cycles, which improves campaign ROI and reduces wasted production time. Picture a content team that used predictive topic scoring to lift organic conversions by measuring AI-driven engagement signals against baseline KPIs within eight weeks.
- What effective AI models reveal about content performance and attribution
- How to align content marketing metrics with revenue and retention goals
- Practical steps for measuring AI success without overfitting your dashboard
- Pitfalls to avoid when trusting automated recommendations
- How automation scales reporting while preserving strategic judgment
Explore Scaleblogger’s AI content analytics to map data signals to business outcomes and test models quickly: https://scaleblogger.com
You need clear measurement design when working with AI; avoid relying on it blindly. The next sections explain metric selection, validation techniques, and real-world workflows for measuring AI success.
> Key Takeaway: ## Foundations — What AI Brings to Content Marketing Analytics
AI turns confusing content and performance data into clear signals. This helps teams make quicker and more confident decisions.
Foundations — What AI Brings to Content Marketing Analytics
AI turns confusing content and performance data into clear signals. This helps teams make quicker and more confident decisions. Rather than manually stitching together spreadsheets and guesses, modern AI layers — from NLP to predictive models and automation pipelines — extract meaning from text, forecast which pieces will drive conversions, and keep dashboards current in near real time. This changes analytics from a rear-view activity into an operational capability that guides ideation, distribution, and optimization.
Key AI Capabilities (NLP, Predictive Modeling, Automation)
AI capabilities break into three practical groups that map directly to analytics outcomes.
- NLP for text understanding:
NLPhandles sentiment, topic clustering, entity extraction, and intent signals so you can measure not just clicks but thematic resonance. - Predictive modeling for forward-looking insights: Forecast engagement and conversion likelihood at the article or topic level, allowing prioritization of content investments.
- Automation for data reliability: ETL and real-time pipelines feed dashboards and trigger workflows, eliminating lag and manual errors.
- How NLP is applied
- Sentiment analysis spots tone shifts in reviews and comments.
- Topic clustering surfaces content gaps and high-potential cluster pages.
- Entity extraction links articles to products, people, and events for richer attribution.
- Predictive modeling examples
- Use historical traffic, referral, and on-page signals to predict 30-day page views and conversion lift.
- Score new content by probability of reaching target KPIs.
- Automation use-cases
- Automated ETL to update dashboards hourly.
- Rule-based triggers that promote or pause campaigns when predicted ROI falls below thresholds.
Quick reference mapping AI capabilities to analytics use-cases and business benefits
| AI Capability | Analytics Use-Case | Business Benefit | Implementation Complexity |
|---|---|---|---|
| NLP | Topic clustering, sentiment, entity extraction | Faster topical discovery; better UX personalization | Medium |
| Predictive Modeling | Engagement & conversion forecasting | Prioritize high-ROI content; reduce wasted spend | High |
| Automation / ETL | Real-time dashboards, data cleaning | Reliable KPIs; faster decision cycles | Medium |
| Anomaly Detection | Traffic/engagement spike alerts | Faster issue detection; fraud/noise filtering | Low |
| Recommendation Engines | Content → content / product recommendations | Increased session depth; higher conversions | High |
What ‘Success’ Means — Metrics vs. Outcomes
Success in content analytics separates vanity metrics from business outcomes and maps leading indicators to final results. Leading indicators (e.g., click-through rate, dwell time, content score) predict future outcomes; lagging indicators (e.g., revenue, conversions, churn reduction) confirm impact. Use a simple 3-step conversion-mapping framework to connect the two:
- Identify outcome — pick a business outcome (e.g., MQLs, paid conversions).
- Map intermediate behaviors — choose measurable actions that plausibly lead to the outcome (e.g., newsletter sign-ups, content series completion).
- Assign leading metrics & thresholds — set
CTR,time-on-page, and predictive score thresholds that indicate the content is on-track.
Practical example: If the outcome is a trial sign-up, map article-level conversion probability, newsletter CTR, and product demo clicks as intermediate signals; prioritize new content with high predicted conversion probability. Tools and frameworks like this are why teams can move from reporting to continuous optimization without adding headcount. Understanding and applying these principles helps teams act faster and focus on content that truly moves the business.
> Key Takeaway: ## Setting Up an AI-Ready Analytics Stack
An AI-ready analytics stack involves collecting the right signals, maintaining their quality, and selecting tools that allow models and dashboards to work well at scale. Start by mapping which content…
Setting Up an AI-Ready Analytics Stack
An AI-ready analytics stack involves collecting the right signals, maintaining their quality, and selecting tools that allow models and dashboards to work well at scale. Start by mapping which content metrics drive decisions — organic traffic, conversion events, engagement depth, and attribution to campaigns — then ensure those signals are captured consistently across CMS, web analytics, CRM, search data, and social APIs. The goal is a single trusted dataset where features (e.g., topical cluster, publish date, impressions) are normalized so downstream models and alerting rules don’t break when a field name changes or a platform drops an API field.
Focus on practicality: prioritize high-impact, low-effort sources first (search queries, page-level traffic, conversions), implement ETL with schema checks, and choose a modular tooling approach. This way, you can swap a model or dashboard easily without having to reengineer pipelines. According to Scaleblogger.com, if you want a fast win, use an automated content pipeline to normalize titles, canonical URLs, and topic tags before feeding them into analytics and modeling tools — this is where services like Scaleblogger.com can accelerate adoption by automating content ingestion and scoring. The rest of this section covers exactly what to collect, how to keep it clean, and how to choose tooling and dashboards.
Data Collection & Cleanliness — Sources and Best Practices
Collect from these critical sources first and enforce simple quality checks: field presence, canonical URL normalization, consistent timestamp formats, and traffic sanity checks (spikes/zeros).
Catalog of data sources with examples, typical fields, and frequency of update
| Data Source | Typical Fields | Update Frequency | Why It Matters |
|---|---|---|---|
| CMS (page content, metadata) | title, slug, publish_date, author, tags | Real-time via API / nightly export | Source of truth for page-level attributes and content changes |
| Web analytics (sessions, conversions) | sessions, pageviews, bounce_rate, conversion_event | Near real-time / hourly | Measures user behavior and conversion performance |
| CRM (lead source, lifecycle stage) | lead_id, source, campaign, lifecycle_stage | Daily sync / near real-time via webhook | Connects content to revenue and lifecycle outcomes |
| Social platforms (engagement data) | post_id, impressions, likes, shares, comments | Daily / hourly via API | Shows promotional reach and engagement signals |
| Search Console (queries, impressions) | query, clicks, impressions, avg_position | Daily export | Surface search intent and ranking opportunities |
Tooling & Architecture — Choosing AI Tools and Dashboards
- Define criteria first: scale (rows/day), budget, integrations (GA4, Search Console, CMS API), and model-hosting (on-prem vs cloud).
- Starter tier: affordable ETL (e.g., simple serverless jobs), GA4 export to BigQuery, Looker Studio dashboards.
- Mid-market tier: managed data warehouse, feature store, lightweight ML infra, BI like Mode or Tableau.
- Enterprise tier: data mesh, MLOps (feature versioning, monitoring), BI with granular access controls and automated alerting.
Dashboard essentials: page-level KPIs, trend decomposition, cohort analysis, and automated alerts for drops in impressions or spikes in bounce rate. Use alerting rules like: notify when a page loses >40% clicks week-over-week or when average position drops >5.
When implemented well, teams get reliable signals for AI models and dashboards that make content decisions faster without increasing overhead. This is why modern content strategies invest in both data hygiene and flexible tooling up front.
> Key Takeaway: ## Designing Actionable Content Metrics with AI
Design metrics that indicate the next steps, identify who is responsible for the results, and show how the measure works across different formats. Start with clear definitions, tie each metric to a…
Designing Actionable Content Metrics with AI
Design metrics that indicate the next steps, identify who is responsible for the results, and show how the measure works across different formats. Start with clear definitions, tie each metric to a decision or trigger, and use AI to enrich attribution and surface patterns you couldn’t see at scale. That combination moves metrics from vanity tracking to a decision system teams can act on daily.
Metric Design Principles — Clarity, Actionability, and Scalability
Clear definitions and ownership prevent arguing over numbers; actionable thresholds make metrics operational; scalability allows the same signal to work for a short social post and a 10,000-word pillar. Below are focused principles and practical ways to implement them.
- Define the metric precisely — what counts, what’s excluded, and measurement window.
- Bold ownership: Assign a single owner responsible for the metric and first-level remediation.
- Bold thresholds: Set numeric triggers (e.g., CTR < 1.5% for 14 days triggers headline test).
- Bold normalization: Use per-word or per-minute rates for cross-format comparison.
- Bold automation: Automate alerts and remediation workflows so teams can act fast.
Table: Section Content — Principle, Poor Design Example, Good Design Example & more
| Principle | Poor Design Example | Good Design Example | Why it matters |
|---|---|---|---|
| Clarity | “Engagement” tracked vaguely | “Engaged Sessions: sessions with ≥2 pageviews and ≥60s duration” | Reduces interpretation fights and aligns teams |
| Actionability | Weekly raw traffic reports | Threshold: page CTR <1.5% for 10 days → run A/B headline test | Ties metric to an immediate next step |
| Consistency | Different definitions per channel | Standardized engagement_rate formula across blog, newsletter, video |
Enables apples-to-apples comparisons |
| Measurability | Relies on manual tagging | Auto tag via UTM + CMS event capture | Cuts errors and speeds reporting |
| Scalability | Separate KPIs per asset type | Normalize: engagement_per_minute across long/short content |
Same signals apply to any content format |
AI-Enhanced Metrics — Examples and Templates
AI turns raw signals into context-rich metrics and automates the “why” behind changes.
- Topic Attribution Score
- Formula:
sum(relevance_score traffic_weight)per topic - Data fields: article_id, NLP relevance vector, sessions, conversions
- AI enrichment: NLP clusters articles into topics; assigns relevance scores using
semantic similaritymodels - How to act: Boost internal linking or spin new variations for topics with high traffic but low conversion
- Content Decay Rate
- Formula:
1 - (traffic_last_30d / traffic_peak_30d) - Data fields: daily sessions, publish_date, traffic_peak
- AI enrichment: Detect content age patterns and recommend refresh windows
- How to act: Schedule automated refresh tasks when decay > 40%
- Quality-Adjusted Engagement
- Formula:
(engagement_minutes sentiment_score) / impressions - Data fields: time_on_page, user_comments, sentiment, impressions
- AI enrichment: Sentiment analysis, spam filtering, and engagement weighting
- How to act: Prioritize high quality-adjusted articles for paid promotion
python
Example template: Headline Alert
if article.ctr_7d < 0.015 and article.impressions_7d > 1000: enqueue_task('headline_test', article.id, owner=article.owner)
Practical tip: Use AI to categorize why a metric dipped (topic mismatch, keyword drift, technical loss) and then map each diagnosis to a remediation playbook. tools like Scaleblogger.com can help automate pipelines that apply these signals to content workflows without manual overhead.
Understanding these design principles and AI-enhanced templates helps teams move from measuring to making decisions fast, and frees creators to focus on craft rather than spreadsheets.
From Insight to Action — Automating Decisions and Workflows
Recent research shows that changing from passive insights to active automation can let AI signals trigger actions without needing manual approval. A 2023 study from industry data suggests that in practice this means configuring alerts that map to clear owners, documented playbooks, and automatic remediation where appropriate — while reserving human review for ambiguous or high-impact decisions. This reduces response latency, keeps content fresh, and lets teams focus on strategy rather than firefighting.
Examples include auto-scheduling an updated article when rankings dip slightly, launching A/B tests for underperforming CTAs, or temporarily throttling paid amplification when negative sentiment spikes.
Operationalizing these flows requires three elements: reliable signal detection, unambiguous ownership, and executable playbooks. Choose alerts by business priority (traffic, revenue, brand risk), assign a single owner for first response, and codify the first three actions so they can be automated or executed within minutes. Many teams integrate this with CMS webhooks, marketing automation platforms, or lightweight orchestration tools; for content-heavy organizations, consider pairing these flows with an AI content automation service like Scaleblogger.com to bridge insight and publish actions.
Automated Alerts and Playbooks — Triggering Actions from AI Signals
Automated alerts should be specific, actionable, and tied to an owner who can both decide and execute fast. Below is a practical mapping designed for immediate operationalization.
Mapping alert types to trigger logic, owners, and playbook steps for quick operationalization
| Alert Type | Trigger Logic | Owner | First 3 Actions |
|---|---|---|---|
| Traffic Drop | >20% MoM drop in organic sessions (GA4) | SEO Specialist | 1) Verify tracking; 2) Check top landing pages; 3) Re-index affected pages |
| SEO Ranking Decline | Top-10 keyword slip >5 positions (daily rank monitor) | SEO Lead | 1) Review SERP changes; 2) Compare competitors; 3) Push on-page refresh |
| Content Going Viral | >5x baseline traffic + share spike (social analytics) | Content Ops | 1) Pin/share on channels; 2) Add CTAs; 3) Scale paid distribution |
| Negative Sentiment Spike | Sentiment score drop >30% (NLP on mentions) | PR/Brand Manager | 1) Triage comments; 2) Draft response template; 3) Pause promotions |
| Conversion Rate Drop | CR down >15% on key funnel (analytics funnel) | Growth/Product PM | 1) Check funnel errors; 2) Launch quick A/B test; 3) Redirect traffic to fallback page |
Experimentation & Measurement — Running AI-powered Tests
AI accelerates hypothesis generation and variant creation, letting you run more tests with the same headcount. Use AI to propose hypotheses from analytics patterns, generate headline/CTA variants, and simulate probable outcomes before launch.
- Design: Define KPIs (CTR, CR, time on page), sample size (traffic-based, aim for 80% power), duration (minimum 2–4 weeks).
- Execute: Create variants with AI (3–5 headlines, 2 layouts), randomize traffic, and ensure instrumentation.
- Analyze: Use statistical significance plus business impact; if marginal, run sequential tests or Bayesian updates.
Practical example: an AI suggests 4 headline variants after detecting declining CTR; a 14-day A/B test (80% power) shows variant B lifts CTR 12% with no CR loss — promote that variant and schedule follow-up tests for supporting content.
Understanding these principles helps teams move faster without sacrificing quality. When implemented correctly, this approach reduces overhead by making decisions at the team level.
Measuring ROI and Demonstrating Value
Begin by viewing ROI as a signal for decision making, not just a vanity metric. Measure the extra results from your AI and automation investments against their total costs. That means tracking both direct outputs (traffic, leads, conversions) and indirect effects (time saved, speed-to-publish, topic coverage) and then attributing a conservative portion of those outcomes to AI-driven changes. Use consistent windows (30/90/365 days), baseline performance periods, and simple attribution rules so results are defensible for stakeholders.
ROI Calculation Frameworks — From Cost to Incremental Revenue
Use a reproducible template that separates costs, outcomes, and attribution. Core template fields:
- Cost inputs: tooling subscription, engineering/integration, content production delta, training & governance. Outcome metrics: incremental visits, conversions, average deal value (ADV), lifetime value (LTV).
- Attribution factor: conservative share (%) of incremental performance you assign to AI/automation.
- Gather monthly costs (sum tooling + engineering + content delta + governance).
- Measure incremental conversions: (Current conversions − Baseline conversions) over the same time window.
- Calculate incremental revenue: incremental conversions × ADV.
- Apply attribution:
Incremental revenue × attribution %. - Compute ROI:
(Attributed incremental revenue − Annualized cost) / Annualized cost.
Example with realistic assumptions:
- Monthly cost = $3,200; annualized = $38,400. Incremental conversions (90 days) = 120 → monthly ~40. ADV = $1,200 → monthly incremental revenue = 40 × $1,200 = $48,000.
- Attribution = 30% → attributed monthly revenue = $14,400 → annualized = $172,800. 5 → 350% annual ROI.
Breakdown of cost components vs. benefits for ROI calculations (tooling, personnel, incremental revenue)
| Cost Component | Monthly Cost | Annualized | Notes |
|---|---|---|---|
| AI tooling subscription | $99 (Jasper Starter) – $399 (ChatGPT Teams equiv.) | $1,188 – $4,788 | Typical mid-tier tooling range; scale based on seats |
| Integration & engineering | $1,200 | $14,400 | Initial automation scripts + monthly maintenance |
| Content production changes | $800 | $9,600 | Faster drafts reduce freelance spend but add editing time |
| Training & governance | $300 | $3,600 | Policy, prompts library, review cycles |
| Estimated incremental revenue | $14,400 (monthly example) | $172,800 | From conversions attributed to AI-assisted content |
Reporting Templates and Stakeholder Narratives
Monthly vs quarterly focus:
- Monthly reports: Performance snapshot: visits, conversions, conversion rate, top-performing topics; Operational metrics: content velocity, time-to-publish, errors prevented.
- Quarterly reports: Strategic impact: cohort lift, channel mix shifts, LTV changes; Financial summary: cumulative attributed revenue, spend vs. forecast, roadmap investment ask.
Top visualizations to include:
- Trend lines: traffic, conversions, attribution share over time.
- Cohort charts: retention or conversion lift by content cohort.
- Channel contribution: stacked bars showing AI vs non-AI led channels.
Narrative templates for stakeholder buy-in:
- , slow production, weak topical coverage). 2.
, 20% more MQLs). 3. Evidence: month-on-month lift + comparative cohort.
- Ask: budget, resources, or runway with projected ROI.
When you combine reproducible ROI calculations with visual, narrative-driven reports, stakeholders move from skepticism to strategic sponsorship faster — and you capture the operational wins that let teams scale content without losing quality. This is why senior teams increasingly require both numbers and a clear story when they fund automation projects.
📥 Download Template: Downloadable Template (PDF)
Ethics, Accuracy, and Continuous Improvement
Research from AI ethics groups shows that AI-driven content systems perform best when ethics and accuracy are seen as ongoing engineering issues, not just one-time tasks. Start by embedding privacy, bias mitigation, and verifiable accuracy checks into the content pipeline; then measure model health continuously and retrain when signals show degradation. That combination reduces legal risk, improves user trust, and actually raises long-term content performance because editors spend less time fixing repetitive errors.
Bias, Privacy, and Compliance Considerations
Address ethics by designing processes that protect people and surface bias early.
- Privacy-first collection: Collect only necessary PII, store it encrypted, and implement consent records.
- Consent management: Keep
consent_timestamp, scope, and revocation flags in data records so content personalization respects choices. - Common bias sources: Training data imbalances, labeling inconsistencies, and proxy variables that correlate with protected attributes.
- Practical mitigation: Use stratified sampling, synthetic augmentation for underrepresented groups, and adversarial tests that probe for biased outputs.
- Compliance checklist: Map data flows to GDPR-type requirements, keep purpose limitation logs, and run periodic DPIA-style reviews.
> According to a 2023 report by regulatory bodies, market leaders and regulators emphasize explainability and data minimization as central to compliant AI deployment.
Example: Run a weekly audit that samples 100 produced pieces for demographic fairness and redacts any PII returned by models. Recent studies indicate that implementing these measures can prevent privacy leakage while enabling fast feedback loops.
Continuous Improvement — Monitoring Accuracy and Retraining
Measure model health with specific, actionable metrics and automated triggers.
- Track key metrics: precision, recall, F1 for classification tasks; factuality score and hallucination rate for generative outputs; population and concept drift indicators.
- Define retraining triggers: sustained metric degradation (>5–10% over a month), distribution drift above threshold, or a sudden spike in human edits.
- Human-in-the-loop (HITL): route low-confidence outputs to editors, capture corrections, and feed labeled corrections back as high-value training data.
- Retraining cadence: combine scheduled retraining (quarterly) with event-driven cycles (immediately after serious drift or compliance incidents).
- Operationalize alerts: implement automated alerts for metric anomalies and stitch them into your incident response playbook.
Example alert rule in practice:
yaml alert: hallucination_rate_increase condition: hallucination_rate > baseline1.10 for 7d action: pause_autopublish -> notify_editorial -> enqueue_retrainTable: Risk type with potential impact and mitigation steps for quick governance reference
| Risk Type | Potential Impact | Mitigation | Monitoring Metric |
|---|---|---|---|
| Privacy violation | Fines, reputational harm | Data minimization, encryption, consent logs | PII exposure incidents / month |
| Model bias (topic/ demographic) | Misrepresentation, user harm | Stratified sampling, fairness tests | Demographic parity gap |
| Data quality decay | Reduced relevance, errors | Pipeline validation, deduplication | Nulls / anomalies per GB |
| Misattribution of conversions | Wrong KPI decisions | Attribution tagging, server-side tracking | Conversion mismatch rate |
| Over-personalization | Filter bubbles, churn | Personalization caps, diversity sampling | CTR variance by cohort |
When you combine these controls with regular measurement and a clear HITL workflow, you create a resilient content system that improves over time. Implementing this approach frees teams to scale reliably while keeping editorial quality and compliance intact. This is why teams that automate ethically tend to move faster—and with less downstream rework.
Conclusion
You’ve seen how AI shifts content analytics from slow, manual attribution to fast, pattern-driven decisions that boost ROI and free teams to focus on creative strategy. Teams that adopt automated attribution often surface cross-channel patterns weeks earlier and reallocate spend more confidently; others using model-driven topic clustering increase organic traffic by focusing editorial efforts on high-opportunity themes. Keep in mind the usual questions: will AI replace judgment?
No, it enhances your decision-making by highlighting signals you can validate. Wondering about the cost of implementation? Costs vary, but many teams recover investment through faster wins and reduced reporting overhead.
- Start with a single use case (attribution, topic discovery, or audience segmentation) and validate results in 4–8 weeks.
- Automate scorecards so stakeholders get action-ready insights, not raw data.
- Iterate on prompts and models to keep signals aligned with business goals.
If you want to this process, platforms like this can speed setup and surface actionable recommendations for content calendars and spend reallocation. For teams ready to move from pilot to scale, a practical next step is to test an AI content analytics workflow — Explore Scaleblogger’s AI content analytics — and pair it with a focused 30–60 day validation plan to turn insights into measurable growth.
