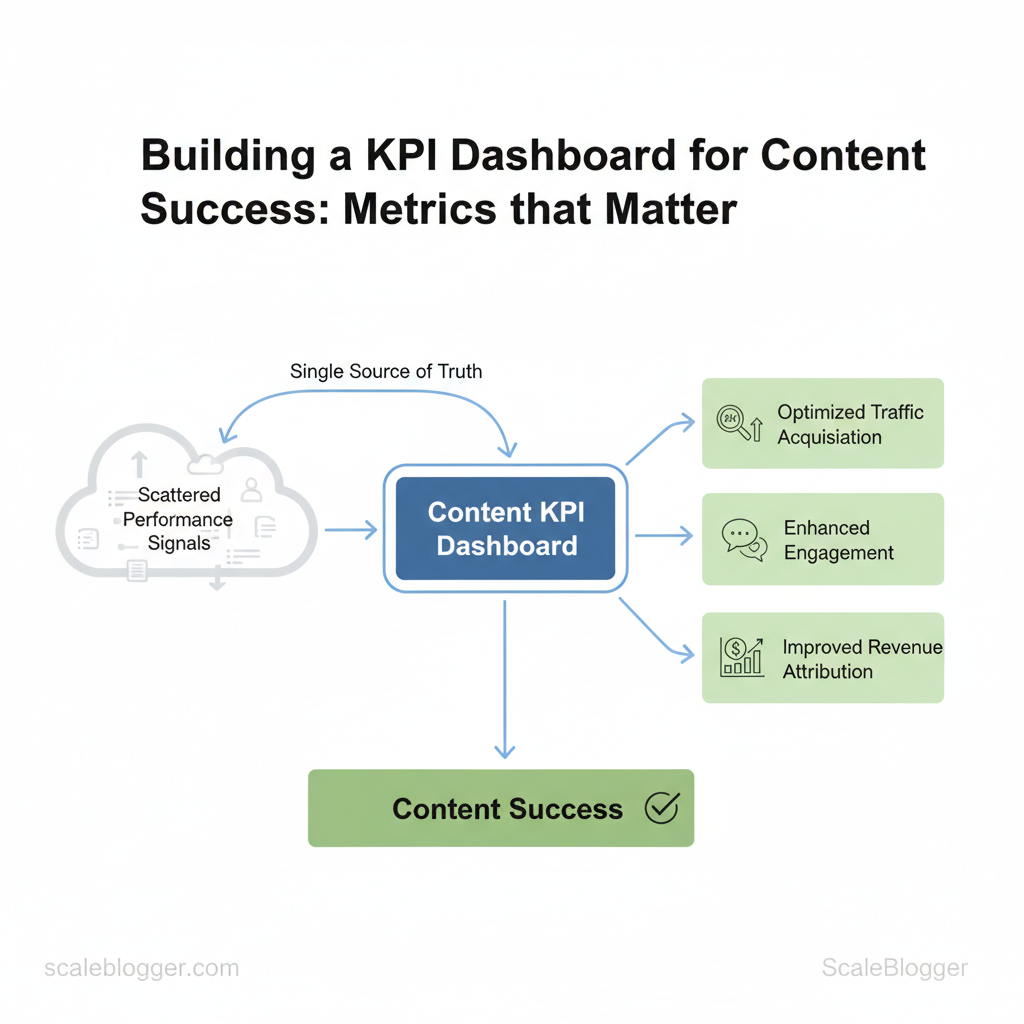
Marketing teams lose momentum when they can’t prove which content moves the needle. Building a content KPI dashboard fixes that by turning scattered performance signals into a single source of truth for decision-making. With clear visibility into content marketing metrics, teams stop guessing and start optimizing where it matters — traffic acquisition, engagement, and revenue attribution.
Picture a dashboard that surfaces the weakest pages, highest-converting topics, and channels wasting budget, all in one view. That clarity shortens review cycles, improves editorial planning, and aligns content efforts with business goals measured through consistent frameworks for `CTR`, time on page, and conversion rate.
This introduction prepares practical steps for designing a dashboard focused on measuring content success, choosing the right signals, and automating reporting to reduce manual work. Expect concrete rules for metric selection, visual design choices that prompt action, and common pitfalls to avoid when you move from vanity metrics to business-impact indicators.
- How to pick three priority KPIs that link to revenue
- When to use engagement versus funnel metrics for decision-making
- Design patterns that make patterns obvious to stakeholders
- Automations that cut weekly reporting time in half
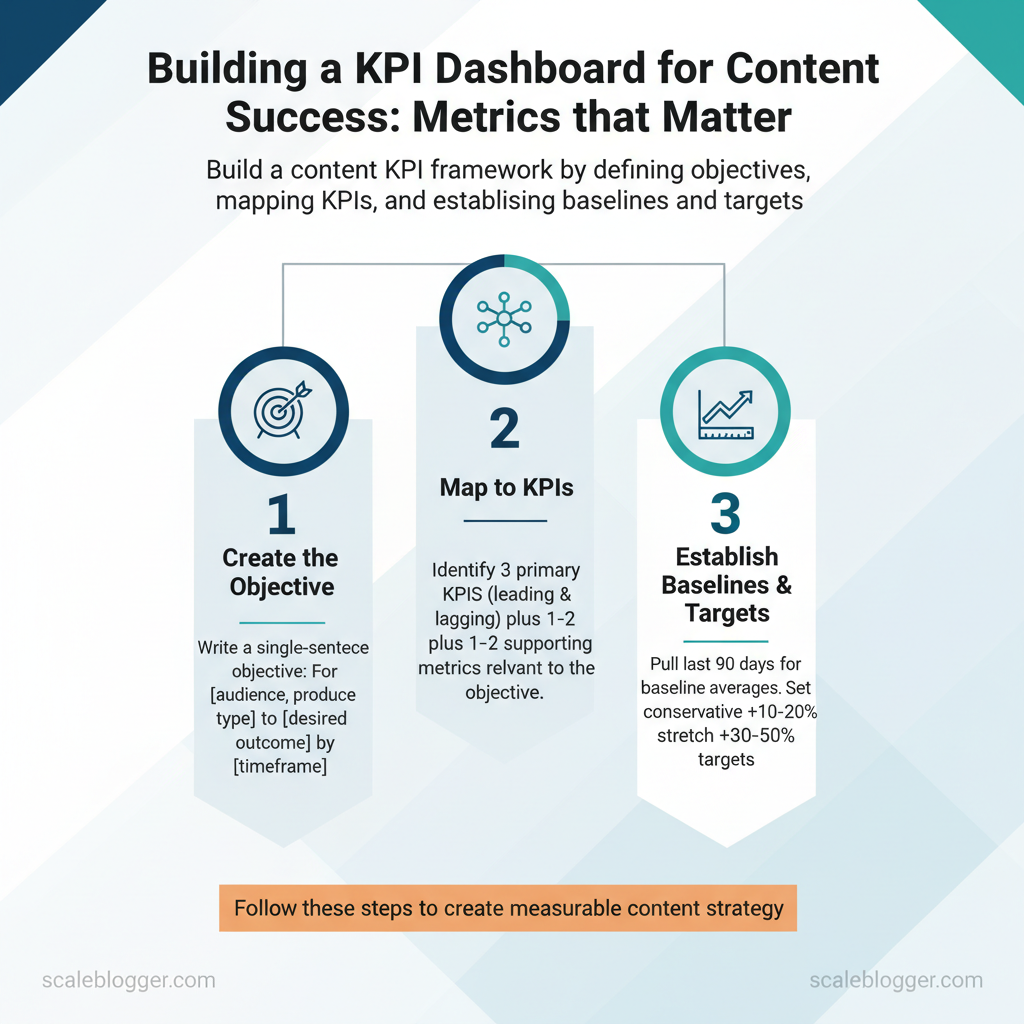
Define Objectives and Mapping to Business Goals
Begin by choosing one clear business-driven objective per content campaign and map it to measurable outcomes. Pick objectives that reflect where the company is now — awareness for early-stage brands, acquisition when demand needs to scale, engagement to deepen relationships, retention for subscription models, and revenue enablement where content must accelerate sales. Each objective should translate into specific KPIs, a baseline, and a realistic stretch target so teams know whether the work moved the business.
Common content objectives and how they map in practice: Awareness — Primary KPI(s): organic impressions, new users; Use when:* launching brand or entering a new market. Acquisition — Primary KPI(s): new leads, conversion rate; Use when:* scaling demand generation. Engagement — Primary KPI(s): time on page, pages per session; Use when:* improving content depth or lowering churn risk. Retention — Primary KPI(s): repeat visits, login frequency; Use when:* subscription or product usage drives LTV. Revenue Enablement — Primary KPI(s): MQL-to-SQL rate, deal velocity; Use when:* prioritizing pipeline acceleration.
Select the Right Metrics: What to Track and Why
Prerequisites: access to `GA4` property, CRM export (CSV), and your content calendar. Tools/materials needed: Google Analytics / GA4, CRM or marketing automation, UTM builder, spreadsheet or BI tool, and a simple content scorecard template.
Start by tracking metrics that align with business outcomes rather than vanity signals. Prioritize metrics that measure reach, engagement, and conversion while layering qualitative signals to assess brand and content quality. Measurement best practices include consistent `UTM` tagging, a fixed attribution window (commonly 30 days for content campaigns), and documented naming conventions in a shared analytics glossary.
Core metrics explained Sessions — total visits to content.* Measure in GA4 under Reports > Engagement > Pages and screens. Organic Sessions — visits from organic search.* Filter by default channel grouping `Organic Search`. Time on Page — engagement depth per page.* In GA4, calculate as `average_engagement_time` per page. Conversion Rate — percentage of sessions that complete a goal.* Track via GA4 conversion events mapped to business goals. Leads Generated — explicit contact actions logged to CRM.* Use form submits, demo requests, and API syncs to match sessions to leads.
| Metric | Definition | How to Measure | Formula / Notes |
|---|---|---|---|
| Sessions | Total visits to content pages | GA4 > Engagement > Pages and screens | No formula; use `sessions` metric |
| Organic Sessions | Visits originating from search engines | Use default channel `Organic Search` filter | Compare month-over-month for SEO impact |
| Time on Page | Average time users stay engaged | GA4 `average_engagement_time` per page | Use >30s as a basic engagement threshold |
| Conversion Rate | % sessions with defined conversion event | Conversions / Sessions | Example: `conversions ÷ sessions × 100` |
| Leads Generated | Number of contacts recorded in CRM | CRM export matched to GA4 via UTM/session ID | Include lead quality tags (MQL/SQL) for context |
Advanced and qualitative metrics
Measurement steps
Common misinterpretations to avoid: conflating time on page with intent, treating organic growth as only SEO work, or using conversion rate without lead quality context. When implemented consistently, this metric mix reveals not just what content performs, but why it moves the business—letting teams prioritize work that drives measurable impact.
Data Sources and Tracking Implementation
Start by treating tracking as a data contract between marketing, product, and analytics — define the events you expect, the identifiers you’ll use, and the SLAs for data quality. Set up a single analytics property (typically `GA4`) and a tag layer (`Google Tag Manager` or equivalent) first, then map UTM conventions, events, and CRM identifiers so every system speaks the same language. The practical outcome: reliable, auditable signals for content performance and lead attribution.
How to validate tags and events
- Manual test flows: Navigate test pages, complete forms, and inspect `dataLayer` and `Network` calls in DevTools.
- Tag assistant: Use `GTM Preview` or browser extensions to confirm triggers and payloads.
- Event replay: Send test events from staging to confirm ingestion and conversion mapping.
- Integration pattern: analytics → ETL/BI (e.g., BigQuery) → CRM. Pull raw event streams into BI for joins, then push aggregated lead scores to CRM.
- Attribution models:
Handling mismatched data and cleaning
- Normalize `UTM` values (lowercase, trimmed), dedupe event streams by `event_id`, and reconcile timing offsets with timezone-aligned timestamps. Use deterministic joins (email or `user_id`) when possible; fall back to probabilistic joins only with clear accuracy metrics. Automate ETL rules to flag missing identifiers and route problematic rows to a quarantine table for analyst review.
| Tracking Item | Why It Matters | Implementation Notes | Validation Steps |
|---|---|---|---|
| Pageview tracking | Baseline engagement metric | `GA4` page_view via `GTM` on DOM ready; server-side tagging optional | Check `page_view` in Realtime, verify path parameters |
| UTM consistency | Enables campaign-level attribution | Enforce lowercase UTMs; canonicalize landing pages; `utm_campaign` naming pattern `yyq_product_feature` | Scan query strings weekly; use regex rules to find variations |
| Event tracking (form submit) | Captures leads and micro-conversions | Push `form_submit` to `dataLayer` with `form_id`, `lead_email` | Submit test forms; confirm event in GA4 and BigQuery export |
| Conversion tracking | Measures goal completion & ROI | Define conversions in GA4; map to CRM `lead_stage` updates | Compare GA4 conversion counts vs CRM closed-won daily |
| CRM lead match | Close the loop between analytics and revenue | Send `lead_id` and `user_id` to CRM on form success; use webhooks/ETL | Verify lead records contain `lead_id`; reconcile counts |
Understanding these principles helps teams move faster without sacrificing data quality. When implemented correctly, this approach reduces manual reconciliation and lets analysts focus on insights rather than firefighting.
Designing the Dashboard: Layouts, Visualizations, and UX
A clean dashboard answers questions within two clicks. Start by defining who will use the dashboard, then design focused views that surface only the KPIs each persona needs. Structure matters: place context and trends at the top, controls and filters left or top, and detailed tables or exploration panels below. Keep each view to 3–6 KPIs so users can scan, decide, and act without cognitive overload.
Why this approach works: busy stakeholders need a quick signal (trend + variance) and the ability to drill down. Product and content teams need different entry points — executives want high-level trends, content managers need page-level diagnostics, and analysts want raw segments and exportability. Design layouts that mirror those workflows and use visualization types that map directly to the question being asked.
Prerequisites and tools
- Data readiness: Clean GA4/events, CMS page identifiers, and conversion mapping.
- Visualization tools: Looker Studio, Tableau, or internal BI with embeddable filters.
- Design assets: KPI glossary, color palette with WCAG contrast, and a persona brief.
Visualization best practices (selection and labeling)
- Bold: Use concise chart titles and one-line subtitles that define metric and time window.
- Italic: Use `95% CI` or `MoM` to clarify statistical context.
- Legend discipline: Show legends only when multiple series are present; prefer inline labels for single-series charts.
- Ensure color palettes meet contrast ratios and choose colorblind-friendly schemes.
| Question to Answer | Recommended Chart Type | Why It Works | Usage Notes |
|---|---|---|---|
| Show performance over time | Line chart (multi-series) | Shows trends and seasonality clearly | Use rolling average line, annotate events, limit series to 4 |
| Compare channel contributions | Stacked bar or 100% stacked bar | Conveys share and absolute volume together | Use stacked for absolute volume, 100% stacked for proportional view |
| Show content engagement distribution | Histogram or box plot | Reveals skew, median, and outliers in engagement | Use bins for histogram; box plot for median/IQR; include sample size |
| Identify outlier pages | Scatter plot (engagement vs. traffic) | Highlights pages that over/underperform relative to peers | Size by conversions, color by channel; add drill-to-URL |
Automation, Reporting Cadence, and Governance
Automate data refresh and report distribution so teams get timely, accurate insights without manual handoffs; pair that automation with clear governance—single owners, regular QA, and a lightweight review cycle—to prevent errors from scaling. Implement connectors that fit scale and budget, set audience-specific refresh cadence (`real-time`, `hourly`, `daily`, `weekly`), and embed an automated insights email that highlights the delta, confidence level, and recommended action. Establish a named data owner, a documented QA checklist, and a RACI for dashboard lifecycle tasks so changes move fast but remain accountable.
Automate data refresh and report distribution
- Recommended connectors: choose based on source complexity and latency needs—native connectors for GA4 and advertising platforms, ETL for multi-source normalization, or custom APIs for proprietary systems.
- Refresh cadence by audience: Executive: `daily` snapshot by 8am; Product/Marketing managers: `hourly` or `real-time` for campaign monitoring; Analysts: `near-real-time` raw feeds.
- Template for automated insights email: 1. Subject: `Daily Insights — [Product] — YYYY-MM-DD` 2. Lead metric delta: top 3 changes with % and `p-value`/confidence note 3. Root-cause hypothesis: one sentence 4. Actionable ask: owner + due date 5. Attachment: link to dashboard and query IDs
Sample RACI for dashboard tasks
- Responsible: Data Engineer for ETL; Analyst for KPIs; Product Manager for sign-off
- Accountable: Data Owner
- Consulted: Marketing/Finance SMEs
- Informed: Execs and downstream users
| Tool/Connector | Use Case | Ease of Setup | Cost Consideration |
|---|---|---|---|
| Native GA4 connector | Direct GA4 → Looker Studio | Very easy | Free |
| Looker Studio / Data Studio | Dashboards & sharing | Easy | Free |
| Fivetran | Managed ETL, schema sync | Easy-medium | Starts ~$120/mo |
| Stitch (Talend) | ETL for SaaS sources | Medium | Starts ~$100/mo |
| Supermetrics | Marketing connectors to sheets/BI | Very easy | Starts ~$39/mo |
| Zapier | Lightweight automation, alerts | Very easy | Free tier; paid $19.99+/mo |
| Make (Integromat) | Complex multi-step automations | Medium | Free tier; paid $9+/mo |
| Airbyte (cloud) | Open-source ETL with cloud plan | Medium | Cloud from ~$200/mo |
| Segment (Twilio) | Customer data routing & CDP | Medium | Starter tiers ~$120+/mo |
| Custom API integration | Proprietary systems, full control | Hard | Variable engineering cost |
Understanding these patterns lets teams design pipelines that deliver timely insights without adding brittle manual work. When automation and governance are aligned, reporting becomes a reliable utility rather than a project.
📥 Download: KPI Dashboard Checklist for Content Success (PDF)
Analyze, Interpret, and Act: Turning Dashboard Data into Strategy
Start by treating dashboards as a source of signals, not answers. Spot consistent deviations from expectations, then convert those signals into testable hypotheses that link user behavior to business outcomes. The following workflow turns raw metrics into prioritized experiments, compelling executive communication, and concrete roadmap changes.
- Impact: Estimated revenue/traffic uplift (high/medium/low).
- Effort: Hours or dev-sprint count.
- Confidence: Quality of supporting data.
- Reach: Percent of users/content affected.
Communicating results and proving impact requires precision and brevity. Create a one-page impact memo that answers: what was tested, why it mattered, the result with confidence bounds, and recommended next steps. Executives need a narrative and a few visuals — numbers first, narrative second.
Suggested visuals and KPIs
- Bold primary metric: Conversion lift (absolute and %).
- Bold supporting charts: Cohort trend, before/after funnel, and statistical significance table.
- Bold secondary metrics: Traffic, time on page, bounce rate, and revenue per visitor.
- A/B test on CTA wording → +18% click-through on target cohort, measured with 95% CI.
- Content refresh on core pillar → +22% organic sessions over 30 days, sustained after 60 days.
Provide checklists and templates so experiments move from insight to impact with minimal friction; this reduces debate and speeds decision-making. Understanding these principles helps teams move faster without sacrificing rigor.
| Resource | Purpose | How to Use | Template Link/Note |
|---|---|---|---|
| Experiment brief template | Define hypothesis, metrics, and timeline | Fill prior to dev/creative work; attach tracking plan | Notion/Google Docs experiment brief (copyable) |
| Impact memo template | One-page result narrative for execs | Use after experiment ends; include KPIs and CI | Google Slides one-page memo (slide + data appendix) |
| Stakeholder one-pager | Summarize changes for cross-functional teams | Share at standups and roadmap meetings | Confluence/Notion one-pager template (editable) |
| Report distribution checklist | Ensure results reach all owners and channels | Attach to final memo; list Slack channels, email, dashboards | Google Sheet checklist with distribution columns |
Conclusion
Bringing content metrics into a single, well-designed dashboard changes how teams plan and prove impact: it reduces guesswork, surfaces which topics and formats drive conversions, and speeds up iteration cycles. A mid-size B2B SaaS team that centralized traffic, pipeline, and engagement metrics cut reporting time in half and doubled experiment velocity; an e-commerce marketer who tied content to lifetime value found small format tweaks that lifted conversion rates. Read these patterns as practical moves: align KPIs to business outcomes, instrument content at the page and campaign level, and automate reporting so insights reach decision-makers fast.
– Align metrics with revenue or retention. – Tag content consistently to enable reliable attribution. – Automate dashboards to keep insights current.
Not sure where to begin or which metrics matter most for your funnel? Start by mapping one high-priority business goal to 2–3 content KPIs, run a 30-day test, and iterate based on what the data reveals. For professional assistance and ready-made workflows that accelerate setup, consider exploring automation and templates that plug into existing analytics stacks: Explore Scaleblogger dashboard automation and templates. This action will get a working dashboard in place quickly so teams can stop guessing and start optimizing.
