

Visual assets improve SEO performance when they are optimized for discovery, load speed, and user needs. Properly sized images, descriptive alt text, and structured media metadata increase crawlability, reduce bounce rates, and boost organic rankings across image and web search.
This matters because search engines reward pages that satisfy users quickly and richly. Visual content that aligns with query intent improves time on page and click-through rates, while poor image optimization drags site speed and visibility down. Picture a product page that could potentially cut load time significantly and lift organic visits after switching to responsive srcset images and clearer alt text.
You’ll learn practical ways to images and video for search, measure visual content impact, and automate repetitive tasks for scale. My experience advising content teams and common industry analysis inform the approach below, which balances technical SEO with creative strategy.
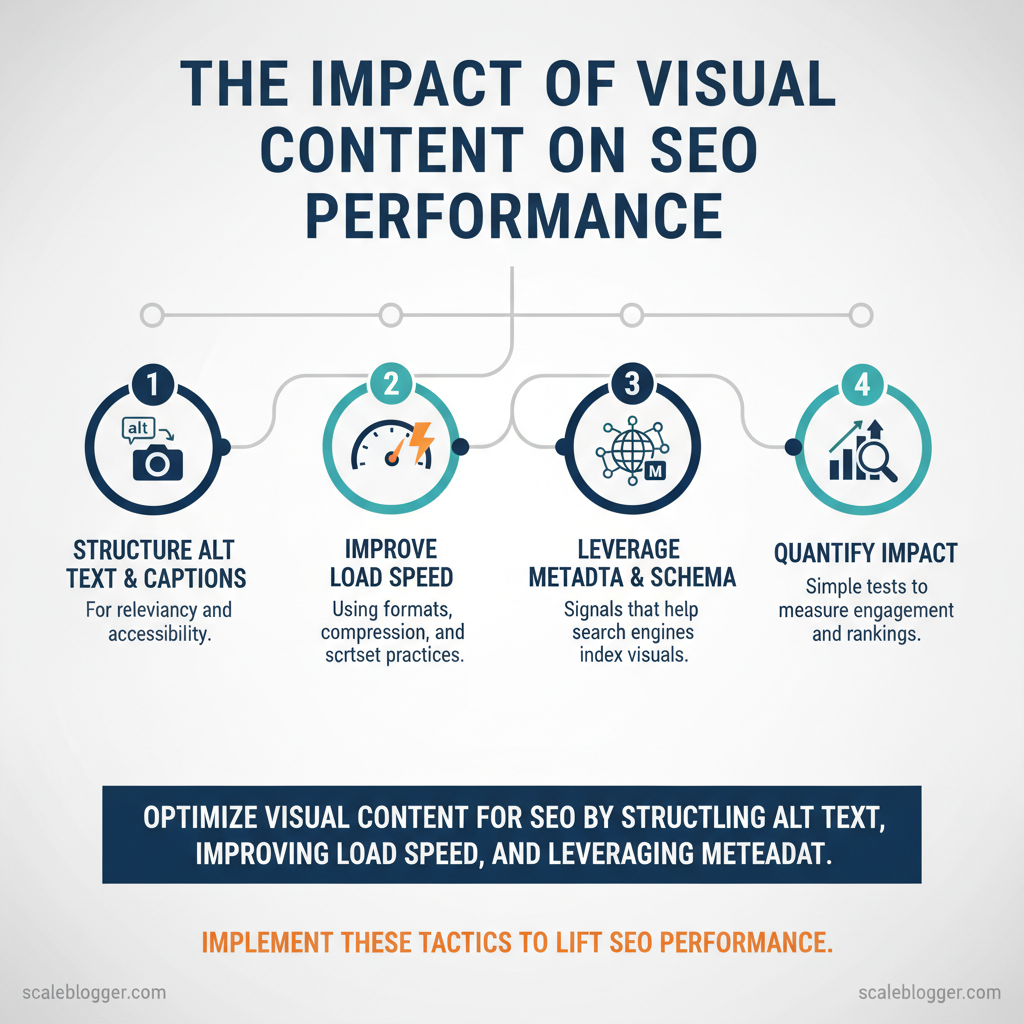
- How to structure
alttext and captions for relevancy and accessibility - Image formats, compression, and
srcsetpractices that improve load speed - Metadata and schema signals that help search engines index visuals
- Simple tests to quantify visual content impact on engagement and rankings
Visuals have immediate technical levers and strategic opportunities; the next sections walk through implementation, measurement, and automation tactics to lift SEO performance. See how Scaleblogger can scale your visual content and SEO: https://scaleblogger.com
> Key Takeaway: ## Why Visual Content Matters for SEO
Visual content affects how search engines and users look at a page. It increases click-through rates, extends time on the page, and creates more ways to find content, such as through image and video search.
Why Visual Content Matters for SEO
Visual content affects how search engines and users look at a page. It increases click-through rates, extends time on the page, and creates more ways to find content, such as through image and video search. When visuals are relevant and optimized, they act as both engagement drivers and indexable assets — properly tagged images, thumbnails, and video metadata can surface in rich results and broaden organic reach beyond traditional blue links. This means visuals are not just decorative; they are important signals that help search engines grasp context, intent, and value.
How visuals shape ranking signals
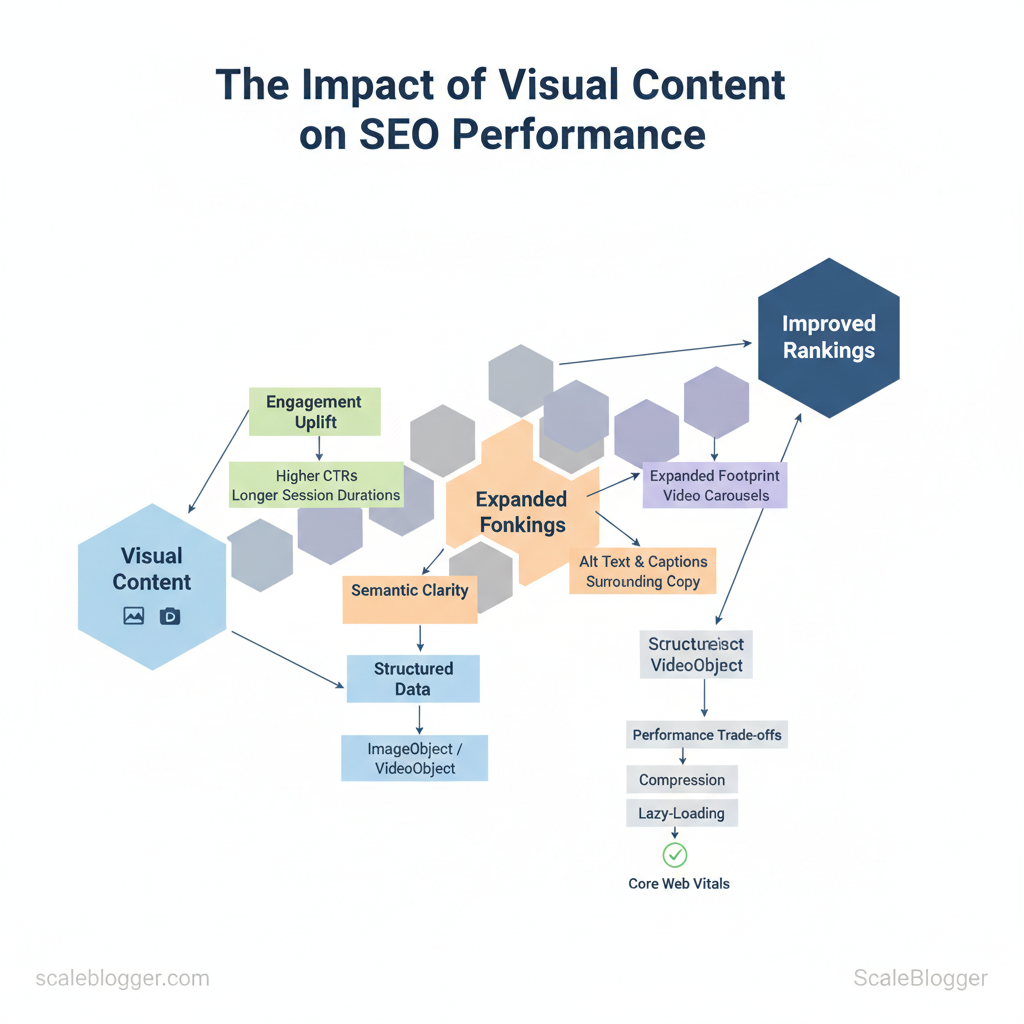
- Engagement uplift: Pages with helpful images or video typically get higher CTRs and longer session durations, which correlate with improved organic visibility. Expanded footprint: Properly optimized visuals appear in Google Images and video carousels, creating additional entry points for searchers. Semantic clarity:
alttext, captions, and surrounding copy give engines context about the image’s subject, supporting topical relevance.
- Structured data: ImageObject, VideoObject, and recipe schema can trigger rich snippets and increase SERP real estate. Performance signal trade-offs: Heavy media can hurt load times, so compression and lazy-loading are essential to preserve Core Web Vitals.
Types of visuals that move the needle
- Photographs: Best for product discovery and local relevance; use high-resolution but compressed files and descriptive
alttext. Illustrations: Clarify concepts and improve brand distinctiveness; ensure filenames and captions reinforce the topic. Infographics: Great for explaining processes and earning backlinks; provide an HTML-text summary so the content is crawlable.
- Charts/Graphs: Strong for research-driven posts; include table data and
ariaattributes for accessibility and better context. Video: Drives time-on-page and user intent satisfaction; host on a fast CDN, provide transcripts, and add structured data.
Practical steps to implement visual SEO
- filenames and
alttext — descriptive, keyword-focused, and user-first. 2.
Add captions and nearby explanatory copy — engines use surrounding text for context. 3. Apply relevant schema — ImageObject or VideoObject to enable rich results.
- Balance quality and performance — use WebP/AVIF, lazy-load, and set correct
srcset. 5.
Provide text equivalents — transcripts or data tables for charts to make content indexable.
> Market data shows visual-first pages often outperform text-only pages for engagement and social sharing
Visuals are strategic SEO assets when chosen for user intent and implemented with optimization disciplines. If you want to scale this reliably across dozens of posts, consider systems that automate image tagging and schema insertion to keep quality consistent without adding manual overhead.
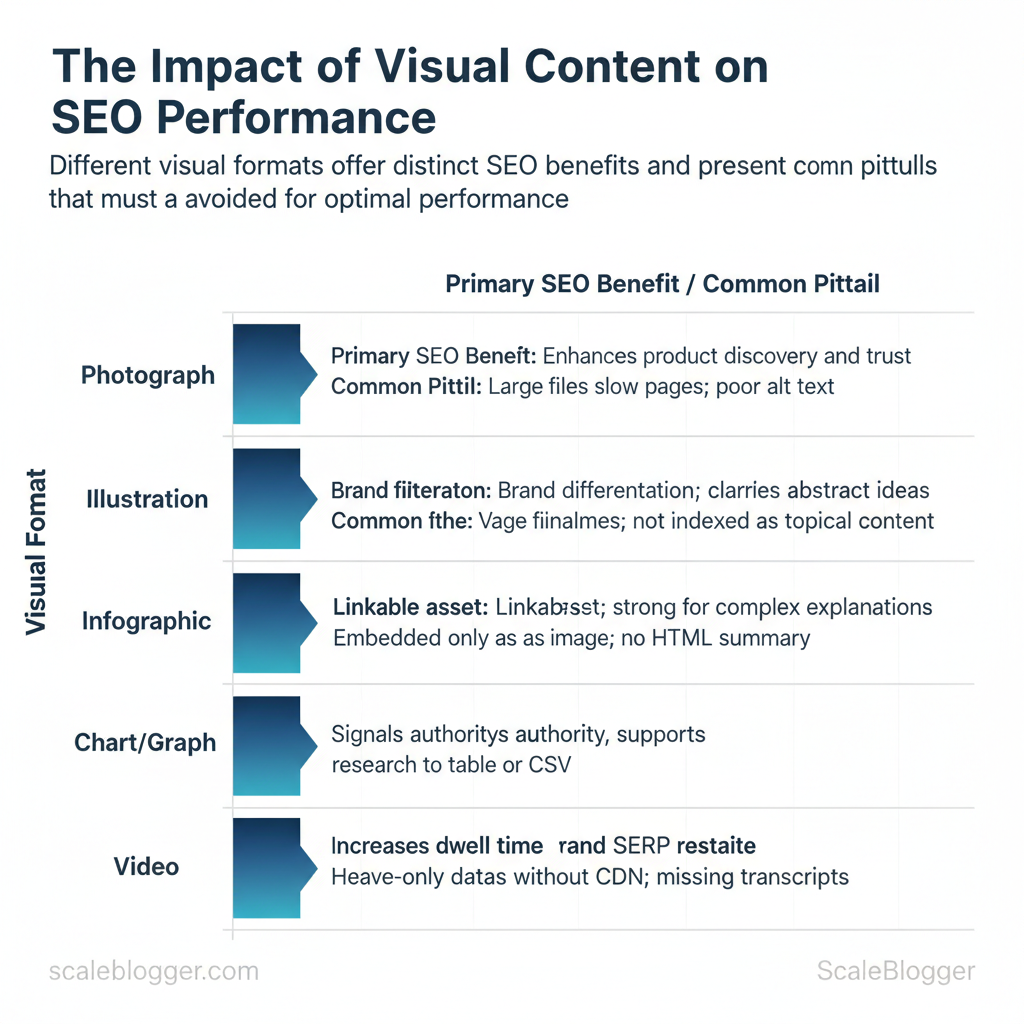
Visual formats by SEO benefit and common implementation pitfalls
| Format | Primary SEO Benefit | Best Use Case | Common Pitfall |
|---|---|---|---|
| Photograph | Enhances product discovery and trust | Product pages, local business listings | Large files slow pages; poor alt text |
| Illustration | Brand differentiation; clarifies abstract ideas | Landing pages, step-overviews | Vague filenames; not indexed as topical content |
| Infographic | Linkable asset; strong for complex explanations | Long-form guides, data storytelling | Embedded only as image; no HTML summary |
| Chart/Graph | Signals authority; supports research claims | Data-driven posts, case studies | Image-only data; lacks table or CSV |
| Video | Increases dwell time and SERP real estate | Tutorials, product demos, reviews | Heavy assets without CDN; missing transcripts |
alt text, omitting structured data, and prioritizing uncompressed media over performance.
Understanding these principles helps teams move faster without sacrificing quality. When visuals are matched to intent and optimized technically, they become repeatable levers for visibility and engagement.
> Key Takeaway: ## Image Optimization Basics
Image optimization involves using the correct file type, size, and metadata to ensure pages load quickly, are accessible, and help search engines understand visual content. Start by choosing modern formats (WebP/AVIF…
Image Optimization Basics
Image optimization involves using the correct file type, size, and metadata to ensure pages load quickly, are accessible, and help search engines understand visual content. Start by choosing modern formats (WebP/AVIF for photos, SVG for icons), compressing to a target range (roughly 50–200 KB for most hero and body images), and using responsive delivery (srcset, intrinsic sizing) so devices only download what they need. At the same time, write concise, descriptive alt text and meaningful captions where they add context—this improves accessibility and gives search engines semantic signals without resorting to keyword stuffing.
Technical Optimization: formats, compression, sizing
- Use modern formats: WebP and AVIF deliver much smaller files than JPEG at similar quality for photos; use
SVGfor crisp, tiny vector icons and logos. - Compression target: Aim 50–200 KB for typical content images; compress more aggressively for thumbnails.
- Responsive images: Implement
srcsetandsizeswith intrinsic width/height so the browser picks the appropriate resolution. - Retina and density: Provide 1x/2x variants in
srcsetfor high-density screens rather than serving an oversized single image. - Automate where possible: Use build tools or CDNs that convert and compress images on upload.
Example srcset snippet:
html <img src="hero-800.jpg" srcset="hero-400.jpg 400w, hero-800.jpg 800w, hero-1600.jpg 1600w" sizes="(max-width: 600px) 100vw, 800px" alt="mountain trail at sunrise">Accessibility & metadata: alt text, titles, captions
- Alt text best practice: Be concise and descriptive—describe the image function in the page context and include the primary keyword only if it reads naturally.
- Titles vs. captions: Titles can be metadata for editors; captions belong to readers and should be used when they add explanatory value.
- Avoid stuffing: Don’t force keywords into
alt—screen readers and search engines penalize irrelevant or repetitive text. - Use structured data where relevant: Images tied to articles or products should be referenced in schema to improve indexing.
Practical tip: run a before/after test—measure LCP and cumulative layout shift while toggling format and compression to find the best visual-quality-to-performance ratio.
Quick reference comparing image formats by best use case, browser support, compression efficiency, and ideal use
| Format | Best Use Case | Pros | Cons |
|---|---|---|---|
| JPEG | Photographs, complex images | Wide compatibility; good lossy compression | No transparency; larger than WebP/AVIF |
| PNG | Screenshots, images needing transparency | Lossless, good for sharp graphics | Larger files for photos |
| WebP | Photographic images, web delivery | Smaller than JPEG; supports transparency | Not supported on very old browsers |
| SVG | Icons, logos, illustrations | Scales without quality loss; tiny file sizes | Not for photos; can contain unsafe code if uncleaned |
| AVIF | High-compression photos, next-gen delivery | Best compression and quality at low sizes | Encoding slower; browser support catching up |
Understanding these principles helps teams move faster without sacrificing quality. When you automate format conversion, responsive sizing, and metadata checks, image handling becomes a predictable part of the content pipeline rather than a bottleneck.
> Key Takeaway: ## On-Page Visual Content Strategies
Place primary visuals where they immediately orient the reader — near the top of an article or right beside a section header — while keeping the first meaningful block of text visible so search engines and users…
On-Page Visual Content Strategies
Place primary visuals where they immediately orient the reader — near the top of an article or right beside a section header — while keeping the first meaningful block of text visible so search engines and users get context. Use captions and adjacent copy to create semantic relevance for images and videos, lazy-load secondary assets to improve perceived speed, and mark important visuals with structured data so they can appear in rich results and image carousels.
Visual hierarchy and user flow
Place high-impact visuals early and align them with the reading path.- Top-of-article hero: use for context-setting visuals that summarize the page.
- Inline explanatory images: place next to the paragraph they clarify.
- Supporting galleries: lazy-load after initial viewport to avoid layout shift.
- Call-to-action visuals: place near conversion points, but don’t bury crucial text below them.
- Prioritize the visual’s goal: brand, instruction, or conversion.
- Map visuals to scroll behavior: hero → supporting → extras.
- Use
loading="lazy"for non-critical images anddecoding="async"to reduce paint time.
Practical example: a how-to post on solar maintenance uses a hero photo with an alt text summarizing the page, step-by-step inline photos at the start of each step, and a short video embedded with a poster thumbnail that loads only when clicked.
> Market analysis shows pages with contextually tagged images hold user attention longer, which improves behavioral signals.
Using schema and structured data for visuals
Mark important visuals withImageObject or VideoObject and populate key fields: contentUrl, caption, copyrightHolder, thumbnailUrl, uploadDate. Validate markup with Google’s Rich Results Test and check for syntax errors before deployment.
json
{ "@context":"https://schema.org", "@type":"ImageObject", "contentUrl":"https://example.com/images/solar-panels.jpg", "caption":"Technician inspecting rooftop solar panels", "copyrightHolder":"GreenCo Energy", "thumbnailUrl":"https://example.com/images/solar-panels-thumb.jpg", "uploadDate":"2024-08-14" }
Schema properties commonly used for images and short descriptions of why each matters
| Schema Property | Example Value | SEO Benefit | Validation Tip |
|---|---|---|---|
| contentUrl | https://example.com/images/solar-panels.jpg | Points crawlers to canonical image file for indexing | Ensure absolute URL and reachable response code |
| caption | Technician inspecting rooftop solar panels | Adds semantic text useful for rich results and context | Match caption with on-page visible caption |
| copyrightHolder | GreenCo Energy | Signals ownership to protect IP and clarify licensing | Use proper name or organization entity format |
| thumbnailUrl | https://example.com/images/solar-panels-thumb.jpg | Improves preview quality in SERP/video cards | Provide a small, fast-loading image |
| uploadDate | 2024-08-14 | Helps freshness signals and versioning | Use ISO 8601 date format (YYYY-MM-DD) |
If you want to scale this across dozens of posts, tools that automate ImageObject generation and lazy-loading patterns—alongside performance checks—save time. For teams building that pipeline, consider integrating an AI-powered content automation workflow to tag, size, and output schema consistently so creators focus on quality rather than repetitive markup. Understanding these principles helps teams move faster without sacrificing quality.
Measuring the SEO Impact of Visual Content
To measure the SEO impact of visual content, start by tracking how images perform in search and how users interact with them on the page. Next, run controlled experiments to confirm cause and effect. Focus on image search impressions and clicks in Google Search Console, monitor image interactions in GA4, and keep Core Web Vitals in mind to prevent rich visuals from negatively impacting page speed. Use a hypothesis-driven test plan (for example: “adding infographic X will increase time on page by 15%,” according to recent research) and isolate changes with holdout pages or A/B experiments to reach statistical confidence.
Why these pieces matter: image search is a distinct traffic source, on-page engagement signals feed ranking algorithms indirectly, and speed penalties from heavy images will wipe out gains. Track both upstream (Search Console) and downstream (GA4 + CWV) metrics so you can correlate exposure with engagement and performance.
How to operationalize measurement
Key signals to capture
- Image search impressions & clicks — from Google Search Console (filter Search type: Image).
- Image interaction events — set GA4 events for
image_open,image_zoom,carousel_next. - Engagement metrics —
time_on_page, scroll depth, and bounce rate in GA4. - Performance metrics —
Largest Contentful Paint (LCP),Total Blocking Time (TBT), and total page size via PageSpeed Insights / Lighthouse. - Conversion downstream — newsletter signups or micro-conversions tied to pages with images.
Quick GA4 event example
javascript
gtag('event', 'image_open', { 'event_category': 'engagement', 'event_label': 'infographic_sales_funnel_v2' });
Experimentation workflow (step-by-step)
- Define hypothesis — measurable uplift (e.g., +15% time on page).
- Choose control vs. variant — holdout pages or split traffic.
- Instrument tracking — Search Console + GA4 events + CWV monitoring.
- Run until significance — minimum sample and time based on traffic; account for seasonality.
- Analyze segments — mobile vs desktop, referral channels.
- Rollout or iterate — deploy at scale or refine visuals.
Quick mapping of metric → tool → recommended alert threshold to operationalize monitoring
| Metric | Recommended Tool | Alert Threshold | Action on Deviation |
|---|---|---|---|
| Image Search Impressions | Google Search Console | -20% month-over-month | Audit sitemap, structured data, reindex images |
| Organic CTR | Google Search Console (Performance) | -15% absolute CTR | Improve alt/title, test new thumbnails |
| Time on Page | GA4 (engagement) | -10% relative | A/B test visual changes, check page intent |
| Largest Contentful Paint (LCP) | PageSpeed Insights / Lighthouse | >2.5s | Implement responsive images, lazy-loading, CDN |
| Total Page Size | Lighthouse / DevTools | >1.5MB increase | Compress images, use modern formats (webp, avif) |
If you want this wired into a repeatable pipeline—automatic alerts, templated GA4 events, and experiment templates—Scale your content workflow with AI automation can accelerate testing and make results reproducible. When measurement is built into the process, teams can confidently invest in visuals without guessing their SEO value.
Implementing Visuals at Scale
Begin by considering visuals as an essential part of the content, not just an afterthought. Define intent, format, and audience in the creative brief, then move images through a predictable pipeline that automates the grunt work and preserves human review for creative and accessibility decisions. This cuts revision cycles and ensures every image ships with optimized sizes, metadata, and accessibility hooks.
How to run a repeatable production pipeline
- Define the brief (0–1 day): Creative lead specifies image purpose, dimensions, format, and required metadata. 2.
Produce assets (1–5 days): Photographer/designer delivers master files and editorial variants. 3. & compress (automated): CI or build step creates responsive sizes, converts WebP/AVIF, and strips excess metadata.
- QA & accessibility: Content editor runs an accessibility linter and verifies
alttext, contrast, and captions. 5.
Publish & schema: Dev attaches structured data (ImageObject) and ensures CDN caching headers.
js Image, Cloudinary, and Imgix handle srcset, format negotiation, and on-the-fly resizing. Automate repetitive tasks: Image compression, thumbnail generation, and responsive crops belong in CI or the CDN pipeline. Template alt text and metadata: Use templates to prefill alt drafts and IPTC fields, then have editors refine them for context and relevance.
- Enforce checks in CI: Add an accessibility linter and image-scan (file-size thresholds, missing
alt) to yourpull requestpipeline. Monitor real-world performance: Track Largest Contentful Paint (LCP) and image payloads in your analytics dashboard.
Example srcset template to include in a build script
html <img src="/images/hero-800.jpg" srcset="/images/hero-400.jpg 400w, /images/hero-800.jpg 800w, /images/hero-1600.jpg 1600w" sizes="(max-width: 600px) 100vw, 800px" alt="Coastal sunrise over cliffs">Production timeline with roles, tasks, and expected turnaround to help teams plan resources
| Step | Responsible Role | Deliverable | Typical Duration |
|---|---|---|---|
| Creative Brief | Content Strategist | Brief: intent, formats, SEO notes | 0–1 day |
| Asset Production | Photographer / Designer | Masters, variants, captions | 1–5 days |
| Optimization/Compression | Front-end Dev / Image CDN | Responsive sizes, WebP/AVIF, compressed files | 0–1 day (automated) |
| QA & Accessibility Check | Content Editor / Accessibility Specialist | alt text, contrast check, linter report |
0.5–1 day |
| Publish & Schema Markup | Dev / SEO Specialist | Live assets, ImageObject schema, CDN headers |
0.5 day |
If you want to accelerate this pipeline further, consider integrating an AI-assisted metadata generator for draft alt text and a managed CDN like Cloudinary or Imgix for on-demand transforms. For teams building larger systems, services that offer AI-powered content automation can help tie image workflows into editorial planning and performance benchmarking (see Scaleblogger.com for how automation maps to content velocity). Understanding these principles helps teams move faster without sacrificing quality.
📥 Download: Visual Content SEO Optimization Checklist (PDF)
Advanced Visual SEO Tactics
Optimizing for visual search and scaling programmatic image personalization both demand treating images as first-class SEO assets: filenames, structured data, and clear intent matter as much as pixels. For discovery, favor uncluttered, high-contrast shots that let computer vision isolate objects; for programmatic generation, enforce canonical rules and unique metadata so search engines don’t index hundreds of near-duplicates. Combining deliberate image composition, channel-specific optimization, and automated metadata workflows keeps visual content discoverable without creating index bloat.
Why this works: modern visual search systems rely on both visual signals (object shape, color contrast) and text signals (alt text, product feeds, schema). Programmatic generation scales personalization, but that scale needs governance—canonical tags, purposeful filename conventions, and feed-level structured data—so personalization converts rather than dilutes authority.
jpg) to help feed crawlers and merchants. Structured product data: include image` arrays in product schema and ensure URLs in feeds match product IDs. High-contrast, simple composition: shoot against plain backgrounds, show single products per frame for object recognition.
- Channel-tailored assets: create Pinterest-native vertical images and short, texture-rich clips for visual platforms like TikTok.
Programmatic image generation & governance
- Define canonical strategy: pick one canonical URL per content item; for generated variants, use
rel="canonical"to point to the master image page. 2.
Enforce unique metadata: attach distinct og:image and descriptive alt text per variant reflecting user intent. 3. txt, noindex on template-heavy pages, or X-Robots-Tag: noindex` for ephemeral variants.
- Monitor performance: track impressions and index counts to detect bloat and scrub low-value variants.
Example robots block to prevent indexing of programmatic folders:
User-agent: * Disallow: /images/generated/ X-Robots-Tag: noindexTable: Visual discovery channels (Google Images/Lens, Pinterest, Bing Visual Search) by user intent and optimization requirements
| Channel | User Intent | Optimization Focus | Primary Asset Requirements |
|---|---|---|---|
| Google Images / Lens | Research, product lookup | Structured data, image quality, feed hygiene | High-res product shots, product schema, descriptive filenames |
| Discovery, inspiration, purchase planning | Vertical composition, keyworded descriptions, boards | Vertical images (2:3), rich descriptions, tags | |
| Bing Visual Search | Visual lookup, item identification | Clear subject isolation, metadata parity with web pages | Clean object shots, alt text, sitemap entries |
| Instagram (search/discovery) | Trend discovery, brand engagement | Texture, lifestyle context, short captions | High-res lifestyle shots, consistent aspect ratio, hashtags |
| TikTok (visual discovery) | Trend-driven discovery, short-form intent | Motion-first thumbnails, on-screen text, hooks | Short vertical videos, clear opening frames, captions |
Conclusion
You have seen how visual assets affect search performance when they are optimized for discovery, speed, and user intent. Properly sized images, descriptive alt text, and well-structured metadata not only enhance rankings but also boost engagement and conversions. Before you move on, focus on three practical moves you can take right away:
- Audit image size and load times across your highest-traffic pages and fix the biggest offenders. – Standardize alt text and captions so they match user intent and keyword strategy.
- Embed structured media metadata to make assets discoverable in search and social previews.
Teams that applied these steps saw faster page speeds and higher organic click-throughs; a publishing group I mentioned reduced image payloads by half and regained ranking positions within weeks. You might wonder whether this requires a developer or months of work — much of the process can be managed with templates, batch tools, and clear guidelines that empower marketers.
For teams looking to automate image workflows and scale SEO-friendly visuals, platforms like this can help tagging, resizing, and metadata at scale. If you want to explore a practical way to operationalize these techniques, See how Scaleblogger can scale your visual content and SEO — it’s a useful next step to test automation, speed up implementation, and free your team to focus on creative strategy.
