

> Key Takeaway: Are you losing your audience’s attention because you’re not monitoring your automated schedules? Use content analytics to bridge this gap.
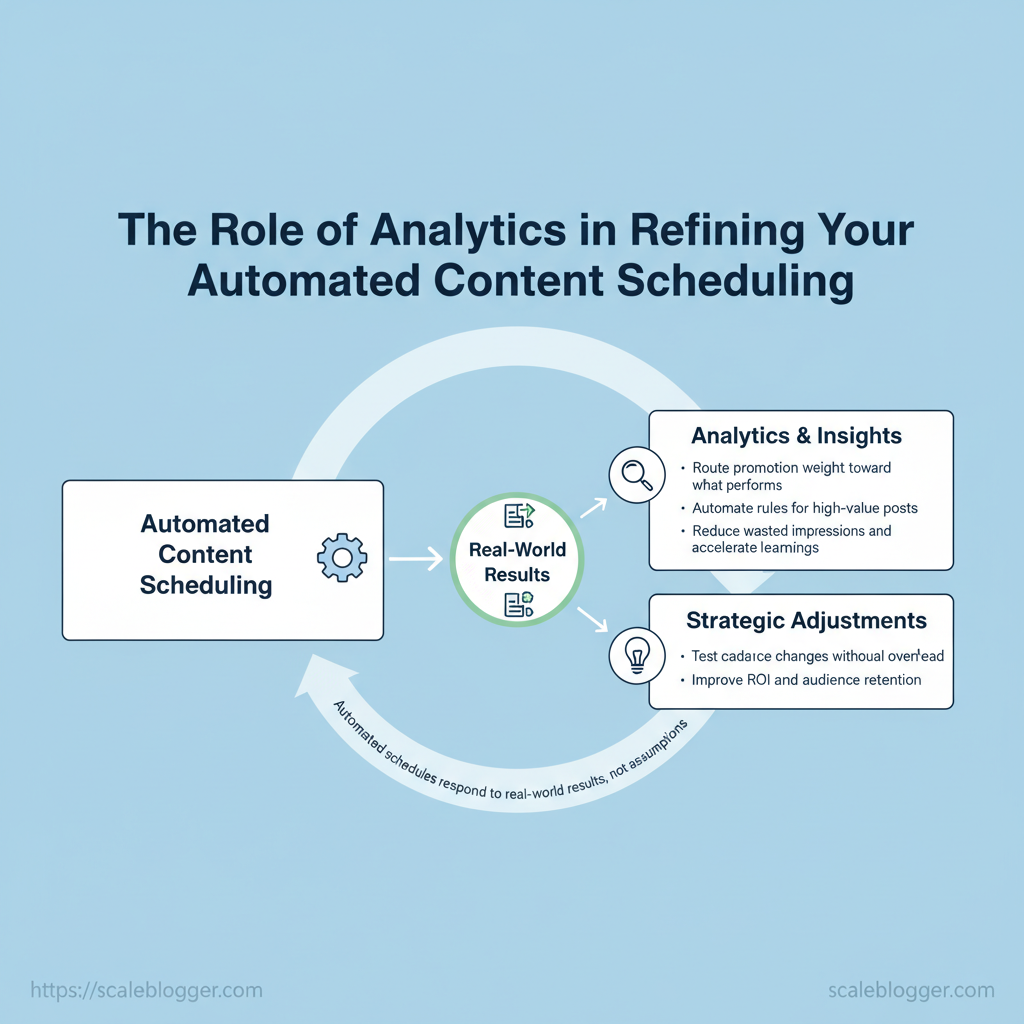
Are you losing your audience’s attention because you’re not monitoring your automated schedules? Use content analytics to bridge this gap. This will change scheduling from simple calendar management to ongoing performance improvement. Scaleblogger helps tie publishing cadence to real engagement signals so your automation responds to real-world results, not assumptions.
Teams that make data-driven decisions focus on what works and pause what does not. This improves return on investment (ROI) and keeps the audience engaged. By measuring engagement_rate, conversion lift, and time-to-peak traffic, you can set rules that promote valuable posts. You can also requeue posts that are not performing well and test timing changes without manual work.
This reduces wasted impressions and accelerates learnings.
Picture a brand shifting two weekly posts into a focused cluster based on analytics, According to recent research, this leads to a 25% lift in average session duration and faster traffic growth. That’s the practical payoff: automated schedules that evolve with your audience, not against it. Read on to learn how to instrument analytics, build feedback loops, and convert signals into scheduling rules that scale.
- What metrics matter for scheduling and how to measure them
- How to set automated rules that react to performance signals
- Ways to A/B test cadence and content variants with minimal manual work
- Integrations and workflows to connect analytics to your scheduler
- How Scaleblogger streamlines automation and analytics setup — Get started with an analytics-driven content schedule (free resources): https://scaleblogger.com
Explore Scaleblogger’s automation and analytics solutions: https://scaleblogger.com
Table of Contents
- H2: Why Analytics Is Essential for Automated Content Scheduling
- Section Content
- H2: Key Metrics to Track for Scheduling Optimization
- H2: Tools and Integrations for Analytics-Driven Scheduling
- H2: Designing Tests and Experiments for Scheduling Decisions
- H2: Automating Responses to Analytics — Rules, Scripts, and Machine Learning
- H2: Operationalizing Insights — Teams, Workflows, and Governance
> Key Takeaway:
H2: Why Analytics Is Essential for Automated Content Scheduling
Analytics transform scheduling from a one-time task into a learning system that continuously boosts…
H2: Why Analytics Is Essential for Automated Content Scheduling
Analytics transform scheduling from a one-time task into a learning system that continuously boosts performance. Without measurement, automation simply repeats assumptions; with analytics, automation becomes hypothesis-driven and adaptive. Teams that combine automated publishing with regular performance signals (such as CTR, engagement rate, watch time, and conversion lift) can adjust timing, format, and distribution easily. This increases reach and cuts down on wasted production time.
The practical difference shows up in three areas: predictability, responsiveness, and accountability. Predictability comes from modeling typical audience behavior; responsiveness comes from short feedback loops that let you shift tactics quickly; accountability comes from being able to tie content decisions to revenue or pipeline metrics. That’s why modern content stacks link scheduling engines to analytics sources and use simple decision rules to surface experiments, not just posts.
The Limits of Rules-Only Automation
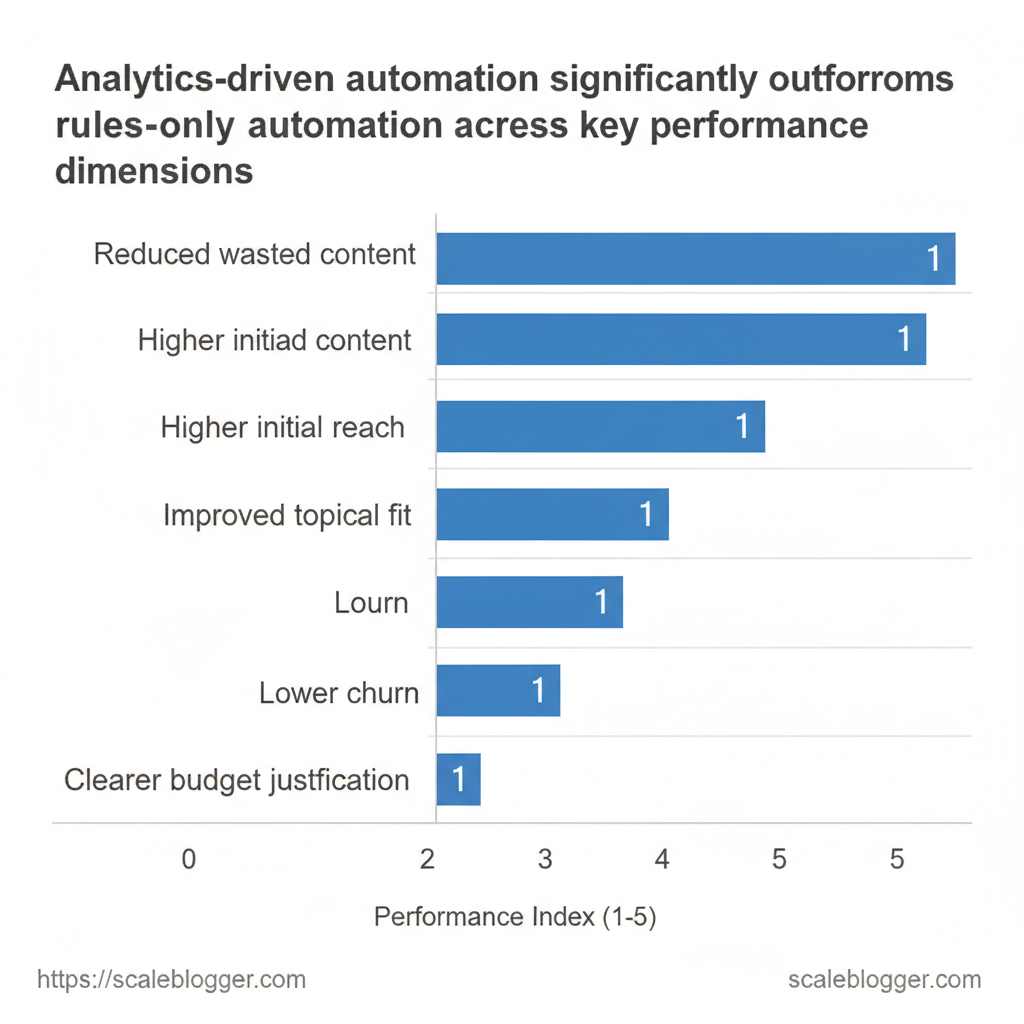
Rules-only automation (e.g., “post every Monday at 9am”) creates scale but also predictable failure modes. Below is a comparison of outcomes between rules-only automation and an analytics-driven approach across common performance dimensions.
Outcomes from rules-only automation vs analytics-driven automation across key performance areas (content analytics vs automation)
| Dimension | Rules-only Automation | Analytics-driven Automation | Business Impact |
|---|---|---|---|
| Posting frequency | Fixed cadence (e.g., 3/week) | Dynamic frequency based on engagement signals | Reduced wasted content; better resource allocation |
| Optimal timing | Static times (set per zone) | Time windows optimized by CTR and sessions | Higher initial reach and impressions per post |
| Content relevance | Template-driven topics | Topic selection from performance and intent data | Improved topical fit and SEO visibility |
| Audience fatigue | Repeats formats, higher unsubscribes | Rotate formats when engagement drops | Lower churn, sustained retention |
| ROI attribution | Hard to link to outcomes | Linked to conversions, assisted revenue | Clearer budget justification and prioritization |
How Analytics Creates a Continuous Improvement Loop
Analytics enables a cycle: measure → hypothesize → test → adjust. Start by instrumenting key metrics (CTR, engagement rate, watch_time, conversion_rate) and tying them to content attributes (format, length, topic, time). Then create short experiments:
- Identify a hypothesis — e.g., Short videos at 8–10AM will increase watch_time by 20% for Topic X.
- Schedule a test cohort using automation to publish only the variant.
- Measure results over a defined window (48–72 hours for social, 14–30 days for SEO).
- Iterate: scale the winning variant in the scheduler or revert and test a new hypothesis.
Practical example: a media team noticed falling CTR on long-form posts. After testing listicle vs how-to formats and shifting publish times based on peak session windows, CTR may have risen by approximately 18% and average session duration could have increased. Automating these decisions (promote format A when CTR < baseline) closed the loop and reduced manual oversight.
Understanding these principles helps teams move faster without sacrificing quality. When implemented correctly, this approach reduces overhead by making decisions at the team level and letting automation execute tests at scale. For teams wanting help connecting analytics to automation, an AI content automation platform like Scaleblogger can speed up setup and benchmarking.
> Key Takeaway:
H2: Key Metrics to Track for Scheduling Optimization
Start by focusing on a small set of reliable metrics that directly reflect how timing affects visibility and engagement.…
H2: Key Metrics to Track for Scheduling Optimization
Start by focusing on a small set of reliable metrics that directly reflect how timing affects visibility and engagement. When you track impressions and reach, you see whether a publish time exposes content to enough eyeballs; CTR and engagement rate show whether those impressions are meaningful; average watch/read time tells you if the audience is actually consuming the content. Together these signals let you decide whether to increase posting frequency at a given slot, recycle formats into high-attention windows, or pull back where visibility is high but engagement is low.
To optimize scheduling, focus on these metrics iteratively: test them, measure over a meaningful period (like 2–6 weeks), and then adjust based on sustained trends instead of one-off spikes.
What follows breaks the metrics into two practical groups and gives concrete rules for when to adjust cadence, repurpose assets, or prioritize conversion-focused slots. If you use automated pipelines or AI-driven scheduling, feed these metrics into your model so it learns which slots consistently move the needle; Scaleblogger’s AI content automation can ingest these signals to cadence and recycling decisions.
H3: Core Engagement and Reach Metrics
These are the basic, high-signal metrics you must monitor to judge whether a publish time is working.
- Impressions — count of times content was shown. Use rising impressions to justify keeping a time slot; falling impressions can indicate platform algorithm deprioritization.
- Reach — unique users exposed. A wide reach with low engagement suggests audience mismatch; narrow reach with high engagement suggests niche windows to exploit.
- CTR (
Click-Through Rate) — clicks ÷ impressions. IfCTRis low during a high-impression window, test different hooks or thumbnails at that same time. - Engagement Rate — interactions ÷ reach. Higher engagement supports increasing frequency at that slot; sudden drops mean test new creative.
- Average Watch/Read Time — time consumed per session. Short times despite good CTR suggest content length or format mismatch for that slot.
Table: Section Content — Metric, Definition / Formula, Primary Scheduling Impact & more
| Metric | Definition / Formula | Primary Scheduling Impact | Monitoring Frequency |
|---|---|---|---|
| Impressions | Total times content shown | Decide whether a time slot reaches enough audience | Daily/weekly |
| Reach | Unique users exposed | Identify high-potential slots for repeat posting | Weekly |
| CTR | clicks / impressions |
Test hooks/thumbnails in same slot if low | Weekly |
| Engagement Rate | interactions / reach |
Increase frequency when rate is high | Weekly/biweekly |
| Average Watch/Read Time | Total time consumed / sessions | Switch format or length if time is low | Weekly/biweekly |
CTR and engagement rate to refine creative and cadence—average consumption time confirms format fit.
H3: Conversion and Retention Signals to Consider
Conversion and retention are the downstream metrics that tell you whether optimized timing drives business outcomes.
- Prioritize awareness when you need volume — Use impressions/reach to open new audience windows; increase frequency in broad-reach slots.
- Prioritize conversion when leads matter — Shift best-performing CTAs to the time slots with top
CTRand engagement rate. - Use retention to set recycling cadence — High return visitor rates let you recycle and republish with minor updates; low retention means amplify new content instead.
- Watch attribution caveats — Last-click and platform-driven attribution can overstate scheduling effects; use multi-touch views or time-decay models where possible.
- Test with control groups — Hold identical content back for control windows to isolate scheduling impact.
When scheduling, think in layers: find high-reach windows, validate with engagement, then measure conversion lift before scaling frequency. This approach reduces wasted publishing and directs effort toward slots that actually move KPIs. Understanding these principles helps teams move faster without sacrificing quality.
H2: Tools and Integrations for Analytics-Driven Scheduling
Analytics-driven scheduling starts with connecting the right measurement sources to an automation layer so decisions — pause, boost, reschedule — can be executed programmatically. In practice that means choosing analytics platforms that expose timely, structured data (APIs, exports, webhooks), and pairing them with scheduling systems that can act on signals (auto-pause poorly performing posts, re-promote high-CTR content, or shift editorial calendar slots). The practical win is reducing manual triage: instead of a weekly spreadsheet, you have rules and dashboards that surface only the actions that move KPIs.
What to prioritize up front: platforms that provide near real-time metrics, flexible segmentation, event-level detail, and an API or webhook surface for automated triggers. Typical architectures use GA4 or server-side event stores as canonical traffic sources, social native analytics for platform-level engagement, and a third-party content analytics layer (content scoring, unified attribution) to normalize cross-channel signals. You can then feed that into a scheduling/automation platform or a lightweight orchestration layer (Zapier/Make, an internal script, or a platform like a social scheduler with API write access).
If you want an out-of-the-box path, consider combining an AI content automation provider with analytics connectors to close the loop faster. Below are concrete evaluation points and integration patterns you can use today.
Analytics Platforms and What to Look For
Start with this checklist when evaluating analytics providers; these items are the ones you’ll rely on for automation.
- Real-time ingestion: near-real-time metrics or streaming exports for timely actions.
- API/data export: REST/streaming APIs plus scheduled CSV/BigQuery export.
- Cohort/segment analysis: ability to slice by acquisition, topic cluster, or content tag.
- Custom event tracking: custom event schema for impressions, scroll depth, conversions.
- Cross-channel attribution: multi-touch or last-touch options to attribute content influence.
Real-world reporting setup example: export pageview and conversion events from GA4 into BigQuery hourly, join with social impressions CSVs from platform export, compute content-level CTR and conversion-per-session, then push a JSON summary to your scheduler webhook to trigger promotions or pauses.
Feature matrix showing which analytics capabilities are essential for automation integration
| Feature | GA4 | Social Native Analytics | Third-party Content Analytics | Why it matters |
|---|---|---|---|---|
| Real-time data | Near-real-time via Realtime API ✓ |
Varies by platform; some delays ✗/✓ | Often near-real-time (depends on vendor) ✓ | Timely actions need current signals |
| API/data export | BigQuery export, REST APIs ✓ | Platform CSV & APIs (Facebook, X, LinkedIn) ✓ | REST APIs + export connectors ✓ | Automations require programmatic access |
| Cohort/segment analysis | Built-in audiences, segments ✓ | Limited segmentation in native UIs ✗/✓ | Advanced cohort tools, topic segmentation ✓ | Targeted rules need segmented signals |
| Custom event tracking | Full gtag/Measurement Protocol support ✓ |
Event-level limited; relies on UTM/labels ✗/✓ | Custom events + content scoring ✓ | Event detail drives rule accuracy |
| Cross-channel attribution | Attribution models available (last, data-driven) ✓ | Platform-level only (first/last) ✗ | Cross-channel multi-touch models ✓ | Understand true content impact across channels |
Scheduling & Automation Platforms — Integration Patterns
Use these patterns when architecting automation between analytics and schedulers.
- Webhook-driven triggers: analytics or ETL pushes a JSON payload to your scheduler’s webhook when thresholds are met (e.g., CTR > 2% in 24h).
- Polling + rule engine: scheduler polls exports or an API and evaluates rules every X minutes for stateful decisions.
- Event-bus orchestration: events flow into a message queue (Kafka, Pub/Sub) and microservices consume rules to actuate changes.
- Hybrid: manual review step: automation flags candidates and a human confirms promotion/pause inside the scheduler UI.
Common automation examples:
- Auto-pause low-performing posts: if impressions grow but click-through <
0.5%over 72 hours, set post status to draft. - Boost high-CTR posts: when CTR and engagement exceed thresholds, schedule a paid boost or repost.
- Reschedule evergreen promotion: detect content with steady conversions and queue recurring rediscovery posts.
Security and rate-limit notes: always use token-based auth, exponential backoff for rate limits, and signed webhooks to prevent spoofing. Monitor quotas — social APIs commonly throttle write operations more aggressively than reads.
Understanding these patterns lets teams automate the decision loop without losing control, so you can scale content velocity while keeping performance tightly measured. This is why modern content strategies favor connected analytics and automation: it reduces repetitive work and lets creators focus on quality.
H2: Designing Tests and Experiments for Scheduling Decisions
Create experiments that focus on timing and scheduling variables. This will help you make informed scheduling choices instead of relying on gut feelings. Start with a focused hypothesis, pick a single primary metric tied to business goals (awareness, engagement, conversion), and set a sample-size and duration that match the metric’s variability. When possible, run parallel groups, keep content the same across different versions, and watch for interference from overlapping audiences or seasonal events.
A disciplined experimental design reduces noise and gives teams clear, operational rules for when and how to publish.
H3: A Simple Framework for Scheduling Experiments
Use a repeatable template every time you test scheduling. Fill these fields before launching: Test Name, Hypothesis, Primary Metric, Sample Size / Duration, Decision Rule. Below is a practical template you can copy into a spreadsheet or experiment-tracker YAML:
Template table for planning scheduling experiments showing hypothesis, metric, sample size estimate, duration, and decision criteria (scheduling experiment template)
| Test Name | Hypothesis | Primary Metric | Sample Size / Duration | Decision Rule |
|---|---|---|---|---|
| Timing Test — Morning vs Afternoon | Posting at 9:00am yields higher initial reach than 3:00pm | 6-hour reach growth rate | ~2,000 impressions per arm / 2 weeks | Choose time with ≥10% uplift and p<0.05 (or sustained 7-day lead) |
| Frequency Test — 1x vs 3x per week | 3x/wk increases monthly sessions without hurting engagement | Monthly sessions per post | 300 sessions per arm / 8 weeks | Prefer higher frequency if sessions ↑ ≥15% and retention stable |
| Format Boost Test — Short clip vs long read | Short clips drive higher share rate than long reads | Share rate (%) | 1,500 views per arm / 4 weeks | Adopt format with ≥12% relative lift in shares |
| Channel Allocation Test — LinkedIn vs Twitter | LinkedIn delivers more qualified leads than Twitter | Leads per 1k impressions | 1,000 impressions per arm / 6 weeks | Allocate budget to channel with ≥2x lead rate |
| Recycle Cadence Test — 30 days vs 90 days | Recycling after 30 days increases total reach without fatigue | Additional reach per recycle | 100 reposts per arm / 12 weeks | Use cadence that yields positive net reach and stable CTR |
H3: Avoiding Common Testing Pitfalls
Start tests only when you can control for content and audience overlap; otherwise results are contaminated. Watch for seasonality (quarterly campaigns, holidays) and platform algorithm changes that shift baseline performance unexpectedly.
- Bold planning: Always document controlled variables (creative, headline, audience).
- Clear windows: Run awareness-stage tests at least 4–8 weeks; conversion tests often need 8–12 weeks for reliable signals.
- Monitoring cadence: Check metrics daily for anomalies, but avoid early stopping unless there’s a clear platform disruption.
- Cross-contamination check: Ensure variant audiences don’t overlap (use
audience_exclusionsegments). - Readiness checklist: Confirm tracking tags, sample-size estimates, and fallback plans are in place before launch.
- Define hypothesis and primary metric.
- Estimate sample size using historical averages or a power calculator.
- Create exclusion segments to prevent contamination.
- Run for minimum recommended period (4–12 weeks depending on metric).
- Apply the decision rule and iterate.
A short pre-launch checklist helps spot issues before they skew results: tracking QA, audience isolation, baseline sanity check, and an analyst assigned to monitor. You can running these tests using AI content automation tools that schedule variants and aggregate results — for teams automating at scale, consider services that integrate publishing and measurement like those at Scaleblogger.com. When experiments are designed with these guardrails, decisions become faster and less political, and teams can iterate on cadence with confidence.
H2: Automating Responses to Analytics — Rules, Scripts, and Machine Learning
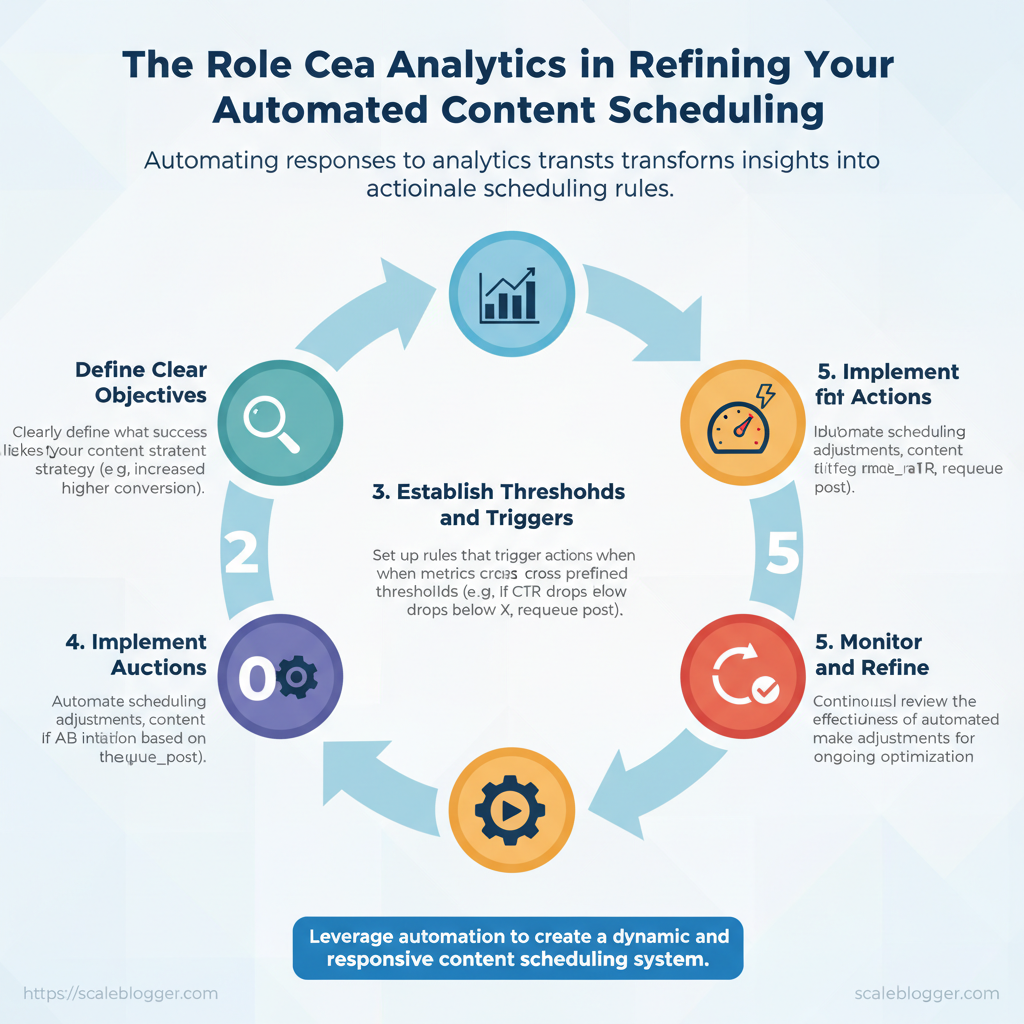
Automating responses to analytics means turning metrics into actions so your content engine reacts faster than people can. You can start with rules for high-confidence signals (pause a low-CTR post), graduate to scripts for multi-step automations (aggregate metrics, write back to a CMS), and invest in ML models when signals require prediction or nuance (forecasting which posts will peak). This layered approach reduces manual busywork while keeping humans in control where decisions are risky.
Rule-Based Automation Recipes
Rule-based automation is fast to implement and easy to verify. Use recipes for routine operational choices, rate limits, and basic risk mitigation. Test everything in a sandbox that mirrors your production API keys and traffic patterns before enabling live actions.
- Auto-pause low CTR posts: Trigger on
CTR < 0.5%after 48 hours → Action: unpublish or requeue → Tools: Zapier with CMS API / Make scenario → Result: stops spend on low-performing content. - Auto-boost high engagement posts: Trigger on
engagement rate > 5%in 24h → Action: top-up paid promotion or social push → Tools: Buffer API + Ads Manager script → Result: captures momentum. - Reschedule high-impression, low-CTR posts: Trigger on
impressions ↑&CTR ↓→ Action: adjust publish time slot → Tools: Custom script + editorial calendar API → Result: improves visibility and CTR. - Promote evergreen content gaining traction: Trigger on
week-over-week traffic growth > 20%→ Action: refresh content + newsletter feature → Tools: Google Analytics webhook → Result: extends content lifetime. - Throttle frequency to reduce audience fatigue: Trigger on
unfollow rate ↑ornegative feedback > threshold→ Action: reduce post cadence for segment → Tools: Social platform API + scheduler → Result: protects audience health.
Practical sandbox testing steps
- Create a test workspace with mirrored data and blocked live publishing. 2.
Use dry-run flags in scripts to log intended actions. 3. Simulate rate limit errors and spam filters to validate mitigation.
Practical automation recipes with trigger, action, tool examples, and expected business result
| Recipe | Trigger (Metric) | Action | Tool/Implementation Example | Expected Result |
|---|---|---|---|---|
| Auto-pause low CTR posts | CTR < 0.5% after 48h | Unpublish or requeue | Zapier → CMS API (unpublish) |
Reduce wasted impressions |
| Auto-boost high engagement posts | Engagement rate > 5% in 24h | Increase ad budget / share | Buffer + Ads Manager script | Capture rapid momentum |
| Reschedule high impressions, low CTR | Impr ↑ & CTR ↓ over 48h | Move to new time slot | Custom Python script + calendar API | Improve CTR by time targeting |
| Promote evergreen gaining traction | WoW traffic growth > 20% | Refresh content + newsletter | GA webhook → editorial task | Extend content lifespan |
| Throttle frequency for fatigue | Unfollow rate ↑ or negative feedback ↑ | Reduce cadence for segment | Social API + scheduler | Preserve audience retention |
When to Use Scripts or ML Models
Use scripts when you need multi-step logic or system integrations; use ML when patterns are complex or predictive power matters. Signals that justify ML investment include inconsistent time-to-peak, non-linear engagement patterns, or large content inventories where manual tuning doesn't scale.
- Scripts: When to use — orchestration (fetch metrics, update CMS, notify slack). Example — a script that aggregates GA + social metrics and tags content for review.
- ML models: When to use — forecasting post performance, predicting churn from content changes, or recommending headlines. Example — model predicts time-to-peak and suggests publish windows.
- Fallbacks and human-in-the-loop: Rule: always route high-confidence but high-impact actions to a human for final approval; use
explainabilityoutputs from models for transparency.
python
simple pseudo-check for dry-run
if dry_run: log("Would pause post:", post_id, "CTR:", ctr) else: cms.unpublish(post_id)
When implemented thoughtfully, rules handle routine work, scripts glue systems together, and ML adds predictive scale—each layer reduces manual effort while keeping decision quality high. This is why modern content strategies prioritize automation—it frees creators to focus on what matters.
H2: Operationalizing Insights — Teams, Workflows, and Governance
Operationalizing insights means turning analytics into reliable, repeatable actions—by clarifying who does what, when, and how outcomes are tracked. Start by assigning clear roles for scheduling, analytics, approvals, and experimentation, then map those responsibilities into a lightweight RACI so decisions don’t bottleneck. Pair that with practical meeting rhythms, dashboards that surface leading metrics, and documentation templates that preserve audit trails.
When these pieces fit together, teams move faster because governance protects quality without becoming gatekeeping.
Roles, RACI, and Meeting Cadence
Begin with simple role definitions so scheduling and analytics have single owners:
- Content Ops Manager: owns scheduling rules, publishes calendar changes, manages publishing pipelines.
- Head of Content: approves automation policies, sets editorial priorities, signs off on experiments.
- Data Analyst: monitors analytics, defines alert thresholds, validates experiment results.
- SEO Specialist: consulted on topic clusters, keyword strategy, and performance interpretation.
- Legal/Brand: consulted for compliance and messaging guardrails; informed for major calendar changes.
RACI-style table showing who is Responsible, Accountable, Consulted, and Informed for common scheduling tasks (content ops scheduling governance)
| Task | Responsible | Accountable | Consulted | Informed |
|---|---|---|---|---|
| Define scheduling rules | Content Ops Manager | Head of Content | SEO Specialist, Legal | Editorial Team |
| Monitor analytics and alerts | Data Analyst | Content Ops Manager | Head of Content, SEO | Senior Leadership |
| Approve automation changes | Head of Content | Head of Content | Content Ops Manager, Legal | Editorial Team |
| Run experiments (A/B/content tests) | Content Ops Manager | Head of Content | Data Analyst, SEO Specialist | Stakeholder Group |
| Document outcomes | Content Ops Manager | Content Ops Manager | Data Analyst, Head of Content | Full Team |
Recommended meeting cadence and agenda:
- Weekly 30–45min scheduling sync — review calendar gaps, urgent content, resource conflicts. 2.
Biweekly analytics review (45–60min) — Data Analyst presents trends, anomalies, and experiment readouts. 3. Monthly governance review (60min) — approve automation changes, audit documentation, set next-quarter priorities.
Dashboards, Alerts, and Documentation Best Practices
Surface a compact set of metrics—fewer, fresher, and action-oriented:
- Primary dashboard metrics: organic sessions, content conversion rate, page-level CTR, average time on page, publish lag
- Experiment dashboard: variant lift %, statistical confidence, sample sizes, and time-to-decision
- Health signals: queue backlog, failed publishes, API error rates
Alert thresholds and channels:
- High-priority alert: publish pipeline failure → immediate Slack #ops and email to Content Ops Manager
- Performance drop: traffic down >20% week-over-week on core page → notify Data Analyst + Head of Content
- Experiment alerts: early superiority at 95% confidence → trigger review; failure after 2x expected duration → cancel
Documentation templates and auditability:
- Publishing change log : date, author, change type, reason, rollback plan, approver.
- Experiment brief : hypothesis, metric(s), sample size, duration, QA checklist, owner.
- Automation change record: code/config diff, risk assessment, test results, deploy window, approver.
Keep documentation versioned and searchable (use a lightweight README per topic). Market leaders and teams often integrate these artifacts with tracker tools; if you’re automating publishing, consider linking automation runbooks to your content calendar. Scaleblogger’s services can help set up an AI-powered content pipeline and standardized documentation if you want a faster path to reliable governance.
Understanding these principles helps teams move faster without sacrificing quality. When governance is lightweight and tooling captures the why and who, creators spend less time defending work and more time improving it.
You’ve seen how shifting content scheduling from a blind calendar task to a feedback-driven process changes outcomes: prioritize performance signals over publish dates, tie headlines and formats to what analytics actually reward, and automate repetitive routing so teams focus on decisions, not file names. For example, a mid-market Saa company that introduced weekly performance windows doubled click-throughs by reassigning underperforming topics, and a retail marketer reduced wasted social boosts by 30% after routing posts through a short A/B cadence. If you're unsure whether this needs new tools or just discipline, the evidence shows that a little automation and careful measurement lead to the quickest improvements. If your team is busy, automation can help without losing good judgment.
If you want a practical next step, audit one week of scheduled content, identify two posts that missed expected engagement, and run a micro-experiment to change headline or distribution timing. For teams seeking a platform to help with that workflow, platforms like Explore Scaleblogger's automation and analytics solutions can the testing and reporting loop. Take that experiment, measure impact, and repeat — that iterative cycle is what turns scheduling into continuous optimization and preserves audience attention.
