

Marketing teams lose momentum when social channels work separately. They also struggle when decisions depend on guesswork instead of real signals. Analytics turns scattered engagement into a coordinated growth engine by revealing which content drives conversions, when audiences are most receptive, and where automation will multiply impact. With the right measurements, you move from repeating tactics to scaling what actually works.
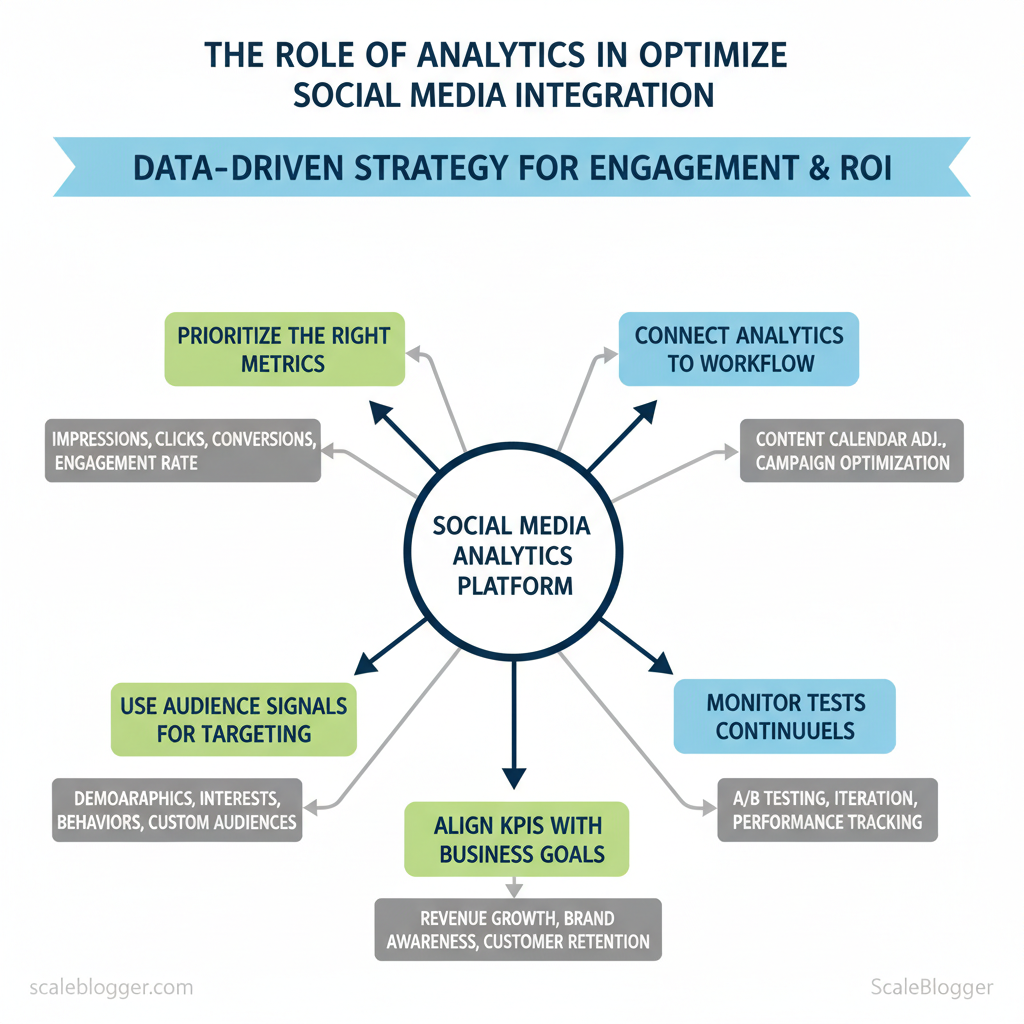
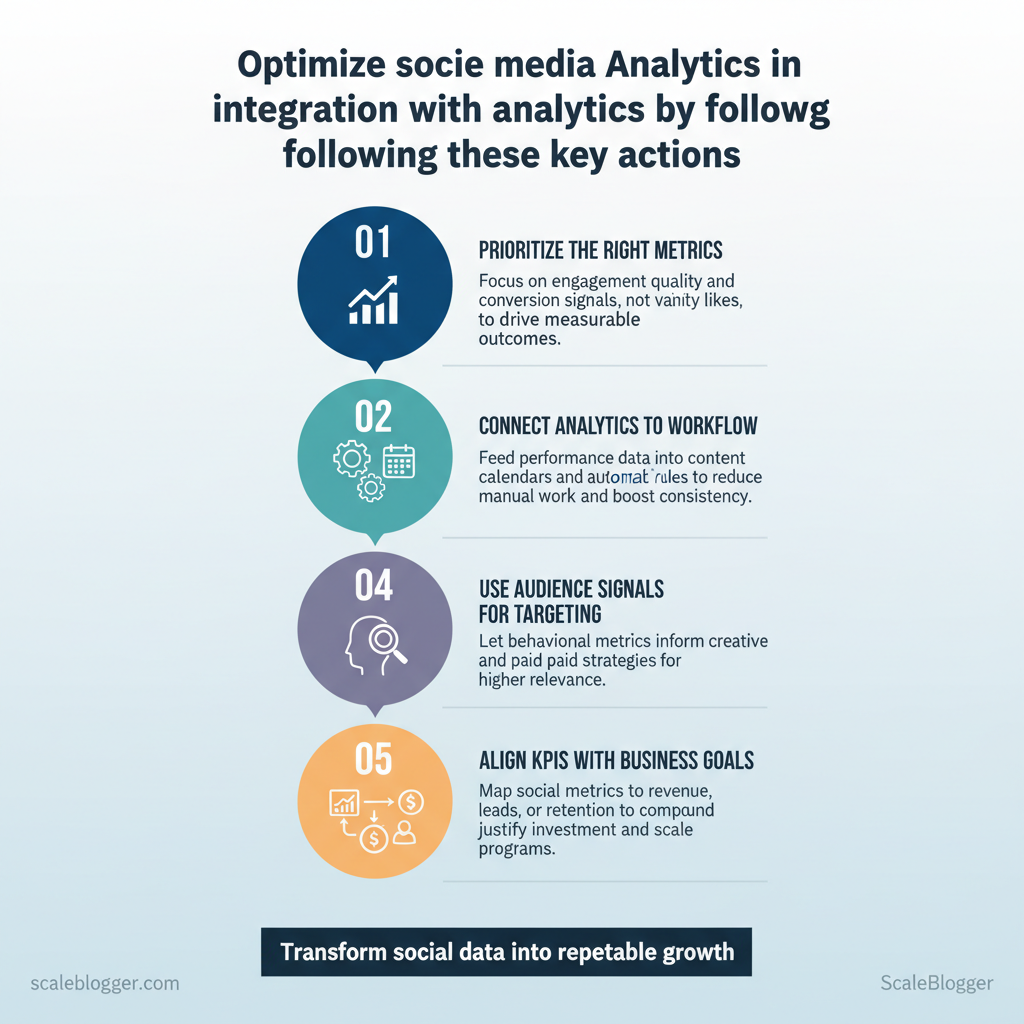
- Prioritize the right metrics → Focus on engagement quality and conversion signals, not vanity
likes, to drive measurable outcomes. - Connect analytics to workflow → Feed performance data into content calendars and automation rules to reduce manual work and boost consistency.
- Use audience signals for targeting → Let
behavioralmetrics inform creative and paid strategies for higher relevance. - Monitor tests continuously → Treat A/B experiments like short learning cycles to compound improvements over weeks.
- Align KPIs with business goals → Map social metrics to revenue, leads, or retention to justify investment and scale programs.
Explore Scaleblogger’s solutions for automating content and analytics.
Assess your analytics readiness with Scaleblogger to turn social data into repeatable growth.
Table of Contents
- Understanding the Analytics Landscape for Social Media
- Section Content
- Setting Up an Analytics-Ready Social Integration
- Attribution Models and Measuring Cross-Channel Impact
- Turning Analytics into Action: Optimization Workflows
- Advanced Techniques: Machine Learning and Automation
- Governance, Privacy, and Reporting Best Practices
- Conclusion
> Key Takeaway:
Understanding the Analytics Landscape for Social Media
Analytics isn’t a single dashboard — it’s a set of lenses that reveal different truths about audience behavior,…
Understanding the Analytics Landscape for Social Media
Analytics isn’t a single dashboard — it’s a set of lenses that reveal different truths about audience behavior, content performance, channel effectiveness and campaign ROI. Start by matching the analytics type to the question you need answered: are you trying to understand how users move across platforms, which posts drive conversion, or which channel delivers the best lifetime value? Framing the question up front keeps measurement practical and prevents metric overload.
Here’s how to effectively measure different aspects of your social media strategy:
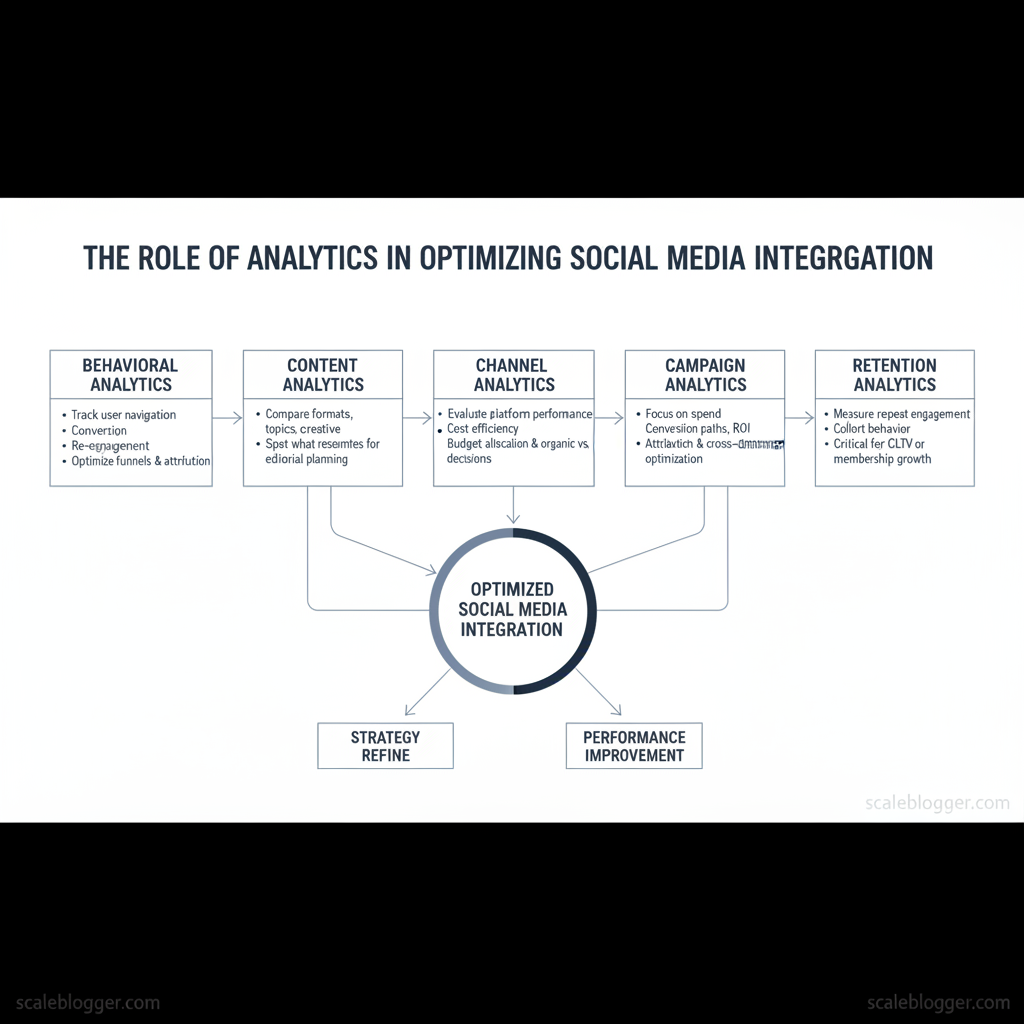
- Behavioral analytics — track how users navigate, convert, and re-engage across touchpoints; useful when optimizing funnels and attribution. Content analytics — compares content formats, topics, and creative to spot what resonates; use for editorial planning and creative testing. Channel analytics — evaluates platform-level performance and cost efficiency; use for budget allocation and organic vs.
paid decisions. Campaign analytics — focuses on spend, conversion paths, and ROI; essential for attribution modeling and cross-channel campaign optimization. Retention analytics — measures repeat engagement and cohort behavior; critical when your objective is CLTV or membership growth.
Key metrics that should drive integration decisions
- Define KPIs and formulas:
- Engagement Rate = (Likes + Comments + Shares) / Impressions — use for content resonance.
- Click-Through Rate (CTR) = Clicks / Impressions — indicates creative and CTA effectiveness. 3.
Conversion Rate = Conversions / Clicks — maps social actions to business outcomes. 4. Cost per Acquisition (CPA) = Spend / Conversions — vital for paid campaigns.
- Customer Lifetime Value (CLTV) = Average Purchase Value × Purchase Frequency × Customer Lifespan — links retention work to revenue. 2.
Benchmarks and red flags:
- Industry averages vary; use platform docs and reports as baselines. For example, platform-native engagement rates underperforming year-over-year is often a red flag of content fatigue. Watch for sudden drops in CTR or spikes in CPA — they often signal creative, targeting, or tracking issues.
- Mapping KPIs to objectives:
- Brand awareness → Impressions, Reach, View-through Rate. Demand gen → CTR, Leads, Cost per Lead.
- Revenue → Conversion Rate, CPA, CLTV.
For more on why analytics matter within strategy, see the practical guidance in “The Role of Analytics in Your Social Media Strategy” from Vie.Media. and the operational primer in Sprout Social’s guide to social analytics. These resources explain how insights translate into editorial and paid decisions.
Analytics types with primary metrics, typical tools, and top use cases to help readers choose which to prioritize
| Analytics Type | Primary Metrics | Typical Tools | Top Use Cases |
|---|---|---|---|
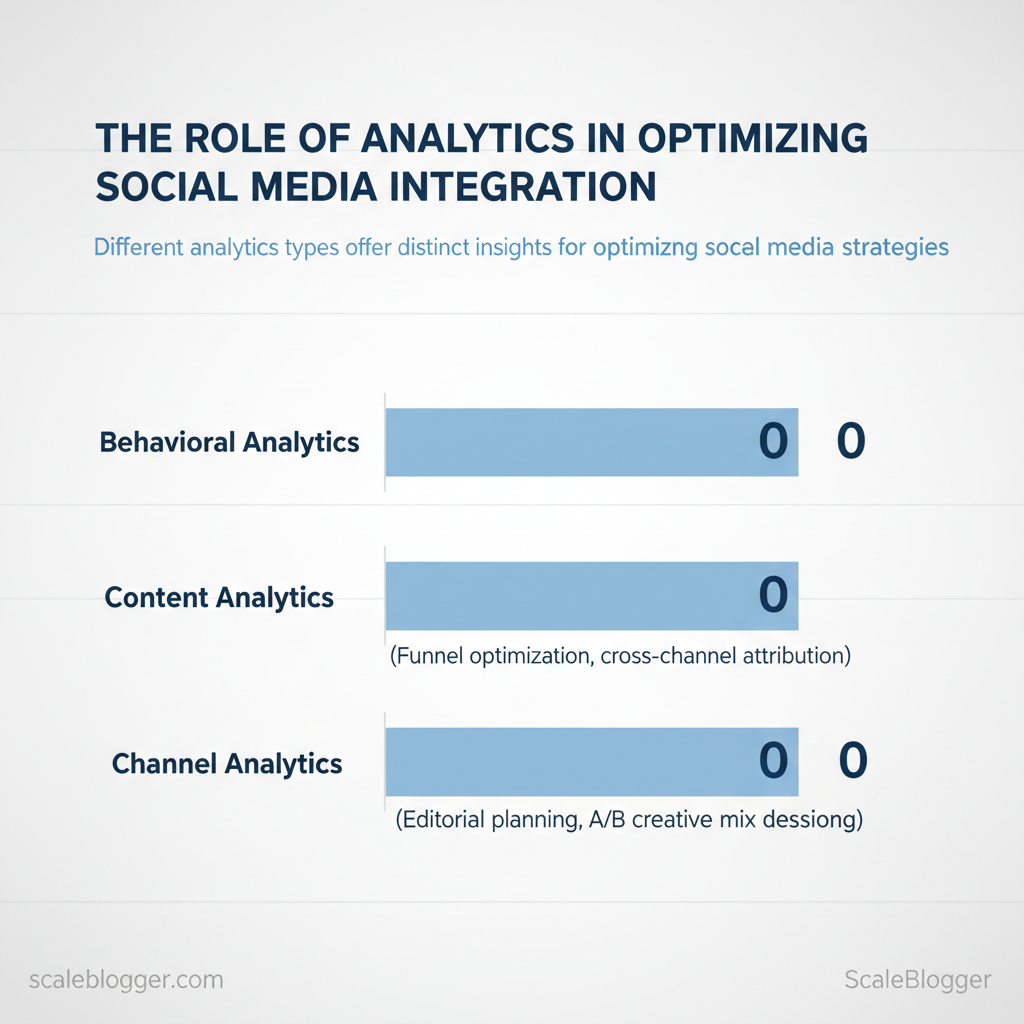
| Behavioral | Session paths, conversions, bounce rate, time on page | Google Analytics 4 (GA4), Mixpanel, Hotjar | Funnel optimization, cross-channel attribution |
| Content | Engagement rate, shares, watch time, content virality | Sprout Social, Hootsuite Analytics, Buffer, Later | Editorial planning, A/B creative testing |
| Channel | Reach, impressions, CPM, CPC | Meta Insights, X Analytics, LinkedIn Campaign Manager, Sprinklr | Budget allocation, channel mix decisions |
| Campaign | CTR, CPA, ROAS, conversion rate | Google Ads, Meta Ads Manager, Adobe Analytics, Branch | Paid campaign optimization, attribution modeling |
| Retention | Repeat purchase rate, churn rate, cohort LTV | GA4, Amplitude, Braze, Mixpanel | Loyalty programs, subscription growth strategies |
Understanding these distinctions helps teams prioritize integrations and measurement so reporting becomes action-oriented and not just noisy dashboards. When measurement aligns with the questions you care about, teams move faster and make higher-confidence decisions.
> Key Takeaway:
Setting Up an Analytics-Ready Social Integration
Start by treating social integrations like a measurement product: define the taxonomy first, then wire systems to respect it.…
Setting Up an Analytics-Ready Social Integration
Start by treating social integrations like a measurement product: define the taxonomy first, then wire systems to respect it. Establishing consistent tags, UTMs, and event names up-front prevents messy joins later and makes attribution, cohorting, and automation reliable.
Tracking architecture fundamentals
- UTM discipline: Use lowercase, hyphenated values (
utm_source=twitter,utm_medium=social) and lock a canonical list in your team wiki. Consistency enables clean GA4 reports and easier joins to CRM records. - Event naming consistency: Use
verb_object_contextpatterns (e.g.,click_cta_footer,impression_post_organic) and the same names across SDKs and pixel implementations. - Tag hierarchy: Separate page-level tags (page_view, landing_page) from interaction events (like, share, comment) so you can filter session-level vs event-level analysis.
- Define UTM and event standards: create a short spec that lists allowed
utm_source,utm_medium, and canonicalevent_namevalues. - Implement tags via a tag manager (e.g.,
Google Tag Manager) and mirror server-side events where possible to avoid ad-blocker loss. - Validate tracking with both real traffic and synthetic tests, then monitor via a daily QA dashboard.
How to validate tracking integrity
- Smoke tests: Trigger each event with controlled interactions and confirm arrival in GA4 and the social platform.
- Reconciliation: Compare click counts from ad platforms to recorded
session_startin analytics within a 5–15% tolerance. - End-to-end trace: Use a unique test
utm_campaignvalue to trace a user from ad click → landing page → CRM lead creation.
Connecting tools: choose the right integration approach
- Native integrations: Quick and low-friction; ideal for standard metrics sync but limited in customization and delayed reconciliation.
- Middleware (e.g., Zapier, Segment): Balances flexibility and speed; supports transformations and schema enforcement.
- Custom integrations: Best for complex joins, PII-safe server-side forwarding, and strict SLAs — higher build and maintenance cost.
Security and permissions checklist: ensure least-privilege API keys, rotate credentials, restrict webhook endpoints by IP or secret, enable audit logs, and confirm GDPR/CCPA alignment when syncing user identifiers.
Provide automation where it saves time: services that automate publishing and benchmarking (like the AI-powered pipelines offered at scaleblogger.com) can enforce UTM standards and push events into your analytics automatically, reducing manual errors. According to the Sprout Social guide to social media analytics, structured analytics makes campaign measurement and optimization far more actionable.
Provide a sample tracking naming convention matrix mapping channel > utm_source > utm_medium > event_name to standardize implementation
| Channel | utm_source | utm_medium | event_name |
|---|---|---|---|
| Organic X (Twitter) | social | impression_post_organic | |
| Paid Meta (Facebook/Instagram) | paid_social | click_ad_meta | |
| LinkedIn Organic | social | engagement_post_linkedin | |
| Email to Social Landing | newsletter | email_social | landing_page_visit_email |
| Cross-posting (Syndication) | syndication_partner | syndicated | share_crosspost_partner |
Understanding these principles helps teams move faster without sacrificing quality. When the integration is built around a clear taxonomy, analytics becomes a lever for smarter content and automation rather than a source of confusion.
> Key Takeaway:
Attribution Models and Measuring Cross-Channel Impact
Choosing an attribution model shapes what your team believes drove performance, so pick one that matches your business…
Attribution Models and Measuring Cross-Channel Impact
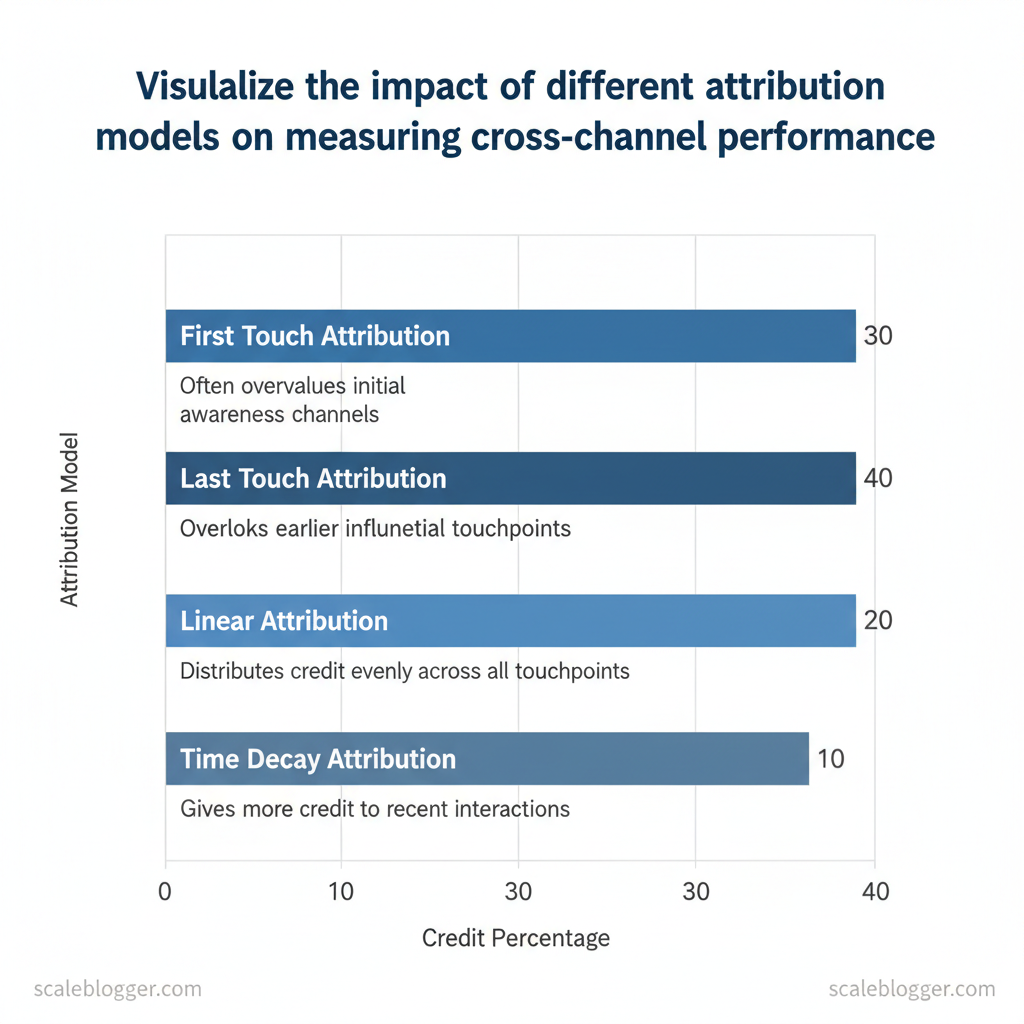
Choosing an attribution model shapes what your team believes drove performance, so pick one that matches your business model and decision cadence. For short purchase cycles, a last-click or first-click model can simplify optimization. For longer, complex journeys, linear, time decay, or data-driven approaches better distribute credit across touchpoints.
Small teams often need pragmatic rules-of-thumb; enterprises should invest in data-driven systems and incrementality testing.
Quick rules-of-thumb:
- Small marketing teams: Prefer simpler models (Last Click / First Click) for clarity and fast decision loops. Growth teams with multi-touch funnels: Use Linear or Time Decay to value multiple interactions. Enterprises / long sales cycles: Invest in data-driven attribution and holdout experiments to measure true incremental impact.
- B2B with long nurture flows: Combine model attribution with pipeline metrics (MQL → SQL → revenue) and lead scoring.
How to handle multi-touch and long sales cycles:
- Map the typical customer journey and identify high-impact touchpoints. 2.
Use model blends: 60% data-driven + 40% time-decay for experimental optimization. 3. Tie attribution outputs to downstream metrics (revenue, LTV) rather than clicks alone.
Validating Attribution: Testing and Guardrails
Design incrementality tests to isolate channel effect and avoid over-crediting. A basic holdout test splits audiences so a test group receives the full campaign and a control group receives none; compare conversions and costs. Beware selection bias and external factors like seasonality.
Considerations for sample size and duration:
- Sample size: Larger is better — aim for statistical power >80% when feasible; small tests often produce noisy signals.
- Duration: Run across at least one full business cycle (typically 4–8 weeks) to smooth weekly patterns.
- Segmentation: Test across meaningful cohorts (geography, acquisition channel, device) to detect heterogeneous effects.
Interpreting results and avoiding biases:
- Watch for spillover effects where control sees exposure indirectly.
- Guard against survivorship bias by including all relevant conversion windows.
- Use pretest baselines and check for parity across demographics to confirm randomization.
> “Social media analytics gathers data from channels to support business decisions and measure performance,” according to IBM’s overview of social media analytics. (https://www.ibm.com/think/topics/social-media-analytics)
Practical test template :
Population: Users in Region A, weekly active >=1 Randomization: 50/50 holdout Duration: 8 weeks Primary metric: Purchases (30-day attribution window) Power target: 80% to detect 5% liftChoosing the right model and validating it with experiments prevents wasted spend and misleading signals. If you need a turnkey way to run these benchmarks and automate cross-channel reporting, tools like the content performance benchmarking service at Scaleblogger can plug into your data stack and operationalize these tests. When implemented thoughtfully, attribution evolves from a debate into a discipline that guides better, faster decisions.
Turning Analytics into Action: Optimization Workflows
Treat analytics as a production input, not an occasional audit. Start by turning noisy dashboards into repeatable decisions: filter signals, form crisp hypotheses, test quickly, measure against defined success metrics, then scale winners. That sequence creates a predictable rhythm for continuous improvement and keeps teams focused on outcomes rather than vanity metrics.
What a repeatable optimization playbook looks like in practice
- ** Use thresholds (baseline + % lift) and cohort splits to isolate meaningful patterns; drop single-post blips. Example: flag content with >25% engagement lift over a 14-day baseline.
- Make it testable:
If we X (change), then Y (metric) will change by Z% within T days. ”
Run A/B or holdout tests with clear sample sizes and randomization; keep variants small to isolate cause. 4. Predefine primary/secondary metrics, use confidence intervals or p-values when appropriate, and match measurement windows to platform behavior.
- Turn validated experiments into templates or automated rules, and track long-term decay or lift persistence.
Practical prioritization for your backlog
- Use an Impact × Effort × Confidence (IEC) scoring model: Impact (1–10), Effort (1–10), Confidence (1–10). Calculate
Score = (Impact × Confidence) / Effort. – Sample calculation: Impact=8, Effort=3, Confidence=6 → Score = (8×6)/3 = 16.
Prioritize higher scores. – Operationalize by adding Score, Owner, ETA, and Status columns in your task board; hold weekly triage to re-score with fresh data.
Tips for operationalizing prioritized backlogs
- Assign a rotating experiments owner to avoid bottlenecks.
- Limit active experiments to 3–5 per team to maintain statistical validity.
- Link each backlog item to a
playbookentry for execution steps and measurement templates (this is where automation tools shine).
> “Social media analytics refers to the collection of data and metrics that help you measure your overall social media performance.” — Social Media Analytics: The Complete Guide
Visualize the 5-step optimization workflow with timeframe, owner, and success metric for easy implementation (social media optimization workflow)
| Step | Duration | Owner | Success Metric |
|---|---|---|---|
| Identify Signal | 1 week | Social Media Manager | Engagement rate vs 14-day baseline |
| Hypothesis | 1 week | Content Strategist | Predicted lift % (e.g., +10%) |
| Experiment | 2–4 weeks | Growth/Experimentation Lead | A/B lift; sample size reached |
| Measure | 1 week post-test | Data Analyst | Statistical significance / CI |
| Scale | 4–8 weeks | Ops Lead | Conversion lift & sustained reach |
Understanding these principles helps teams move faster without sacrificing quality.
Advanced Techniques: Machine Learning and Automation
Practical ML models and well-designed automation let content teams predict outcomes, react faster, and run campaigns that themselves. Below I map usable ML use cases for social channels, explain what each model predicts and why it matters, list the minimal data you need to build simple versions, and name low-code/no-code execution options so teams can move from idea to pilot quickly.
Practical ML use cases for social integration — what to build and why:
- Predictive Lead Scoring: Predicts lead quality using engagement, page visits, ad clicks, and form fields; prioritize outreach and paid spend. Content Recommendation: Matches posts to users using past consumption, metadata, and real-time signals; increases time-on-site and repeat visits. Churn Prediction: Flags at-risk customers/subscribers using interaction frequency, sentiment trends, and product usage; enables retention campaigns.
- Audience Expansion (Lookalikes): Finds new users similar to converters using hashed user attributes and behavior patterns; lowers CPA. Ad Creative Optimization: Predicts which creative will perform best using historical ad performance, creative features, and audience segments; reduces ad waste.
For analytics framing and metric choices, industry guides are helpful — see Social Media Analytics: The Complete Guide for metrics to track and integration tips.
- Data needed to build simple versions
- Engagement logs (clicks, likes, shares)
- Attribution and conversion events
- User/session metadata (device, geography)
- Content metadata (tags, length, media type)
- Historical ad creative performance
- Low-code/no-code tools to execute quickly
- Zapier / Make: connect events to scoring or alerts (good for rule-based triggers).
- BigQuery ML / Google Vertex AI AutoML: train basic models with SQL or AutoML pipelines.
- DataRobot / H2O Driverless AI: automated model selection for teams with tabular data.
- Azure ML Designer / AWS SageMaker Autopilot: visual pipelines for model ops.
- Peltarion / Hugging Face AutoNLP: lightweight text models for sentiment and topic prediction.
- ScaleBlogger’s AI-powered content pipeline: combine model outputs with automated scheduling and benchmarking for production workflows.
> “360° social analytics lets teams close the loop between content and revenue.” — industry guides show analytics-as-decisioning reduces wasted spend and improves cadence (see practical examples in the Sprout Social guide linked above).
Automation patterns move from simple alerts to fully autonomous campaigns:
- Alerts: trigger Slack/email when KPIs drop. Remediation: automatically boost organic posts that hit engagement thresholds. Adaptive Budgeting: shift ad spend toward high-performing segments by API.
- Autonomous Sequencing: create drip flows triggered by churn score changes. Creative A/B rollout: progressively roll winners to larger audiences.
Guardrails and audits are essential: require human approval for spend >$X, log decisions for 90 days, and snapshot model inputs/outputs. To audit automated decisions, capture the trigger, features used, model version, and downstream action for each run; run periodic backtests using holdout data.
Map each ML use case to required inputs, recommended tools (low-code/no-code), and expected business impact to help teams choose an approach
| ML Use Case | Required Inputs | Recommended Tools | Expected Impact |
|---|---|---|---|
| Predictive Lead Scoring | CRM events, page views, ad clicks, form fields | BigQuery ML, DataRobot, Zapier | Higher conversion rate, faster sales follow-up |
| Content Recommendation | Content metadata, session behavior, clickstream | Google Vertex AI, Peltarion, Hugging Face | ↑ Engagement, longer sessions |
| Churn Prediction | Usage frequency, support tickets, sentiment | H2O.ai, Azure ML Designer, Make | Reduced churn, targeted retention ROI |
| Audience Expansion (Lookalikes) | Seed converters, hashed attributes, conversion events | Facebook Lookalike, Google Ads, Vertex AI | Lower CPA, larger addressable reach |
| Ad Creative Optimization | Historical ad metrics, creative attributes, A/B results | AWS SageMaker Autopilot, DataRobot, Zapier | Improved ROAS, faster creative cycles |
When implemented correctly, this approach reduces overhead by making decisions at the team level.
📥 Download: Social Media Analytics Integration Checklist (PDF)
Governance, Privacy, and Reporting Best Practices
Start with the assumption that social data touches people — and that changes every decision you make about collection, storage, and reporting. Build governance around minimum necessary data, clear ownership, and repeatable reporting so teams can move quickly without exposing the organization.
Obtain consent when needed, document why you need it, and link consent to how the data will be used later. Only ingest fields needed for analytics or activation; anonymize where possible. Treat emails, phone numbers, and profile IDs as sensitive — encrypt in transit and at rest.
Use salted hashing for identifiers and avoid reversible transformations unless legally justified. Classify data flows, implement SCCs or equivalent safeguards for transfers outside regulated regions. Align data ingestion with platform TOS and API limits; respect rate limits and restricted fields.
Automate deletion/archival according to retention windows required by law or policy. Log access, transformations, and exports for forensics and compliance reviews. Route unusual integrations through legal/privacy before production.
A compliance checklist matrix mapping data type to required safeguards and common platform constraints to help legal/ops teams validate readiness
social media data privacy checklist**
| Data Type | Required Safeguard | Platform Constraints | Action Item |
|---|---|---|---|
| Email / PII | Encrypt at rest, access controls | Platform TOS often forbids scraping | Remove/obfuscate PII prior to storage |
| Behavioral Events | Purpose limitation, minimize retention | Rate limits, sampling on APIs | Aggregate to session/segment level |
| Third-party Cookies | Consent banner, opt-out mechanisms | Browser blocking, deprecation trends | Move to server-side tracking or first-party IDs |
| Hashed Identifiers | Salted hashing, rotate salts | Some platforms restrict matchlists | Use hashed matchlists; document hashing method |
| Cross-border Transfers | SCCs/adequate safeguards, DPIA | Regional export restrictions (e.g., EU) | Classify transfers; implement geo-controls |
Reporting templates and stakeholder communication
- Executive template: single-slide summary — objective, top 3 KPIs, topline result, one recommended decision. Metrics:
reach,conversion_rate, ROI estimate.
- Tactical template: 1–2 pages — daily/weekly trends, channel breakdown, creative performance, and anomalies. Metrics:
engagement_rate,CTR,cost_per_acquisition.
- Data appendix: raw counts, segment definitions, sampling notes, and data lineage.
Storytelling tips: lead with context (goal + comparator), highlight one insight, and finish with an actionable recommendation. Use visuals that map to decisions (trend line for momentum, bar charts for channel mix). For credibility, include a short methods note: sampling, filters, and known blind spots.
> Market leaders emphasize analytics as decision infrastructure; see Social Media Analytics: The Complete Guide by Sprout Social.
Quick templates you can copy:
markdown Executive one-pager: - Objective:
- KPI 1 (current vs target):
- KPI 2 (trend):
- Insight:
- Recommended action:
Understanding these practices makes compliance operational, not aspirational. This is why many organizations automate these checks—so creators can focus on content that moves the business.
Conclusion
You’ve seen how turning signals into shared metrics closes the gap between separate social channels and decision-making. Concrete patterns — teams that centralize tracking and run short A/B cycles see faster lift in reach and conversion — and research from Sprout Social confirms that analytics make those trade-offs visible. Start small: audit your tracking, build a single dashboard, and run one data-driven experiment this month to convert guesswork into repeatable wins.
If you want a faster path, try an external audit or automation to stitch data sources together; for professional help, Assess your analytics readiness with Scaleblogger. That step answers common questions about what metrics to prioritize and how to create ownership across teams, and it will show whether you need tooling, process changes, or both.
