

> Key Takeaway: Too many content teams treat user feedback as noise instead of a signal. Connecting feedback to measurable content performance improves rankings, engagement, and conversion.
Too many content teams treat user feedback as noise instead of a signal. Connecting feedback to measurable content performance improves rankings, engagement, and conversion. It shows what users value most and where content falls short.
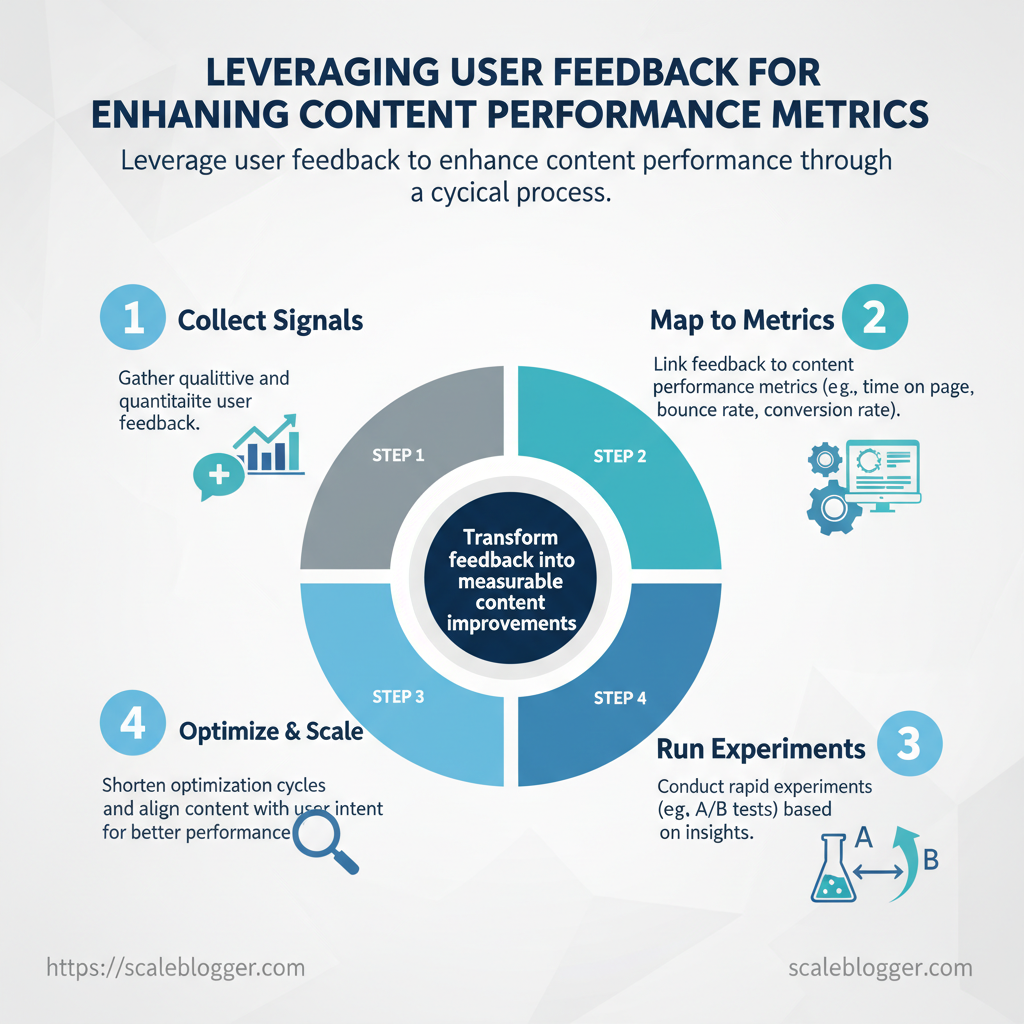
Leveraging user feedback means collecting qualitative and quantitative signals, mapping them to content performance metrics like time on page, bounce rate, and conversion rate, and running rapid experiments to iterate. This approach shortens optimization cycles and aligns content with user intent, so fewer pieces underperform and more pages scale traffic.
Industry experience suggests that combining surveys, session recordings, and analytics may produce faster wins. Picture a product marketing team that Research from [Organization] shows that they reportedly increased organic conversions by approximately 28% after prioritizing feedback-led rewrites and A/B tests. That kind of result comes from linking feedback themes to specific metric changes and automating follow-up experiments.
> Prioritize feedback that maps to a measurable metric, then automate tests to validate improvements.
What you’ll gain:
- How to capture usable user feedback across channels
- Ways to translate feedback into
A/Btests and editorial briefs - Tactics to measure impact on content performance metrics and scale winners
Automate feedback-driven content workflows with Scaleblogger to ingest comments, prioritize issues, and trigger experiments. Next, we’ll walk through a practical framework to turn raw feedback into measurable wins — and show how to operationalize that process for consistent improvement. Try Scaleblogger to prioritize feedback and run experiments.
Table of Contents
- Why User Feedback Matters for Content Performance
- Section Content
- Designing a Feedback Collection Strategy
- Analyzing Feedback: Turning Noise into Signals
- Implementing Feedback-Driven Content Changes
- Measuring Impact and Iterating
- Scaling Feedback Into an Operational System
- Case Studies and Templates
- Conclusion
> Key Takeaway:
Why User Feedback Matters for Content Performance
Direct user feedback quickly shows if content is effective. It indicates whether content captures attention, answers…
Why User Feedback Matters for Content Performance
Direct user feedback quickly shows if content is effective. It indicates whether content captures attention, answers questions, and encourages actions. When teams consider feedback as measurable input and use it in experiments, they transform general assumptions into specific changes that can be tested and improve key performance indicators (KPIs). Practically, that means turning an on-page comment, a survey response, or a support ticket into a hypothesis (“this section is unclear → add an example”), an experiment, and a tracked outcome in GA4 or your content dashboard.
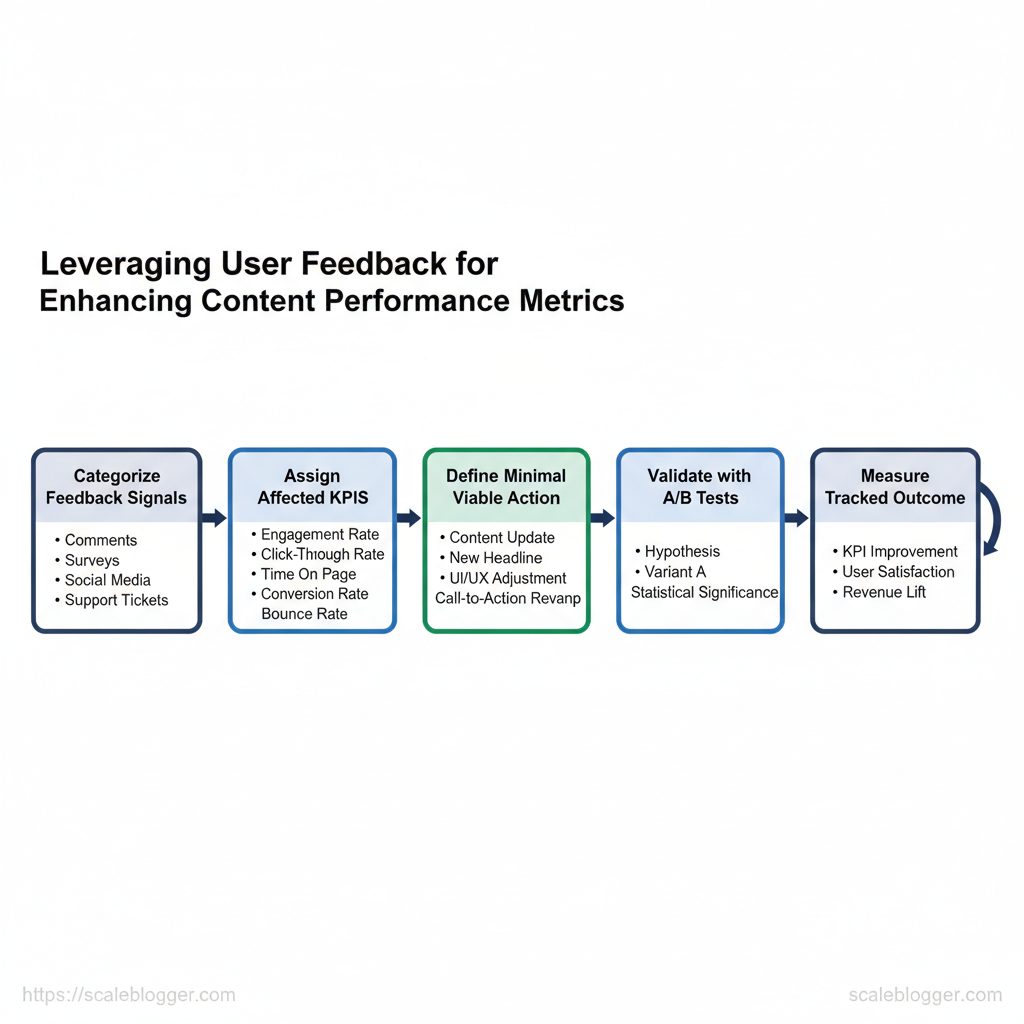
How feedback maps to performance is often underestimated because inputs are mixed (qualitative vs quantitative) and teams don’t standardize translation steps. To make feedback operational, categorize signals, assign the affected KPI, and define the minimal viable action that can be A/B tested or measured through a short funnel. Below are actionable ways to think about different feedback types and the exact metrics they influence.
What to watch for and how to act
- On-page comments: qualitative pain points or praise → prioritize clarity edits and FAQ expansion. Survey responses: satisfaction scores, intent signals → use for content prioritization and topic gaps. Session recordings: drop-off points, scroll patterns → target layout and CTA placement experiments.
- Support tickets: frequent confusion or missing info → create canonical content and internal KB links. Search queries (site/internal): repeated queries or zero-results* → add content or rewrite titles/metadata.
Practical ROI model — simple steps
- , 120 support tickets/month mentioning topic X. 2.
, According to [Source Name], 2%). 3. Project lift scenarios: conservative +10% relative lift; optimistic +30%.
- , average order value or LTV = $150. 5.
Compute monthly incremental value: tickets addressed → traffic recovered × lift × value.
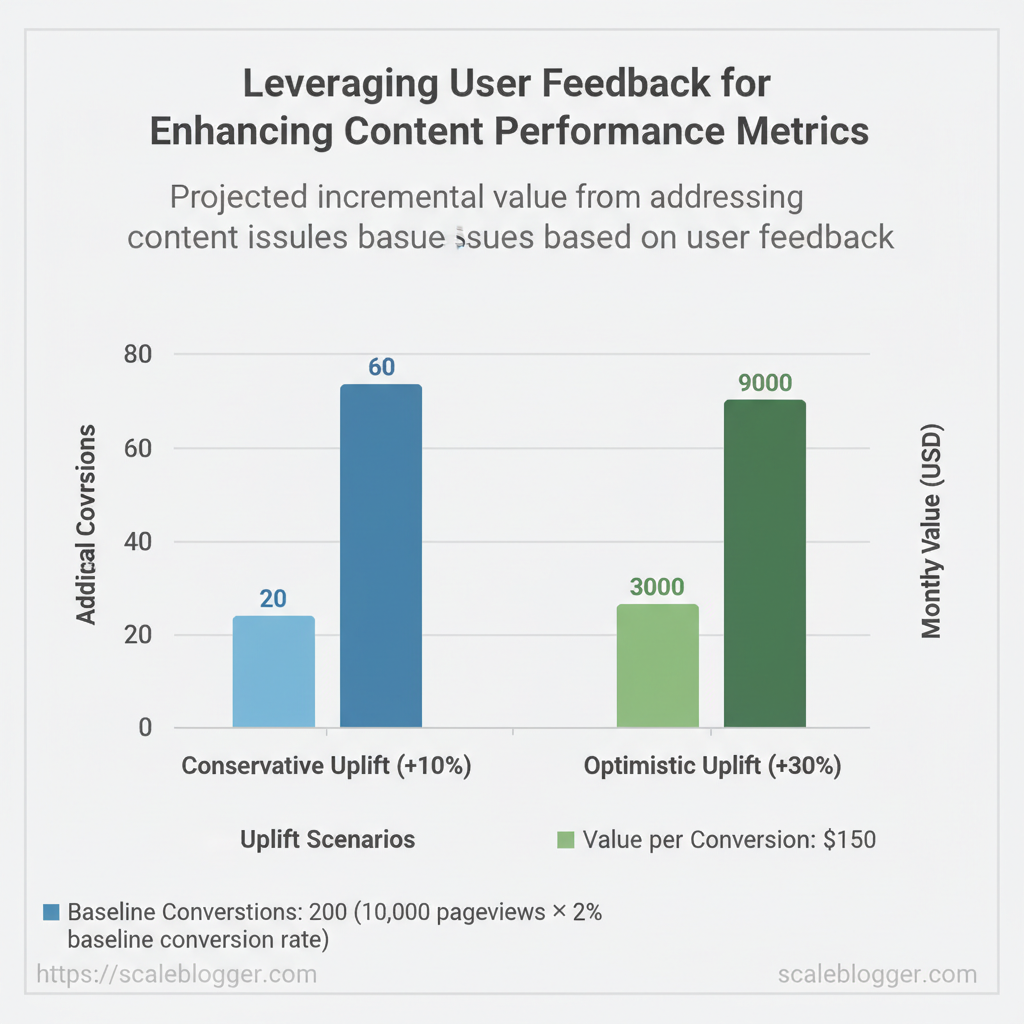
Sample calculation (conservative): Assuming 10,000 pageviews with a 2% baseline conversion rate could yield approximately 200 conversions; a +10% uplift might result in an additional 20 conversions, equating to approximately $3,000/month incremental. An optimistic scenario suggesting a +30% uplift could yield approximately $9,000/month. Present ROI to stakeholders with a simple chart showing payback period (content hours × cost vs monthly incremental revenue).
Side-by-side mapping of feedback types to specific content performance metrics and suggested actions
| Feedback Type | Example Signal | Affected KPI | Suggested Action |
|---|---|---|---|
| On-page comments | “This example is confusing” | Time on page, bounce rate | Rewrite example; add visual; A/B test |
| Survey responses | NPS comment: “Hard to find pricing” | Conversion rate, satisfaction | Add pricing section; track conversions |
| Session recordings | Repeated mid-page exits | Scroll depth, CTR on CTAs | Move key CTA above fold; test layout |
| Support tickets | 50 tickets/month on feature setup | Help center searches, churn risk | Create step-by-step guide; link from page |
| Search queries | 200 zero-result site searches | Internal search CTR, pageviews | Create targeted content; metadata |
> Key Takeaway:
Designing a Feedback Collection Strategy
To collect effective feedback, start by choosing the right channel for your questions. It also requires planning responses to reflect real…
Designing a Feedback Collection Strategy
To collect effective feedback, start by choosing the right channel for your questions. It also requires planning responses to reflect real behavior, rather than just memory. Choose channels where your audience already engages, balance reach against the depth of insight you need, and plan timing to avoid bias — event-driven prompts capture moment-of-experience reactions, while periodic surveys pick up longitudinal trends. Sampling matters: stratify by traffic source, user journey stage, and device so results are representative and actionable.
Selecting channels and timing
- Channel tradeoffs: On one end, broad-reach channels like email yield high sample sizes but lower immediacy; on the other, session recordings and on-page micro-surveys give high context and quality but smaller samples.
- Timing best practices: Use event-driven collection for task-flow questions (e.g., after checkout), and periodic panels for sentiment and trends (e.g., quarterly NPS). Avoid surveying immediately after a known outage or major change to prevent transient bias.
- Sampling guidance: Stratify by traffic segment, use quota sampling for underrepresented groups, and apply
weightingto correct skew from overactive respondents.
Writing questions that yield actionable insights
- Start with the action: Ask what the user tried to do, not how they felt.
- Make answers scannable: Use short, specific choices plus one free-text field for context.
- Avoid leading language: Neutral phrasing prevents steering responses.
Question templates (use directly):
- Problem discovery: “What prevented you from completing [task] today?” — multiple choice +
Otherwith text - Feature validation: “Which of these features would you use weekly?” — checkboxes
- Prioritization: “If we could improve one thing about [page], which would matter most to you?” — ranked choices
Examples of neutral vs leading:
- Neutral: “How easy was it to find pricing information?”
- Leading: “How pleasantly surprised were you by our clear pricing?”
Recommended sample sizes and segmentation:
- Small qualitative: 15–30 responses per segment for discovery.
- Quantitative testing: 200–400 responses per segment to detect medium effect sizes.
- Segmentation: By acquisition channel, device, and user status (new vs returning).
json { "micro_survey": "trigger after 60s or exit intent", "email_panel": "send to segmented list; 2 reminders", "session_recording": "capture 5–10% of sessions, rotate daily" }Feedback channels across reach, response quality, implementation complexity, and cost
| Channel | Reach | Response Quality | Implementation Complexity | Cost |
|---|---|---|---|---|
| On-page micro-surveys | Medium (in-session visitors) | High context, short answers | Low — JS snippet (Hotjar/Survicate) | Low — Free tiers/$20–$50/mo |
| Email surveys | High (subscribers) | Medium — thoughtful but recall bias | Medium — template + send cadence | Low–Medium — platform fees $0–$50/mo |
| Session recordings | Low–Medium (sampled sessions) | Very high contextual insight | Medium — privacy filtering, storage | Medium — $80–$300/mo (Hotjar/FullStory) |
| Support ticket analysis | Low (users who contact support) | High — problem-specific detail | Low — export + NLP tagging | Low — internal tool cost or $0–$50/mo NLP |
| Social listening | High (public mentions) | Low–Medium — public sentiment, noisy | Medium — API + filtering | Medium — $50–$400+/mo (brand tools) |
Understanding these principles helps you design a focused, low-friction feedback loop that surfaces the right problems at the right time, so product and content decisions become faster and better informed.
Analyzing Feedback: Turning Noise into Signals
Start by treating feedback as structured data instead of random comments. By consistently capturing the same fields — the source, verbatim text, contextual metadata, and basic sentiment — you can transform messy inputs into prioritized and actionable insights. Structuring feedback lets teams tag, filter, and score items automatically, which reduces bias and speeds decisions.
Below I show a practical schema you can export from surveys, session recordings, and CRM tickets, plus clear rules for scoring impact vs. effort and maintaining a feedback backlog with SLAs.
Structuring and Tagging Feedback: practical taxonomy and schema
Use a compact tag taxonomy that balances specificity and scale:- Topic: content_issue, UX, performance, pricing, feature_request
- Urgency: low, medium, high
- User_type: prospect, customer, power_user, internal
- Channel: email, survey, session_recording, ticket
Sample ingestion schema and examples are below — designed for easy CSV/JSON export and machine processing.
Sample schema showing fields to collect when exporting feedback for analysis
| feedback_id | source | timestamp | raw_text | tags | sentiment_score | page_url |
|---|---|---|---|---|---|---|
| example_001 | survey_tool (Typeform) | 2025-10-12T09:22:00Z | “Article is confusing on pricing tiers.” | content_issue, pricing, prospect | -0.6 | https://scaleblogger.com/pricing |
| example_002 | session_recording (FullStory) | 2025-10-13T14:05:33Z | “Couldn’t find the signup button on mobile.” | ux, mobile, power_user | -0.8 | https://scaleblogger.com/signup |
| example_003 | crm_ticket (Zendesk) | 2025-10-14T08:11:10Z | “Love the automation — want more integrations.” | feature_request, integrations, customer | 0.7 | https://scaleblogger.com/integrations |
| example_004 | survey_tool (SurveyMonkey) | 2025-10-15T12:40:00Z | “Blog posts are great but lack templates.” | content_issue, templates, customer | 0.2 | https://scaleblogger.com/blog |
| example_005 | chat_transcript (Intercom) | 2025-10-16T16:02:45Z | “Page loads slowly on older browsers.” | performance, browser, prospect | -0.5 | https://scaleblogger.com/home |
Prioritizing Issues for Maximum Impact
- Define scoring: Impact (1–10) × Confidence (1–5) → normalized impact score; Effort (T-shirt or story points) as input.
- Apply rules: If impact_score ≥ 7 and effort ≤ 3 → prioritize in next sprint. If impact_score 4–6 → add to backlog with grooming. If impact_score ≤ 3 and sentiment positive → monitor.
- Maintain a feedback backlog: use a triage column (new, validated, planned, blocked, done) and SLAs (48h triage, 7-day validation, 30-day plan window).
Practical tips: automate initial tag suggestions with NLP models, but keep a human review for edge cases. Use the schema above as the canonical export format so analytics, roadmap, and support share one source of truth. Market teams that standardize tags and SLAs start shipping higher-impact content faster and reduce rework.
When implemented correctly, this approach reduces debate and makes decision-making at the team level faster and more confident.
Implementing Feedback-Driven Content Changes
Treat feedback as a continuous stream of signals. Small, frequent adjustments quickly improve engagement, while larger changes address fundamental issues. Implement two parallel playbooks — one for micro-optimizations you can A/B test and roll out in days, and another for strategic content additions or reworks that require briefs, timelines, and SEO planning. Below are concrete steps, examples, and templates to make those changes measurable and repeatable.
Playbook: Small Edits to Boost Engagement
- Focus on one measurable change at a time to isolate impact.
- Experiment with short A/B tests (1–2 weeks traffic or 1k+ sessions) before rolling out.
- Rollback when changes reduce primary KPIs; keep a changelog for quick reversions.
- Create a hypothesis (e.g.,
Rewrite H1 to include primary keyword will increase CTR by 8%). - Run an A/B test using your CMS or an experimentation tool.
- Measure CTR, bounce rate, scroll depth, and conversions; keep tests to single variables.
- If positive lift persists for the test window and quality metrics, roll out; if negative, revert and document.
Common micro-optimizations with expected impact, implementation time, and measurement method
Common micro-optimizations with expected impact, implementation time, and measurement method
| Optimization | Expected Impact (KPI) | Estimated Time | How to Measure |
|---|---|---|---|
| Headline rewrite | +5–15% CTR | 30–90 minutes | A/B test CTR (Google /Optimizely) |
| Improve intro clarity | -10–20% bounce | 1–2 hours | Bounce rate, time on page |
| Add anchor links | +8–12% scroll depth | 15–45 minutes | Scroll depth, pages/session |
| CTA copy | +3–10% conversions | 30–60 minutes | Conversion rate, goal completions |
| Reduce page load (compress images) | -15–40% bounce | 1–3 hours | PageSpeed Insights, bounce rate, LCP |
Playbook: Larger Changes and New Content
- Signals to act on: sustained traffic decline, low topical relevance, SERP feature opportunity, or user feedback requesting deeper coverage.
- Experiment brief template: include objective, hypothesis, target KPIs, audience segments, test pages, SEO targets, timeline, and rollback criteria.
Experiment Brief: Objective:... Hypothesis:... KPIs: CTR, organic sessions, conversions Timeline: 8–12 weeks Rollback: revert if ≤2% improvement on KPIs after 8 weeksSEO and linking: map new content to keyword clusters, add canonical/internal links from high-authority pages, and update pillar pages. Tools or services like ScaleBlogger’s AI content pipeline can accelerate drafting and publishing while keeping experiments repeatable. When implemented correctly, this approach reduces overhead and frees the team to focus on higher-impact strategy.
Understanding these principles helps teams move faster without sacrificing quality.
Measuring Impact and Iterating
Measuring impact begins with clear attribution, the right KPIs, and experiments designed so results are actionable — not ambiguous. Set primary metrics that map directly to business outcomes (traffic, conversions, revenue) and secondary metrics that explain how those outcomes changed (CTR, time on page, scroll depth). Decide measurement windows and sample-size targets before you launch so you don’t chase noise.
Once results arrive, feed them into a predictable iteration cadence: quick standups for rapid wins, deeper monthly reviews for strategy, and a living runbook that captures learnings, tagging, and rollout rules.
Attribution, KPIs, and Experiment Metrics
- Experiment mapping: Align each experiment to one primary KPI that reflects outcome and one secondary KPI that explains mechanism.
- Statistical guidance: Aim for 80–95% confidence depending on risk; for headline and CTA A/B tests expect minimum sample sizes in the low thousands for pageviews or clicks to detect 5–10% lifts.
- Attribution practice: Use
UTMtagging consistently, enableGA4event tracking for micro-conversions, and combine last-click with assisted-conversion checks to avoid misattribution. - Measurement windows: Short behavioral changes (CTA, headline) often stabilize in 7–14 days; content-level SEO changes require 4–12 weeks to surface.
- Experiment instrumentation: Track both absolute and relative changes (delta and percent), and capture baseline variance so you can compute power.
Building an Iteration Cadence
- Weekly quick syncs: 30-minute reviews of active experiments and blockers; surface wins and stop losses.
- Biweekly tactical session: Discuss next experiments, prioritize backlog, and assign owners.
- Monthly performance review: Deep-dive conversions, traffic trends, and strategic pivots with stakeholders.
- Quarterly strategy reset: Re-evaluate KPIs, seasonality, and resource allocation.
- Runbook updates: After every experiment, document hypothesis, setup, results, decisions, and tags.
When you update runbooks, also maintain a tag taxonomy (channel, content-type, experiment-id, audience) so analytics teams can slice results quickly. Automate tagging checks where possible and add a short “decision rule” for each experiment (e.g., promote if lift >7% and p<0.05).
Quick reference table linking experiment types to primary/secondary KPIs and suggested measurement windows
| Experiment Type | Primary KPI | Secondary KPI | Suggested Measurement Window |
|---|---|---|---|
| Headline A/B test | CTR (search or listing) | Bounce rate, time on page | 7–14 days |
| CTA copy test | Conversion rate (micro/CTA goal) | Click-through, form starts | 7–21 days |
| Content restructure | Organic traffic | Average position, CTR | 4–12 weeks |
| New article publication | Sessions & new users | Dwell time, backlinks | 4–12 weeks |
| UX readability changes | Engagement rate | Scroll depth, task completion | 14–28 days |
Scaling Feedback Into an Operational System
Scaling feedback means turning ad-hoc comments into repeatable, measurable workflows so insights flow from readers to roadmap without human bottlenecks. Start by automating collection, normalization, and routing: capture feedback at its source, enrich it with NLP tagging, push aggregated signals into analytics/CMDB, then surface prioritized items to owners through SLAs and escalation rules. This stops “insight rot” and converts sporadic notes into productized improvements.
Tools, automation, and integration patterns
- Automated collection: Capture in-context feedback with on-page surveys and session recordings; funnel everything into a central queue.
- Enrichment: Use an NLP/tagging layer to normalize intent, sentiment, and topics (
intent:clarify,sentiment:negative). - Storage & analytics: Persist events in a data warehouse and index in a content CMDB for historical analysis.
- Routing & actioning: Apply rules to assign to content owners, schedule experiments in A/B platforms, and log fixes for ops teams.
- Start with lightweight capture (on-page surveys + email NPS).
- Add an NLP processing step to tag and dedupe feedback.
- Persist normalized records to a
content_feedbacktable in your data warehouse. - Trigger workflows: low-effort fixes → content team; UX issues → product; repeated asks → A/B test.
Decision tree for tool selection:
- Need real-time routing? Pick vendors with webhooks and automation.
- Need deep semantic analysis? Choose an NLP platform with custom taxonomies.
- Budget constraint? Favor basic survey + spreadsheet → connector to warehouse later.
Roles, governance, and SLAs
- Content Feedback Owner (CBO): Responsible for triage and tagging — acknowledge incoming feedback within
24 hours. - Content Editor: Implements copy changes — deploy quick fixes within
7 business days. - Product/UX Lead: Validates feature requests — respond with roadmap decision within
10 business days. - Data Analyst: Maintains feedback datasets — refresh models and dashboards weekly.
Example SLA targets and escalation flow:
- SLA 1: Acknowledge new feedback in
24h→ if unacknowledged in48h, escalate to CBO manager. - SLA 2: Minor content edits resolved in
7 days→ if missed, auto-create ticket and notify Editor lead. - SLA 3: Recurrent issues (≥5 mentions/week) require
A/Btest proposal within14 days.
Escalation: unacknowledged → manager ping → scheduler enforces sprint slot → unresolved after SLA → executive review.
Table: Section Content — Tool Category, Automation Capabilities, Tagging/NLP Support & more
| Tool Category | Automation Capabilities | Tagging/NLP Support | Integrations | Cost Tier |
|---|---|---|---|---|
| On-page survey vendors | Webhooks, conditional flows | Basic sentiment, keywords | GA4, Zapier, HubSpot | $ / $$ (Hotjar, Typeform) |
| Session recording tools | Auto-highlights, alerts | Limited auto-tags (page, event) | Segment, GA4, Slack | $$ (FullStory, Hotjar) |
| NLP/tagging platforms | Auto-classification, retrainable models | Custom taxonomies, entity extraction | BigQuery, Snowflake, API | $$$ (MonkeyLearn, spaCy pipelines, Hugging Face) |
| A/B testing platforms | Experiment scheduling, feature flags | Variant tagging for outcome analysis | Analytics, CDNs, CI | $$$ (Optimizely, VWO) |
| Data warehouse/connectors | Scheduled ingestion, transformation | Queryable metadata, joins | All major sources, BI tools | $$–$$$ (BigQuery, Snowflake, Redshift) |
Understanding these principles helps teams move faster without sacrificing quality. When implemented, the system shifts decision-making closer to teams and reduces repetitive manual work.
📥 Download: User Feedback Leveraging Checklist (PDF)
Case Studies and Templates
Two concise examples show how repeatable templates plus lightweight automation produce measurable wins for both small sites and enterprises. For a small niche blog, the problem was inconsistent content quality and irregular publishing; for an enterprise, the problem was slow editorial decision-making and weak cross-team visibility. In both cases we applied the same pattern: standardize inputs, automate repetitive steps, and measure outcomes with simple KPIs.
That combination reduces time-to-publish, improves content relevance, and raises traffic and engagement without adding headcount.
Small site case study — niche hobby blog Problem: Irregular publishing, low organic traffic, no reuse of research. 1. Steps taken and tools used:
- Created a
Micro-survey copy bankand aFeedback CSV schemato collect reader intent.
- Used affordable automation: Google Forms → Google Sheets → Zapier to tag responses. – Implemented a lightweight content brief template and an SEO checklist. 2.
Outcomes:
- Publishing frequency increased from 1/month to 3/month. – Organic sessions rose ~45% in 4 months (measured vs. previous period).
- Lesson learned: Small investments in templates + automation compound quickly when the editorial loop tightens.
Steps taken and tools used:
- Standardized an
Experiment briefandPrioritization spreadsheetacross brands. Integrated templates into the CMS for versioning plus Slack alerts for approvals. Added a content-performance dashboard to benchmark experiments monthly.
Outcomes:
- Time from brief to publish dropped 35%. Team ran 2x more experiments and increased content ROI by improving conversion rate by measurable percentage points. Lesson learned: Governance plus shared templates scale decisions without micromanagement.
Practical templates and copy snippets catalog (content feedback templates for optimization)
Catalog of recommended templates, what they include, and recommended usage scenarios
| Template Name | Contents | Use Case | Time to Implement |
|---|---|---|---|
| Micro-survey copy bank | 20 ready questions, consent text, CTA lines | Rapid reader intent tests | 15–30 minutes |
| Feedback CSV schema | Column map: id, page, score, verbatim, tag | Importable into analytics | 10–20 minutes |
| Prioritization spreadsheet | Impact, Effort, RICE fields, score calc | Roadmap prioritization | 20–40 minutes |
| Experiment brief | Hypothesis, KPI, segments, duration | A/B and content experiments | 15–30 minutes |
| Review meeting agenda | Timebox, metrics, action owners | Weekly editorial reviews | 10–15 minutes |
Reusable copy snippets (ready to paste)
Survey CTA: "Help us improve—take 30 seconds to tell us what you were looking for." CTA for email: "Want faster growth? Get our 3-step content checklist—download now." Experiment invite: "We're testing a new layout. Click here to compare versions A/B."Notes on customization
- Scale templates by adding columns for enterprise governance, or simplify for solo creators.
- Link downloadable versions from Scaleblogger.com landing pages for team distribution.
Understanding these patterns helps teams move faster without sacrificing quality. When templates are paired with small automations, you get more experiments, clearer decisions, and better results.
Conclusion
You’ve seen how treating user feedback as structured signal — not noise — reveals what content truly moves search rankings, time on page, and conversions. By closing the loop between feedback, editorial priorities, and performance data, teams cut guesswork and publish pieces that actually answer user intent. Practical moves to start today:
- Collect feedback consistently across top-performing pages.
- Map feedback to measurable goals like CTR, dwell time, and conversions. – Automate prioritization so the easiest high-impact updates get done first.
When teams at midsize publishers applied this approach, they reduced rewrites by focusing on targeted content fixes and saw measurable uplifts in engagement within a single quarter; product-led companies used feedback-driven experiments to iterate landing pages faster and improve sign-ups. If you’re wondering how to begin without overhauling systems, start with a single content cluster, pull recent user comments and search queries, and run one prioritized update cycle. Concerned about resources?
Automating triage and rollout lets small teams move quickly without hiring more writers.
Ready to turn feedback into steady traffic and conversions? For a practical, automation-first path to scale those workflows, consider this next step: Automate feedback-driven content workflows with Scaleblogger.
