

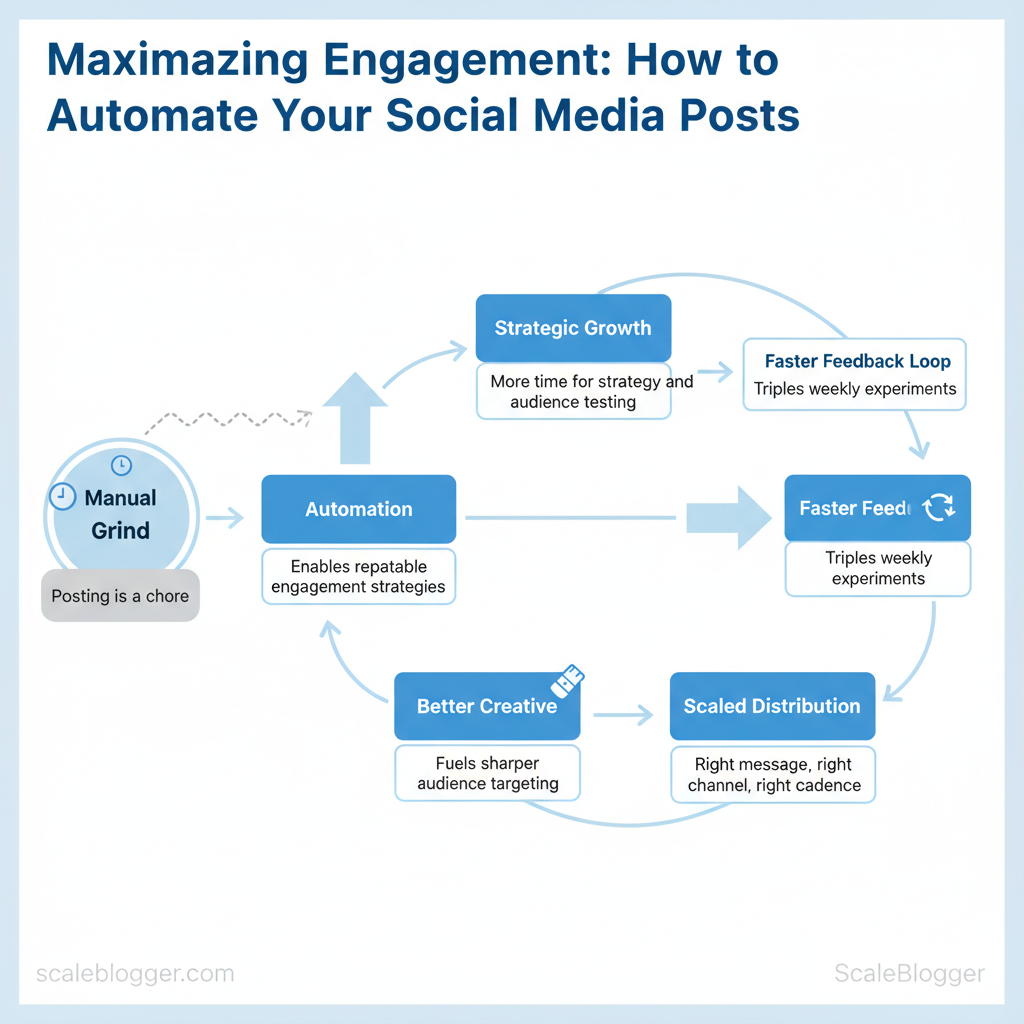
Marketing teams can become less effective when posting turns into a tedious manual task instead of a tool for growth. Data shows that teams automating repetitive tasks can focus more on strategy and audience testing. This leads to increased reach and conversions. Smart social media automation focuses less on scheduling for its own sake and more on enabling repeatable engagement strategies that scale.
Automation changes how content is distributed. It ensures that the right message goes to the right channel at the right time. This frees up teams to try out new formats and measure their effectiveness. Picture a team that triples weekly experiments because scheduling no longer consumes half their day; the faster feedback loop fuels better creative and sharper audience targeting.
Try Scaleblogger to automate and your content distribution and accelerate those feedback cycles.
- What parts of your posting workflow to automate first to preserve quality
- How to design engagement strategies that hinge on faster iteration
- Tools and templates that keep voice consistent across channels
- Measuring lift: metrics that reflect true audience engagement
- How to align automation with editorial processes for steady growth
The next section walks through a step-by-step approach to automating posting without sacrificing brand control, starting with prerequisites and low-risk wins.
> Key Takeaway: ## Prerequisites and What You’ll Need
Begin with the accounts, permissions, and skills needed to make content move smoothly from idea to publication without any obstacles. Get workspace-level access, a reliable scheduling system, basic design…
Prerequisites and What You’ll Need
Begin with the accounts, permissions, and skills needed to make content move smoothly from idea to publication without any obstacles. Get workspace-level access, a reliable scheduling system, basic design assets, and a small set of automation credentials — those four things alone accelerate iteration and reduce rework.
Essential accounts and access
- Team workspace: Slack or Microsoft Teams with channel access for editorial coordination. CMS editor account: Publish permission in
WordPress/Ghost/Contentful(no preview-only roles). Social platform logins: Business accounts for Facebook, Instagram, LinkedIn, and Twitter/X plus admin-level access to Pages.
- Analytics access: Read permissions for Google Analytics/GA4 and Search Console. API keys: API token for scheduling platform or automation (if using API-first tools).
- Prepare assets and formats:
- Images: 1200×628 px for link previews, 1080×1080 px for square posts, vertical 1080×1920 px for stories/Reels.
- Captions: 150–300 characters for feed copy; single-line CTAs for micro-formats.
- CTAs:
Learn more|Read the post|Download checklist(use consistent UTM parameters). - Set up templates:
- Editorial brief template (title, intent, target keyword, CTA).
- Social caption template with
#hashtags,@mentions, and UTM snippet.
Time estimates and difficulty
- Initial setup: 3–6 hours (create accounts, connect analytics, and add team members).
- Ongoing content prep per post: 45–90 minutes (copy, image, CTAs).
- Difficulty level: Low–Medium for non-technical users; Medium–High if integrating API automations or custom workflow scripts.
Recommended scheduling tool categories
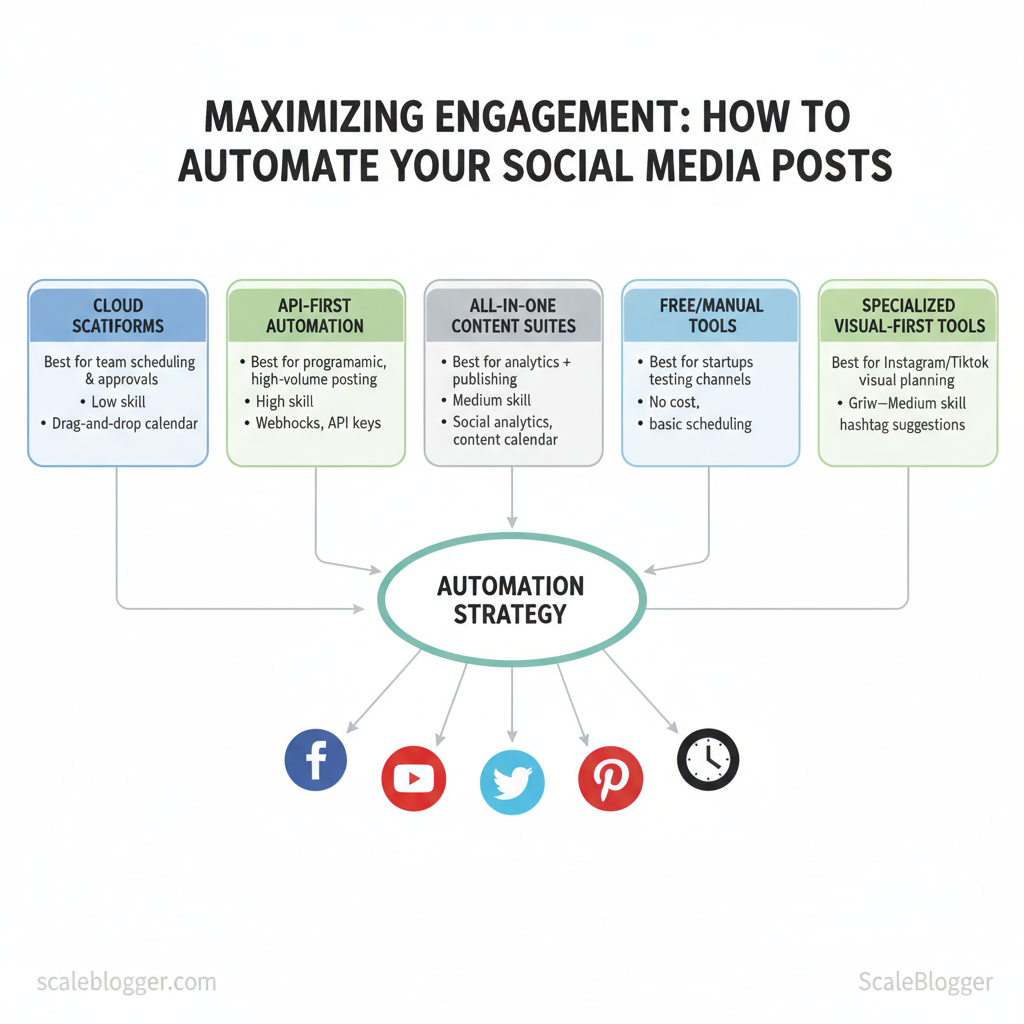
- Cloud-based scheduling: Use for ease of use and team UIs; schedule in batches.
- API-first automation: Use for high-volume, programmatic workflows and advanced integrations.
Code snippet: UTM template for CTAs
utm_source=social&utm_medium=organic&utm_campaign={{campaign}}&utm_content={{post_type}}Quick comparison of tool categories and when to use them
| Tool/Category | Best for | Required Skill Level | Key Features |
|---|---|---|---|
| Cloud scheduling platforms (Buffer, Hootsuite) | Team scheduling & approvals | Low | Drag-and-drop calendar, multi-account posting, analytics |
| API-first automation (Zapier, Make, custom scripts) | Programmatic, high-volume posting | High | Webhooks, API keys, conditional logic, retries |
| All-in-one content suites (Later, Sprout Social) | Analytics + publishing in one place | Medium | Social analytics, content calendar, asset library |
| Free/manual tools (native platform schedulers) | Startups testing channels | Low | No cost, basic scheduling, limited analytics |
| Specialized visual-first tools (Planoly, Tailwind) | Instagram/TikTok visual planning | Low–Medium | Grid preview, hashtag suggestions, shoppable posts |
Understanding these prerequisites prevents common slowdowns and makes it easier to scale a content pipeline without constant fire drills. When implemented, teams reach publish-ready status faster and spend more time optimizing content rather than wrangling access.
> Key Takeaway: ## Step 1 — Define Your Engagement Goals and KPIs
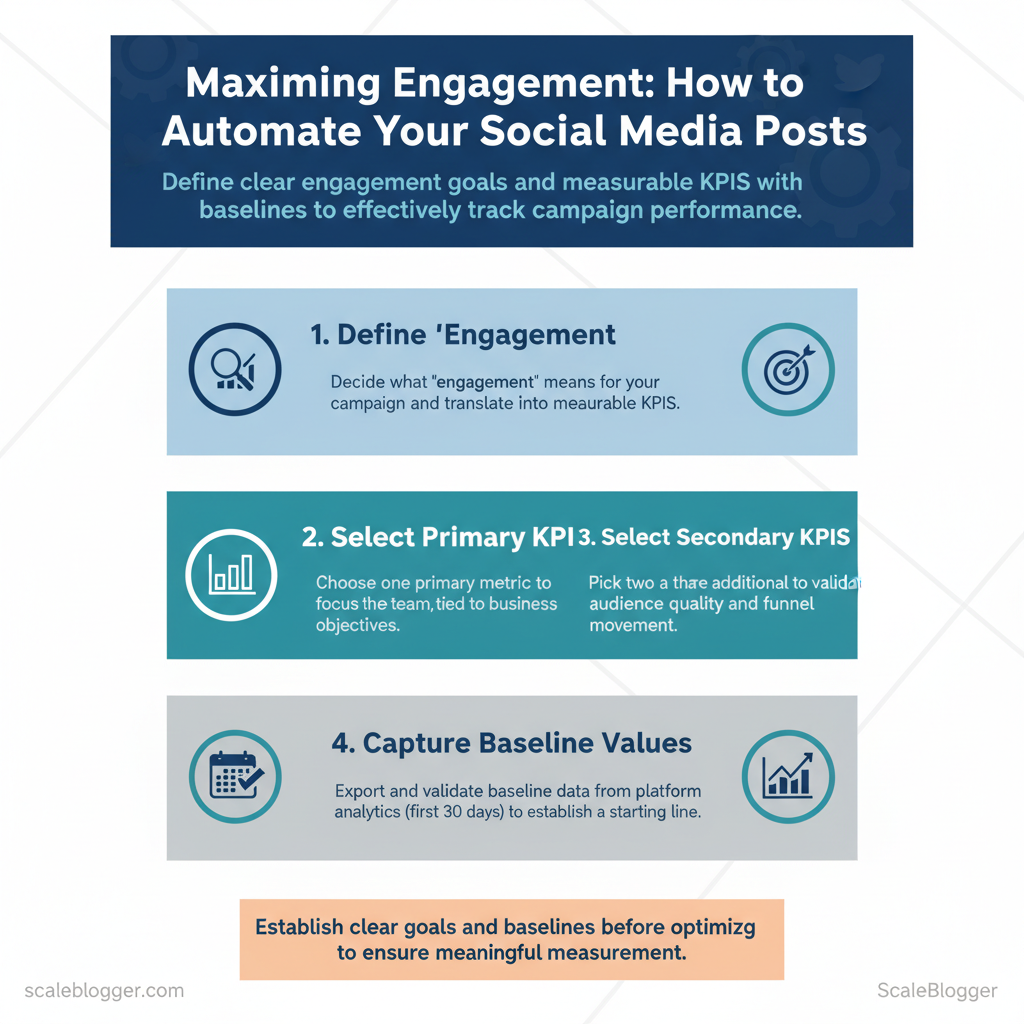
First, define what “engagement” means for your campaign. Then, turn that definition into measurable KPIs with clear numeric targets and deadlines.
Step 1 — Define Your Engagement Goals and KPIs
First, define what “engagement” means for your campaign. Then, turn that definition into measurable KPIs with clear numeric targets and deadlines. Pick one primary KPI to focus the team, plus two or three secondary KPIs that validate audience quality and funnel movement. Capture baseline values from the platform analytics exports (first 30 days) so every test or optimization uses the same starting line.
Prerequisites and tools
- Data access: Admin access to native platform analytics (Twitter/X, LinkedIn, Instagram, Facebook, TikTok).
- Tools: CSV export capability, Google Sheets or Excel, and a simple dashboard (Google Data Studio or an automated pipeline like the AI-powered content pipeline from Scaleblogger.com for recurring exports).
- Time: 2–4 hours to pull and validate baseline exports.
- Choose KPIs
- Primary KPI: Select one metric tied to business impact (e.g., CTR to landing page, lead form completions).
- Secondary KPIs: Pick engagement signals that indicate content resonance (e.g., likes, comments, save rate, watch time).
- Supporting metrics: Add delivery metrics that affect visibility (e.g., impressions, reach, frequency).
- Capture baselines
- Export the most recent 30 days of platform analytics.
- Validate each metric definition (platforms measure impressions and reach differently).
- Document the date range, time zone, and any paid vs organic splits.
- Set SMART targets
- Specific:
According to research from make.com, aim to increase CTR to blog by approximately 25%. - Measurable: Use URL-tagged clicks in platform reports or UTM-tagged sessions in GA4
- Achievable: Base on historical variance; avoid arbitrary multipliers
- Relevant: Tie to revenue or lead objectives
- Time-bound: 90-day targets with weekly checkpoints
Baseline KPI template readers can populate
| Platform | Metric (e.g., impressions, CTR) | Baseline Value | Target Value (90 days) |
|---|---|---|---|
| Twitter/X | CTR to blog | 0.9% | 1.4% |
| Click-through rate (posts) | 1.6% | 2.4% | |
| Save rate (posts) | approximately 0.8% | approximately 1.5% | |
| Engagement rate (organic) | approximately 2.2% | approximately 3.0% | |
| TikTok | Average watch time (seconds) | approximately 10s | approximately 16s |
Expected outcomes and checkpoints
- Week 2: Confirm baselines and initial engagement trends.
- Week 4: Run first A/B test on creative; measure delta against baseline.
- Week 8: Reassess and tighten target ranges based on variance.
Common troubleshooting
- If baseline exports differ from platform dashboards, confirm time-zone and attribution windows.
- When engagement is high but CTR is low, prioritize clearer CTAs and
UTMtracking to isolate traffic.
Understanding and documenting KPIs up front prevents wasted tests and aligns creative, analytics, and paid teams around measurable outcomes. When targets are realistic and baselines are clean, teams move faster and test results become reliable indicators for scaling.
> Key Takeaway: ## Step 2 — Build a Content Calendar and Repurposing Plan
Begin by viewing the content calendar as a tool you can reuse, rather than just a static spreadsheet. A calendar combined with explicit repurposing rules turns every long-form asset into a…
Step 2 — Build a Content Calendar and Repurposing Plan
Begin by viewing the content calendar as a tool you can reuse, rather than just a static spreadsheet. A calendar combined with explicit repurposing rules turns every long-form asset into a steady stream of platform-ready posts. Begin with an audit that classifies assets by intent, format, and performance, then map those assets to predictable repurposing outputs and publishing cadence.
Prerequisites
- Clean content audit exported to CSV with columns:
URL,Topic,Pillar,Format,Published Date,Traffic,Conversions. 2.
A project management board (Trello/Asana/Notion) and a shared calendar (Google Calendar/Outlook). 3. Repurposing template files for social, email, and microsites.
Tools / materials needed
- Content audit CSV — central source of truth. Editorial calendar (Notion or Google Sheets) — contains publish dates and repurpose slots. Asset templates —
blog → thread,blog → short video script,blog → newsletter snippet.
com for pipeline automation.
- Audit and categorize content (30–90 minutes per 100 posts)
- Tag by intent: Top-of-funnel, Mid-funnel, Bottom-funnel.
- Tag by format: Evergreen, News, How-to.
- Score for repurpose value:
High(pillar content),Medium(case study),Low(news/announcements).
- Create platform-format mapping rules (2–4 hours)
- Define one primary repurpose format per platform and two secondary formats.
- Standardize lengths and specs (see table below).
- Lock reuse rules: e.g., every pillar post =
1 long-form + 3 short videos + 5 social posts + 1 newsletter.
- Repurposing cadence templates and time estimates (setup: 4–8 hours)
- Weekly cadence: 1 new blog →
3 social slices,1 short video,1 newsletter blurb. - Quarterly cadence: refresh top 10 pillar posts with updated data and a long-form video.
- Time estimate for setup: initial audit + calendar = ~8–16 hours for a 50–post catalog; ongoing maintenance = 2–4 hours/week.
Platform-format mapping for repurposing decisions
Table: Section Content — Platform, Recommended Formats, Optimal Frequency & more
| Platform | Recommended Formats | Optimal Frequency | Best Post Length/Specs |
|---|---|---|---|
| Reels, carousel, captioned image | 3–5/week | Reels 15–60s; carousel 5–10 slides; captions 100–300 chars | |
| Long post, article, document carousel | 3–5/week | Text post 150–300 words; articles 800–1,500 words; carousel 5–8 slides | |
| Twitter/X | Thread, short video, link tweet | 1–3/day | Thread 5–10 tweets; video ≤2m20s; 71–100 chars for max engagement |
| TikTok | Short-form video, duet/stitch, teasers | 3–7/week | 15–60s vertical; strong hook in first 3s; captions 50–100 chars |
| Native video, link post, short text | 3–5/week | Video 1–3 minutes; text 40–80 words; link previews optimized |
Practical examples
- Example — Pillar blog to TikTok: Extract 6 hooks → script three 30s clips → publish across two weeks.
- Example — Case study to LinkedIn: Convert results into a 6-slide carousel + long-form post summarizing methodology.
Troubleshooting
- If engagement drops, rotate formats and test new hooks for one content block before overhauling the calendar.
- If production becomes a bottleneck, automate scheduling and use templates for faster output.
Understanding these principles helps teams move faster without sacrificing quality. When implemented, the calendar-and-rules approach converts single posts into predictable, multichannel campaigns that scale.
Step 3 — Choose and Configure an Automation Tool
Choose a tool that fits the team’s technical capacity and the content cadence. For teams that need quick wins, pick a beginner-friendly SaaS scheduler. For editorial pipelines that require complex logic, choose an API-first platform or build a microservice stack.
For integrated teams that want content, CRM, and analytics together, an all-in-one marketing suite reduces point-tool friction. Select and configure the tool so tracking, permissions, and content templates are set once and inherited across the pipeline — that prevents rework and data fragmentation.
How to shortlist and pick
- Define selection criteria — Integration depth, authentication model (OAuth/API key), scheduling granularity, analytics and UTM support, team permissions, price vs expected ROI.
- Score three to five candidates — prioritize tools that already integrate with the CMS, analytics, and ad platforms the team uses.
- Pilot with a single channel — run a 2–4 week pilot to validate posting reliability, media handling, and reporting.
Step-by-step initial configuration (practical)
- Create an admin account and set team roles and least-privilege permissions.
- Connect primary social accounts using OAuth where possible; record refresh token policies.
- Set global defaults:
UTM_source=social,UTM_medium=organic, campaign naming template, and a default CTA that maps to page campaign parameters. - Import content calendar CSV or connect the CMS webhook to auto-ingest drafts.
- Configure scheduling windows and posting cadence rules per channel.
- Enable analytics connections (GA4, Facebook Conversions API) and map campaign/UTM fields.
- Test three live posts and confirm timestamps, image cropping, link behavior, and tracking appear correctly in analytics.
Developer notes for API configuration
- Authentication: Prefer OAuth 2.0 for social platforms; store refresh tokens securely.
- Rate limits: Implement exponential backoff for 429 responses; log throttling for audit.
- Webhooks: Subscribe to media-processing and account-notification events to sync status.
- Idempotency: Use
idempotency_keyon POSTs to prevent duplicate publishing. - Error handling: Surface actionable errors to editors (e.g., “image too large”, “link blocked”).
Scaleblogger.com can plug into this stage to automate content ingestion and UTM defaults, especially when building topic clusters or automating SEO scoring.
3 representative automation tool profiles by feature set
| Tool Example | Best for | Key Engagement Features | Cost Range |
|---|---|---|---|
| Buffer | Beginner-friendly Saaulers | Queue scheduling, basic analytics, image optimization | Free tier; paid from $6/month |
| Hootsuite | Enterprise social teams | Team workflows, content approvals, in-platform analytics | Plans typically $99+/mo |
| Zapier | Non-developers needing integrations | Connector library, multi-step zaps, webhook triggers | Free tier; paid from $19.99/mo |
| Make (Integromat) | API-first automation flows | Visual scenarios, HTTP modules, JSON parsing | Free tier; paid from $9/mo |
| HubSpot | All-in-one marketing + CRM | Content publishing, CRM integration, attribution reporting | Starter plans from $50/mo |
| Huginn (open-source) | Self-hosted automation | Custom agents, webhooks, event chains | Self-hosted; infrastructure costs variable |
| SocialBee | Small teams & agencies | Category-based scheduling, repost libraries | Plans from $19/mo |
| Sprout Social | Mid-to-enterprise analytics | Advanced reporting, social listening, publishing | Plans typically $99+/user/mo |
| Loomly | Content collaboration | Post ideas, approval workflows, asset management | Plans from $25/mo |
| IFTTT | Simple triggers | Consumer-level automations, basic webhooks | Free tier; Pro from $3.99/mo |
Understanding these configuration principles helps teams move faster without sacrificing quality. When implemented correctly, this stage locks in reliable tracking and governance so content performs and the team spends more time creating.
Step 4 — Create Engagement-Optimized Content and Templates
Prerequisites: access to audience analytics, content calendar, and basic creative assets (logo, brand colors, fonts). Tools / materials needed: social analytics (native or GA4), a headline tester, asset library, and an automation tool or CMS (consider AI content automation from Scaleblogger.com to speed templates and publishing). Expected time: 2–4 hours per template set; 1–2 hours per asset once templates are live.
Begin by defining what “engagement” means for each channel. This could be clicks, saves, replies, watch time, or shares. Then build repeatable templates that encode those goals into captions, CTAs, thumbnails, and briefs. Use short experiments to validate tone and length per platform, then bake winners into templates.
- Build caption and CTA templates
- Create 6–8 variations per platform: value-led, curiosity, social proof, question, numeric list, and quick tip.
- Include a primary CTA and a secondary micro-CTA in each template.
- Store templates in a shared doc or your CMS as
caption_v1,caption_question_v2, etc.
- Create creative briefs for designers and video editors
- Define objective, audience, deliverables, primary hook (first 3 seconds), and runtime limits.
- Supply sample opening-frame text and three thumbnail options.
Practical caption, CTA, and brief rules:
- Short-first rule: Keep the lead sentence ≤12 words on mobile feeds.
- Action pairing: Pair a verb CTA with a benefit (e.g., “Read — learn X in 90s”).
- Thumbnail primacy: Thumbnails must show one face, high contrast, and a 3-word overlay.
Example caption template (copy-ready)
[Hook] — [Value promise in 1 line]. [Social proof]. [Primary CTA: Read/Watch/Save] [Secondary micro-CTA: comment your X]Checklist for an engagement-ready post
- Hook: Strong within first 3 seconds or first sentence. Visual: High-contrast thumbnail, readable text at 1080×1080. Caption: One-line hook + 1–2 supporting lines + CTA.
- CTA: Clear, single action. Timing: Post when audience activity peaks.
Caption and CTA template library by platform
| Platform | Caption Template | CTA Type | When to Use |
|---|---|---|---|
| Twitter/X | “3 quick tips to X → #1 will surprise you. Thread👇” | Thread / reply CTA | Fast news, quick tips |
| Instagram Feed | “Struggled with X? Try this method → save for later ✨” | Save / comment CTA | Evergreen how-tos |
| LinkedIn Post | “We cut churn by 12% using X method — here’s the playbook.” | Read / discuss CTA | B2B case studies |
| TikTok Short | “Stop doing X. Do this instead — 15s demo. Watch till end” | Watch / duet CTA | High-energy demos |
| Facebook Post | “This simple checklist helped our team ship faster. Link inside.” | Share / click CTA | Community updates, long-form |
Understanding these principles helps teams move faster without sacrificing quality. When implemented correctly, this approach reduces overhead by making decisions at the team level.
Step 5 — Schedule, Test, and Iterate with A/B Experiments
Run targeted A/B experiments on timing, creative, and CTAs to turn guesses into reliable actions. Start with a clear hypothesis, schedule variants so each gets comparable exposure, and treat the test as a learning loop: test → measure → update the schedule or creative. Hypothesis-driven design reduces noise and accelerates confident changes to publishing cadence and creative playbooks.
- Prerequisites (10–15 minutes)
- Data readiness: export last 30–90 days of platform analytics.
- Baseline metrics: record current CTR, engagement rate, and conversion rate.
- Tools: A/B testing tool or platform native experiments, spreadsheet, and analytics dashboard (GA4, native social analytics).
- Variant creation and scheduling (20–40 minutes)
- Define hypothesis: e.g., “Short captions increase CTR on LinkedIn.”
- Create 2–3 variants: keep one control, change only a single element per test.
- Schedule evenly: distribute by hour/day to avoid time-of-day bias.
- Sample size rule of thumb: Recent research indicates to aim for at least 1,000 impressions per variant for social posts; for landing pages, target 1,000–5,000 visitors or use a sample-size calculator to compute required
p-valuesensitivity.
- Minimum duration and stopping rules
- Short tests: 7–14 days for social posts to capture weekday/weekend patterns.
- Longer tests: 2–4 weeks for email and landing-page experiments.
- Stop rule: run until sample-size threshold reached or results are stable for 48–72 hours.
- How to interpret and act on results
- Significant lift (>5% and
p < 0.05): roll variant into schedule and A/B test a new variable. - Small, consistent lift (2–5%): consider combined tests across channels before full roll-out.
- No lift or negative result: keep the control, document insights, and pivot hypothesis.
Expected outcomes: clearer posting schedule, measurable CTA language that moves conversions, and creative formats with higher engagement.
A/B test plan template with timelines and success criteria
| Test Name | Hypothesis | Variants | Duration | Primary Metric |
|---|---|---|---|---|
| Caption length test | Short captions increase CTR vs long captions | Short (≤100 chars) vs Long (≥250 chars) | 14 days | CTR |
| CTA phrasing test | Action verbs drive more conversions than passive CTAs | "Download" vs "Learn more" vs "Read" | 14 days | Conversion rate |
| Posting time test | Morning posts outperform evening posts on engagement | 9am vs 3pm vs 8pm local | 10 days | Engagement rate |
| Creative thumbnail test | Faces in thumbnails increase view-through | Face vs Product-only vs Abstract | 14 days | View-through rate |
| Hashtag cluster test | Niche tags produce higher reach quality than broad tags | Niche 5 vs Broad 5 vs Mixed | 14 days | Reach-to-engagement ratio |
com/blog/7-key-metrics-to-benchmark-your-content-performance-in-2025-2/" class="internal-link">Scaleblogger’s automated scheduling and benchmarking can fold these experiments into ongoing pipelines to scale wins across multiple topics and channels.
Understanding these principles helps teams move faster without sacrificing quality. When implemented correctly, this approach reduces overhead by making decisions at the team level.
Step 6 — Monitor, Respond, and Automate Engagement Signals
Start by treating engagement as a measurable workflow: capture signals, classify urgency, and route to either automated processes or a human-in-the-loop. Automate repetitive, low-risk interactions and reserve human attention for nuance, escalation, and relationship-building. That balance reduces response times while preserving brand safety and empathy for complex issues.
- Set prerequisites
- Access: Connect social APIs (Twitter/X, Meta, LinkedIn), CRM, and shared inboxes.
- Tools: Use a monitoring platform (native dashboards, Sprout Social, or an AI content automation system such as
Scaleblogger.comfor pipeline orchestration). - Team roles: Assign owners for Tier 1 (ops), Tier 2 (product/Legal), and Tier 3 (executive/PR).
- Configure monitoring and alerts
- Create saved searches for brand mentions, product keywords, and high-intent phrases.
- Assign severity tags:
low(praise),medium(generic questions),high(product failure),critical(misinformation, legal risk). - Set alert thresholds: immediate push for
critical; hourly digest formedium; daily summary forlow.
- Build human-in-the-loop response workflows
- Saved replies: Draft templates for common queries, but require human review for personalization when severity ≥
medium. - Auto DMs: Use auto DMs for onboarding flows and ticket creation only — never for crisis routing.
- Escalation matrix: Route by severity: Tier 1 resolves
low/mediumwithin 4 hours; Tier 2 handleshighwithin 2 hours; Tier 3 engages forcriticalwithin 30 minutes.
Automation vs. human response decision matrix
Automation vs. human response decision matrix
| Engagement Signal | Automate? (Yes/No) | Recommended Action | SLA/Owner |
|---|---|---|---|
| Simple DM queries | ✓ | Auto-reply with FAQ + ticket link | 4 hrs / Ops Team |
| Product complaints | ✗ | Create ticket, notify product + CSR | 2 hrs / Product Owner |
| Praise/positive comments | ✓ | Auto-like + short thank-you reply | 24 hrs / Community Ops |
| Potential crises or misinformation | ✗ | Immediate human review, PR + Legal loop | 30 mins / PR Lead |
| Influencer collaboration requests | ✗ | Route to partnerships for vetting | 48 hrs / Partnerships Manager |
Practical examples and tips
- Example: Set a trigger that creates a Zendesk ticket when “refund” + product SKU appears, then message the user acknowledging receipt within 30 minutes.
- Tip: Test saved replies quarterly to avoid stale information and awkward personalization.
- Warning: Avoid over-automation for community-building channels — relationships degrade when responses feel robotic.
Understanding these principles helps teams move faster without sacrificing quality. When implemented correctly, this approach reduces overhead by making decisions at the team level.
Troubleshooting Common Issues
Begin by confirming basic signals: account access, API keys, and connection health. Most automation failures trace to credential expiry, permission changes, rate limits, or mismatched scheduling windows. Treat the system like a networked pipeline—validate inputs, inspect transit, and verify destination behavior.
Prerequisites and tools
- Prerequisite: Admin access to the automation tool and target social account.
- Tooling: access to platform status pages, API logs, CSV export of recent posts, and an HTTP client like
curlor Postman. - Outcome expected: ability to reproduce the failure, capture an error code or timestamp, and isolate whether the fault is local (tool), platform (social API), or content-related.
Quick diagnostics (3 practical checks)
- Check recent job logs for error codes and timestamps. Note repeating error patterns.
- Confirm API key validity and OAuth scopes. A missing
publishscope is a common silent failure.
- Test a manual publish from the platform UI to rule out account-wide blocks.
Step-by-step fixes for common problems
- Post failed to publish: Revoke and reissue OAuth token, retry the single job, and inspect the error body for
403or429. If the platform returns403, review account permissions. Analytics data mismatch: Reconcile timezones and attribution windows; compare raw event IDs and usecreated_attimestamps rather than ingestion time.
- Low engagement after automation: Rotate templates, randomize post times, and add native media—platform algorithms deprioritize repetitive, identical content. Account rate-limited: Implement exponential backoff and queue retries; add
Retry-Afterheader handling. Duplicate or overlapping posts: Deduplicate by storing acontent_hashand skip scheduling when a match exists.
Practical example — verify webhook delivery
bash curl -i -X POST https://your-callback.url/webhook \ -H "Content-Type: application/json" \ -d '{"event":"post_published","id":"abc123"}'200, the endpoint is healthy; if it returns 5xx, inspect server logs and response timings.
Table: Section Content — Issue, Likely Cause, Immediate Fix & more
| Issue | Likely Cause | Immediate Fix | Preventive Action |
|---|---|---|---|
| Post failed to publish | OAuth expired / missing scopes | Re-authenticate account; retry job | Rotate tokens every 90 days; monitor expiry |
| Analytics data mismatch | Timezone or attribution window differences | Reconcile timezones; compare raw IDs | Standardize reporting timezone; use event IDs |
| Low engagement after automation | Repetitive templates; poor timing | A/B test creative; reschedule posts | Maintain content variety; use engagement windows |
| Account rate-limited | Hitting API quota or burst limits | Backoff and reschedule; batch retries | Implement exponential backoff; monitor quotas |
| Duplicate/overlapping posts | Race conditions in scheduler | Cancel duplicate job; remove duplicate entries | Use content_hash dedupe; centralize scheduler |
When to contact platform support or the vendor
- Contact the social platform when error codes indicate account suspension, legal takedown, or undocumented
5xxbehavior. - Contact the automation vendor when job logs show internal exceptions, task queue corruption, or missing audit trails.
- Use incident context: timestamp, job ID, exact error response, and a minimal reproducible example.
Understanding these troubleshooting patterns reduces mean time to resolution and keeps teams focused on improving content quality rather than firefighting infrastructure. When implemented correctly, this approach reduces repetitive failures and makes automated publishing dependable.
Tips for Success and Pro Strategies
Think of each piece of content as an experiment. Create it to test one idea about audience behavior, and then expand what works well. Successful teams combine rigorous A/B testing, repeatable creative frameworks, and distribution playbooks that prioritize velocity and measurement over perfection. Focus on small, measurable bets—a headline variant, a new format (short video or interactive chart), or a different distribution channel—and double down when metrics validate impact.
Pro-level testing and scaling tactics
Design tests with selectable outcomes and clear success thresholds so decisions are fast and objective.- Define the hypothesis, metric, and success threshold (e.g., improve
CTRby 15%). - Create 2–3 variants that change only one variable (headline, thumbnail, excerpt).
- Run the test across comparable audiences and collect at least 1,000 impressions or a statistically meaningful sample.
- Structured experiments: keep tests isolated and repeatable.
- Automated rollouts: use pipelines that promote winning variants automatically.
- Scale triggers: set quantitative rules for promotion (time-on-page > X and conversion lift > Y).
Creative and distribution hacks
Move beyond publishing and broadcasting—engineer distribution.- Repurpose headlines: extract 3 headline styles from each post for search, social, and newsletters.
- Micro-formats: convert long posts into 60–90s explainer videos and 3–5 tweet threads.
- Channel-tailored hooks: match opening lines to platform-native behavior.
Collaboration and UGC strategies
other creators and your audience to amplify trust and reach.- Contributor capsules: invite industry practitioners to submit 400–600 word perspectives.
- UGC prompts: publish a weekly question that encourages replies and highlights top responses.
- Editorial curation: stitch UGC into evergreen posts to refresh content without full rewrites.
How to measure and scale successful tactics
Track both velocity and efficiency, then create automation around high-ROI steps.- Primary metrics: engagement rate, assisted conversions, and content-attributed revenue.
- Secondary metrics: time-to-publish, iteration count, and content cost-per-lead.
- Automation: use AI content automation and
content-scoring frameworksto prioritize refreshes.
> Industry analysis shows that teams that automate repetitive tasks publish more consistently and capture more organic traffic over time.
Practical asset suggestions: create a checklist for testing, a content-playbook table, and an automation recipe for promotion. Consider tools that let you build topic clusters and predict performance; for teams scaling fast, using an AI-powered SEO tool like Scaleblogger.com to automate parts of the pipeline accelerates repeatability. Learn how to automate your blog workflows with AI content automation at https://scaleblogger.com.
Understanding these approaches makes it easier to increase output without losing quality. When implemented with discipline, they turn small experiments into predictable growth engines.
📥 Download: Social Media Automation Checklist (PDF)
Measuring Success and Continuous Optimization
Start measurement immediately and make iteration the routine: set a clear cadence, instrument dashboards that answer the same questions at each cadence, and convert observed performance gaps into concrete automation rule changes. Measurement is not a one-off audit; it’s a feedback loop that feeds content scoring, publishing cadence, and creative prompts back into the content pipeline. Practical success looks like repeatable dashboards, weekly micro-experiments, and automated rules that reduce manual checks.
Daily → Quarterly cadence and responsibilities
What to track each cadence and who owns it.Reporting cadence with tasks and owners — social media automation reporting cadence
| Cadence | Task | Metrics to Check | Owner |
|---|---|---|---|
| Daily | Monitor scheduled posts and delivery | Impressions, Engagement rate, post errors |
Social Media Ops |
| Weekly | Performance snapshot and anomaly detection | CTR, Shares, top-performing posts |
Performance Analyst |
| Monthly | Content funnel review and audience growth | Followers, Traffic to blog, Leads attributed |
Content Manager |
| Quarterly | Strategic content review and A/B test planning | Conversion rate (CVR), LTV by cohort, channel ROI |
Head of Content |
| Ad-hoc incident review | Post-mortem on outages/viral spikes | Time-to-recover, causation, mitigation effectiveness | Incident Lead / Ops Manager |
Convert insights into updated automation rules
- Identify repeatable patterns from dashboards (e.g., posts with images underperform on Tuesdays).
- Translate pattern into rule logic (
if day == Tuesday and image_type == X then recommend template Y). - Test the rule on a subset using
feature-flaggeddeployment. - Roll out and monitor differential performance over two cycles.
Practical example: if weekly reports show a consistent drop in CTR for certain headlines, create an automation that generates 5 headline variants and schedules A/B tests automatically.
> Some industry analyses suggest that continuous measurement with automation may reduce manual intervention and improve time-to-insight.
Automated reporting setup tips: push daily summaries to Slack, use scheduled CSV exports for BI tools, and store decision logs for every automated rule change. Tools like an AI-powered content pipeline can handle the repetitive orchestration while the team focuses on hypothesis-driven changes. When measurement and automation are aligned, decisions move from opinion to evidence, freeing teams to scale creative experimentation.
Conclusion and Next Steps
Begin by establishing a straightforward, measurable process that turns ideas into published content within 48 hours. Focus on a repeatable pipeline: brief, draft, SEO pass, and then schedule. That discipline converts backlog into momentum and makes performance signals actionable.
Over the next 90 days, the objective shifts from speed to refinement: stabilize cadence, iterate on formats that drive engagement, and instrument measurement so decisions are data-driven rather than guess-driven.
Quick-start checklist (first 48 hours)
- Create a minimum template: standard title, meta, brief, CTA. Set one channel cadence: pick primary social network and schedule three posts. Run a lightweight SEO pass: target one primary keyword and add internal link.
- Instrument tracking: ensure UTM parameters and
analyticsevents are in place. Assign ownership: one editor and one distribution owner.
- First, build a single
editorial calendarentry and publish one post with social push. - Then, automate distribution to one platform and measure engagement for seven days.
- Next, capture learnings, tweak the template, and repeat weekly.
> "Automation frees creators to focus on strategy, not repetitive tasks."
Concrete success criteria and how to recognize them
- Cadence established: multiple assets published per week without bottlenecks — visible in the calendar. Audience signal: steady comments or shares on social posts indicating relevance. Operational efficiency: time-to-publish drops and hand-offs are documented.
- Performance baseline: first set of posts produces measurable engagement, allowing A/B testing. Scalability readiness: team can add a new topic with <2 hours onboarding.
30/60/90 day implementation roadmap (social media automation roadmap)
| Timeframe | Goal | Key Actions | Success Metric |
|---|---|---|---|
| First 48 hours | Launch pipeline | Publish 1 post; set schedule; add UTMs | Publish cadence active |
| First 30 days | Stabilize cadence | Publish weekly; automate posting; baseline metrics | Consistent weekly posts |
| 60 days | formats | Run A/B on headlines; repurpose top post | Engagement patterns identified |
| 90 days | Scale topics | Build topic clusters; delegate workflows | Repeatable onboarding process |
| Ongoing maintenance | Continuous improvement | Monthly audits; update templates; benchmark | Sustained engagement growth |
predict your content performance. Understanding and applying these steps reduces operational drag and makes growth predictable.
Conclusion
After walking through the mechanics of turning publishing from a manual chore into a growth lever, the path forward is clear: automate repetitive distribution tasks, measure signal-rich metrics, and reallocate time to creative testing. Teams that automated social posting and content repurposing in the examples above regained hours each week and doubled the cadence of A/B tests, which translated into faster audience learning. If you’re wondering how quickly this pays off or what to automate first, start with scheduled social pushes and headline testing — those deliver measurable lifts within a few weeks and free up capacity for bigger experiments.
For teams ready to scale these practices, take two concrete next steps: audit current publishing steps and map which tasks are repeatable, then pilot automation on one channel for 30 days to capture baseline vs. improved performance. com/resources).
com) is a practical next step.
