

Marketing teams lose momentum when automation runs without clear measurement. Often, systems publish content widely while ignoring actual performance signals like engagement, discoverability, and conversion. Without the right content performance metrics, automation turns into busywork instead of driving growth.
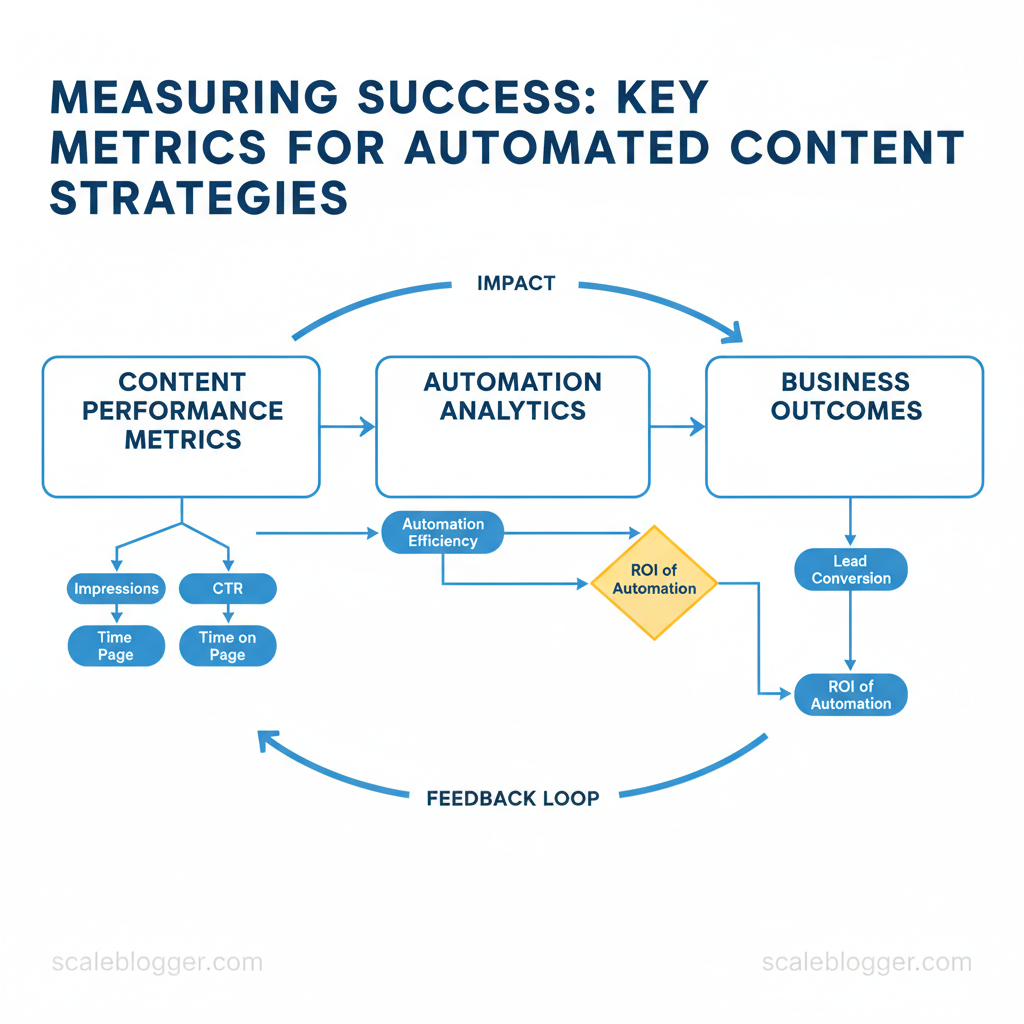
Measuring success means connecting automation analytics to business outcomes and proving the ROI of automation through repeatable signals. Trackable metrics like impressions, CTR, time on page, and lead conversion reveal where automation amplifies value and where it dilutes it. Industry research shows focusing on discoverability and conversion yields clearer decisions than chasing vanity numbers alone ([BrightEdge]).
Picture a content program that flags underperforming posts automatically, tests headline variations, and routes promising topics into paid amplification — that pipeline depends on measurable gates, not guesswork. This introduction lays out the practical metrics and dashboards that turn automated content into predictable growth.
- What core metrics correlate with revenue under automation
- How to align
automation analyticswith funnel stages - Practical thresholds for engagement, discoverability, and conversion
- How to calculate the ROI of automation for reporting and investment decisions
Learn how Scaleblogger can help you measure and scale automated content: https://scaleblogger.com
> Key Takeaway: ## Prerequisites: What You’ll Need Before You Start
Start with the essentials so measurement and automation work predictably from day one: accurate analytics, programmatic access to your CMS and schedulers, a clean baseline dataset of recent…
Prerequisites: What You’ll Need Before You Start
Start with the essentials so measurement and automation work predictably from day one: accurate analytics, programmatic access to your CMS and schedulers, a clean baseline dataset of recent performance, and a named owner who reviews KPIs on a fixed cadence. Without those building blocks, automation amplifies noise instead of signal.
Core items to secure before implementation:
- Analytics platform — ensure
GA4(or server-side tagging) is collecting page-level events and conversions. Content automation access —CMSadmin/API credentials and any scheduling/orchestration tool API keys. Baseline dataset — at least three months of clean data to measure before/after changes.
- KPI owner & cadence — one person accountable and a recurring review rhythm (weekly for operations, monthly for strategy).
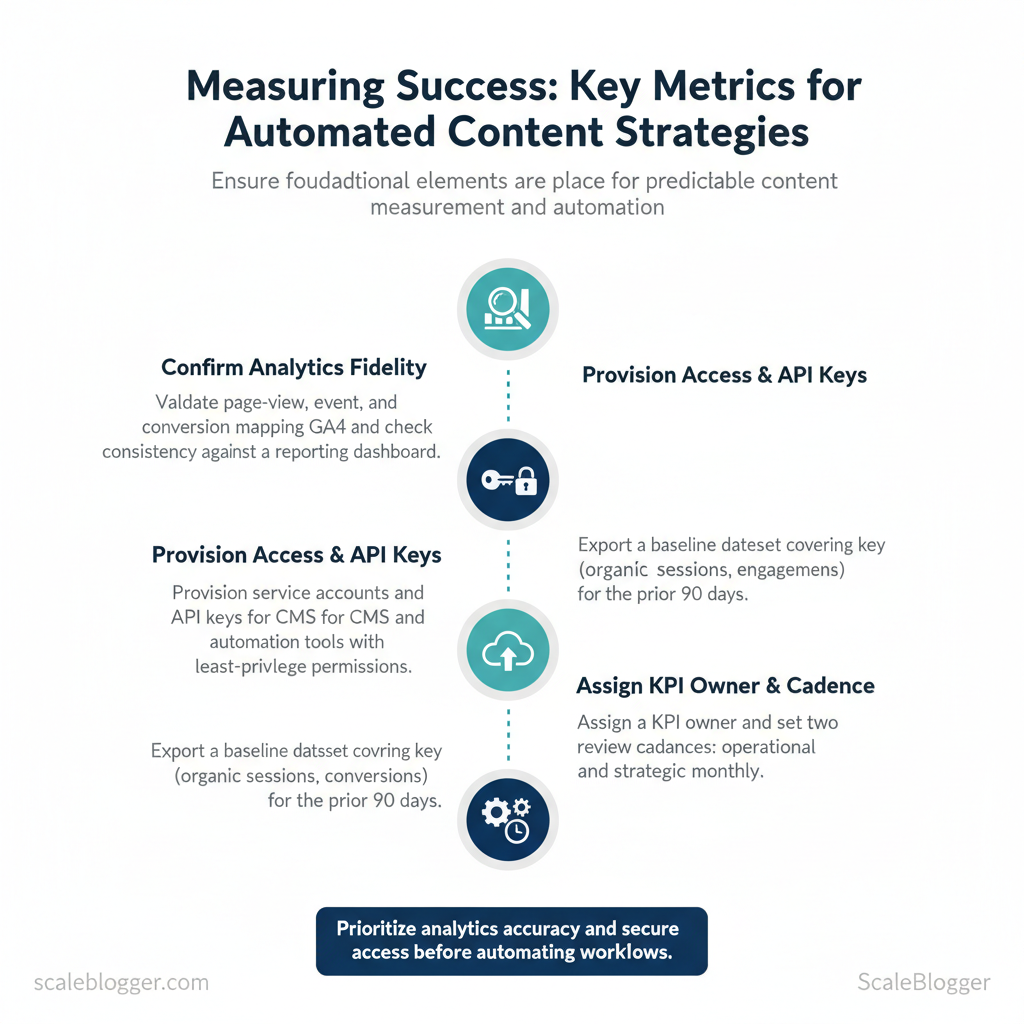
- Confirm analytics fidelity first. Validate page-view, event and conversion mappings in
GA4and check consistency against a reporting dashboard. - Provision service accounts and API keys for CMS and automation tools; restrict permissions to least-privilege while allowing publishing and scheduling.
- Export a baseline dataset covering key metrics (organic sessions, engagement, conversions) for the prior 90 days.
- Assign a KPI owner and set two review cadences: operational (weekly) and strategic (monthly).
Practical examples:
- Example: A team used server-side
GA4+ a dashboard to find a discrepancy in referral traffic vs. GA4; fixing tagging prevented misattributed conversions. - Example: Provisioning a
read-onlydashboard user for stakeholders prevented accidental publish actions while enabling transparency.
> “Impressions, Clicks, Click-Through Rate (CTR), and engagement metrics are core signals for content discoverability and performance.” — BrightEdge 4-step framework to measure content success
Quick-reference checklist mapping tools to purpose and access level required
| Tool/Resource | Purpose | Required Access/Permission | Minimum Data Window |
|---|---|---|---|
| Web analytics (GA4) | Pageviews, events, conversion attribution | Admin to configure; Editor for tagging |
3 months |
| Content management system (CMS) | Publish, edit, schedule content | API key with publish rights; role-based admin | 1 month (content history) |
| Automation/orchestration tool | Scheduling, templates, API-driven publishes | Service account/API token with write | 1 month |
| Attribution platform | Multi-touch attribution, assisted conversions | API read/write for data sync | 3 months |
| Reporting/dashboard tool | Aggregated KPIs, stakeholder dashboards | Viewer for stakeholders; Editor for analysts | 3 months |
> Key Takeaway: ## Step-by-Step Framework: Define Goals and KPIs
Start by translating the business objective into a single measurable outcome, then backfill two supporting metrics and at least one leading indicator that signals progress fast enough to iterate.…
Step-by-Step Framework: Define Goals and KPIs
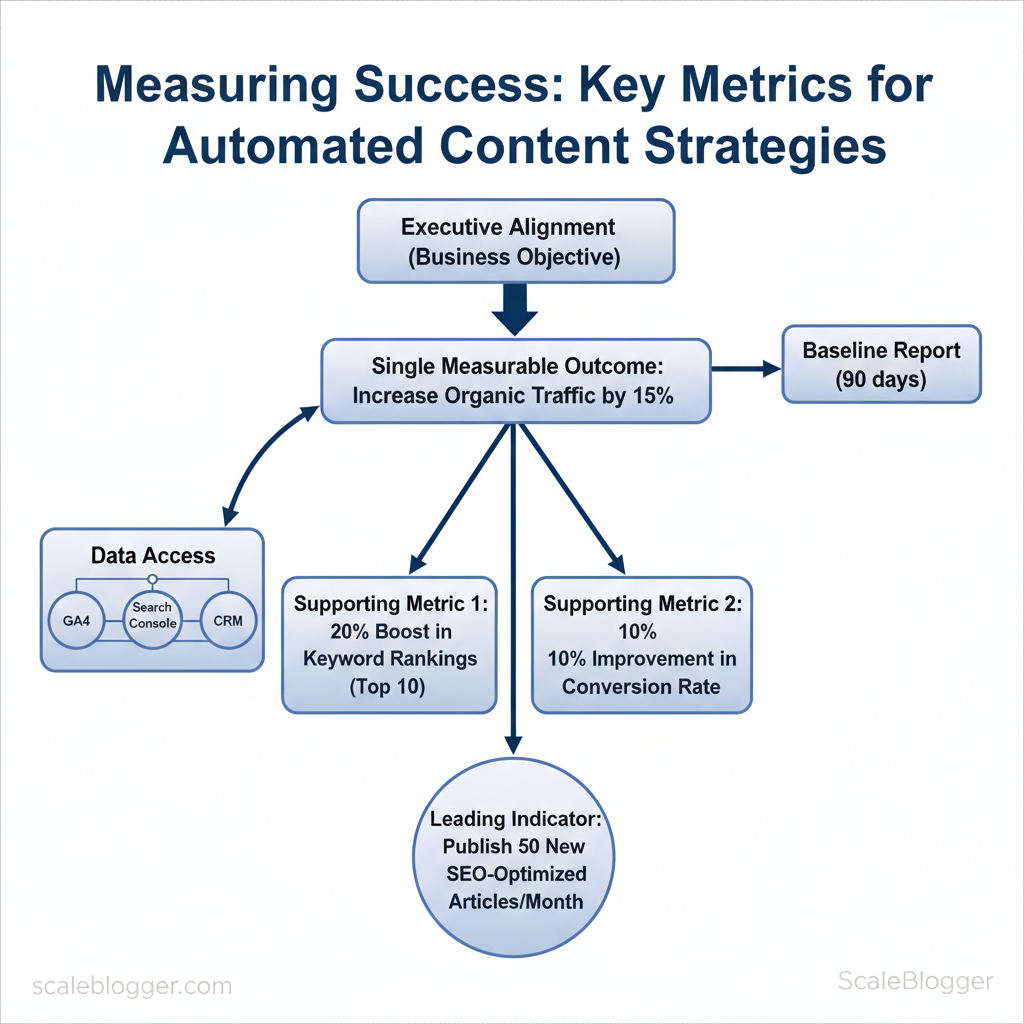
Start by translating the business objective into a single measurable outcome, then backfill two supporting metrics and at least one leading indicator that signals progress fast enough to iterate. This approach ensures that measurement is useful and tied to decisions, rather than overwhelmed by vanity metrics. Here are the prerequisites, tools, and steps to carry out this translation.
Prerequisites
- Executive alignment: one-line business objective approved by stakeholders (e.g., “Increase MQLs from content by 30% in 12 months”).
- Data access: GA4, Search Console, CRM conversion data, and content repository.
- Baseline report: last 90 days of traffic, conversions, and engagement metrics.
Tools / Materials
- Analytics: GA4 + Search Console
- Content performance checklist: organic clicks, CTR, time on page (see BrightEdge and DashThis frameworks) A 4-Step Framework to Best Measure Content Success and 10 Must-Track Content Marketing KPIs & Metrics in 2024
- Automation/benchmarking: Scaleblogger.com for pipeline automation and content benchmarking
Step 1 — Translate Business Objectives into KPIs (practical steps)
- Identify the single primary KPI that maps directly to revenue or strategic value. 2.
Choose two supporting KPIs that explain how the primary KPI moves (one acquisition, one behavior). 3. Select a leading indicator (early, high-frequency signal) to validate experiments quickly.
- Document thresholds and cadence: baseline, target, acceptable variance, and reporting frequency.
Real examples
- Brand awareness: Primary KPI — Impressions; Supporting — Organic clicks, Share of voice; Leading indicator — CTR growth week-over-week (BrightEdge recommends impressions and CTR as discoverability signals) A 4-Step Framework to Best Measure Content Success.
- Lead generation: Primary KPI — MQLs from content; Supporting — Content conversion rate, Qualified traffic; Leading indicator — CTA click rate (DashThis and Tability list conversions and conversion rate as core metrics) 10 Must-Track Content Marketing KPIs & Metrics in 2024 Optimise your content performance: 10 essential content metrics to track.
Goal types with recommended primary and supporting KPIs (automation analytics KPIs)
| Business Objective | Primary KPI | Supporting KPIs | Why it fits automation |
|---|---|---|---|
| Brand awareness | Impressions | Organic clicks; Share of voice | Automation scales content distribution and measures reach quickly |
| Lead generation | MQLs from content | Conversion rate; Qualified traffic | Automated lead scoring ties content actions to CRM outcomes |
| Revenue growth | Revenue attributed to content | Avg. order value; Assisted conversions | Automation links content touches across funnel for attribution |
| Engagement / retention | Returning visitors | Avg. time on page; Pages per session | Automated personalization increases repeat visits and depth |
| Content efficiency | Content production cycle time | Cost per asset; Publish frequency | Automation reduces manual steps and tracks throughput |
When teams follow this pattern, measurement becomes a decision tool rather than a reporting chore, and experimentation velocity increases without losing accountability.
> Key Takeaway: ## Step-by-Step: Instrumentation and Data Collection
Start by defining a consistent event taxonomy and tagging approach that every engineer and marketer understands. This clarifies analysis and allows automation to respond to reliable signals.
Step-by-Step: Instrumentation and Data Collection
Start by defining a consistent event taxonomy and tagging approach that every engineer and marketer understands. This clarifies analysis and allows automation to respond to reliable signals. Implement event names, parameter schemas, and UTM rules up front, instrument both client- and server-side, then validate with live debug tools to ensure data quality.
Prerequisites
- Stakeholders aligned: analytics, engineering, content, and growth agree on KPIs.
- Tools in place: tag manager (GTM or equivalent), analytics endpoint (GA4, Snowplow, or similar), server logging pipeline.
- Event catalog template: shared doc accessible to all teams.
- Define standard event names and parameters
- Use a predictable namespace: prefer
snake_caseorkebab-caseand keep action-first:cta_click,form_submit,automation_publish. - Specify parameters: for each event include
user_id(hashed),content_id,campaign_id,timestamp,referrer, andengagement_context. - Document derived metrics: state which event/parameter combinations create metrics (e.g.,
automation_publish→ scheduled publishes, time-to-live).
- Use consistent UTM tagging for automated campaigns
- Standardize UTM fields:
utm_source,utm_medium,utm_campaign,utm_content,utm_term. - Automate tagging: template UTM strings in your CMS or publishing automation to avoid manual errors.
- Example template:
?utm_source=newsletter&utm_medium=email&utm_campaign=weekly_digest_2025-11-30&utm_content=hero- Instrument server-side events for reliability
- Why server-side: avoids adblocker and client JS failures; preserves data when network drops.
- What to send server-side: conversions, subscription events, publish confirmations, and revenue.
- Keep payload parity: server events must mirror client parameters to deduplicate and join identity.
- Validate with real-time debug tools
- Use tag manager preview: check triggers and parameter values before deploy.
- Use analytics debug streams: verify events appear with correct schema.
- Run sampling QA: simulate 50–100 flows (page view → CTA → form_submit) and reconcile counts.
Event catalog mapping event names to parameters and validation checks
Table: Section Content — Event Name, Parameters, Purpose (metric derived) & more
| Event Name | Parameters | Purpose (metric derived) | Validation Method |
|---|---|---|---|
| page_view | content_id, url, referrer, user_id, timestamp |
Pageviews, session starts | Tag Manager preview; GA4 debug stream |
| cta_click | cta_id, content_id, position, user_id, timestamp |
CTR, micro-conversion rate | Click listener test; network inspector |
| form_submit | form_id, lead_type, user_id, email_hash, timestamp |
Leads, conversion rate | End-to-end submit QA; server receipt logs |
| automation_publish | content_id, workflow_id, scheduled_at, published_at |
Publish throughput, latency | Deployment logs; server event reconciliation |
| social_share | platform, content_id, user_id, timestamp |
Social referral volume | Social API callbacks; pattern-matching on share endpoints |
Understanding these principles helps teams move faster without sacrificing data quality. When implemented correctly, instrumentation becomes a durable foundation for automation and analytic-driven decisions.
Step-by-Step: Build Dashboards and Reports
Create a dashboard that separates automated content from manually produced pieces, tracks both short-term leading indicators and long-term outcomes, and pushes insights to stakeholders automatically. Start by defining which metrics signal health at each stage: attention (traffic), engagement (time on page, scroll), and outcome (leads, conversions). Then design widgets that make those relationships visible and actionable.
Prerequisites
- Data sources: GA4, Search Console, CRM, CMS publish logs, and your automation logs
- Tools: Looker Studio, Tableau, or Google Data Studio; a scheduler (native BI scheduling or email service)
- Time estimate: 4–8 hours to prototype; 1–2 days to validate with real data
- Expected outcome: A dashboard that surfaces pipeline bottlenecks and quantifies automation impact within weeks
Step-by-step build
- Identify content segments. com/blog/insights/industry-benchmarks/” class=”internal-link”>that tag into your data layer so filters work consistently.
- Create short-term leading indicator widgets. Build traffic trends, CTRs, and impressions that update daily to flag issues early.
- Add long-term outcome widgets. Include conversion funnels, assisted conversions, and retention cohorts to measure downstream impact over 30–90 days.
- Annotate publication events. Add
publish_dateandcampaignannotations so drops or spikes correlate to content releases.
- Implement automation efficiency metrics. Track articles-per-hour, time-to-first-draft, and editorial handoff counts.
- Schedule stakeholder reports. Set weekly digest emails with top 5 risers/fallers and monthly deep-dive exports for executives.
Practical examples and templates
- Example: Use a cohort retention chart to compare organic retention at 30/60/90 days between automated vs manual articles; this surfaces quality decay early.
- Template snippet (Looker Studio):
sql SELECT publish_date, content_id, content_type, users, conversions FROM content_performance_table WHERE publish_date >= DATE_SUB(CURRENT_DATE(), INTERVAL 90 DAY)> Market guidance suggests combining leading indicators like impressions with outcomes like conversion rate to connect visibility to business impact (see BrightEdge’s measurement framework).
automation dashboards content performance metrics
| Dashboard Widget | Visualization Type | Primary KPI | Recommended Filters |
|---|---|---|---|
| Traffic trend | Line chart | Organic sessions | Date range, content_type (automated/manual) |
| Conversion funnel | Funnel chart | Conversion rate (goal completions / sessions) | Traffic source, landing_page, content_type |
| Content-level performance table | Table with sortable columns | Pageviews, CTR, Avg. time on page | Author, publish_date, topic_cluster |
| Cohort retention chart | Heatmap / line series | % returning users at 30/60/90 days | Cohort by publish_week, content_type |
| Automation efficiency metric | KPI + trend sparkline | Articles per editor-hour; time-to-publish | Workflow_stage, automation_tool |
content_type and publish_date makes A/B-style comparisons straightforward; cohort and funnel views translate short-term attention into long-term value, enabling data-driven decisions.
Troubleshooting tips
- If automated vs manual tags are inconsistent, backfill using URL patterns or content templates.
- If email schedules fail, test with small recipient lists and increase throttling.
- If metrics diverge wildly, validate data joins between GA4 and CMS publish logs.
Integrate this dashboard with your content workflow so teams spot opportunities and regressions without manual reporting—automation should surface decisions, not replace them. For teams wanting an end-to-end solution, consider pairing these dashboards with AI content automation platforms like the ones described at Scaleblogger.com to close the loop between content production and performance. For metric selection and measurement frameworks, review BrightEdge’s measurement guide for practical alignment across impressions, clicks, and CTRs (https://www.brightedge.com/blog/measure-content-success).
Step-by-Step: Analyze, Attribute, and Calculate ROI
Start by choosing an attribution model that matches business priorities, then run controlled experiments to validate lift and plug costs into a straightforward payback and annualized ROI calculation. Attribution shows which touchpoints receive credit. Experiments, like A/B tests, measure impact. Full ROI calculations must include tools, engineering, and content operations to avoid misleading results.
Prerequisites
- Data access: GA4, CRM revenue events, CMS metrics, and cost/accounting feeds
- Stakeholder alignment: Agreed conversion definitions and horizon (30/90/365 days)
- Baseline metrics: Current conversion rate, average order value (AOV), traffic mix
Tools and materials
- Attribution:
GA4or server-side event store - Experimentation: A/B platform or traffic holdouts (
VWO,Optimizely, or internal split-tests) - Cost tracking: Spreadsheet or finance system with monthly run-rates
- Automation costs: vendor invoices (e.g., Jasper starting at $39/month), engineering estimates
- Select an attribution model
- Choose model by priority: Use last-click for short sales cycles and direct conversion focus, multi-touch or time-decay when nurturing and discovery matter, and incrementality (experiment-based) when causal measurement is required.
- Document assumptions: credit windows, channels included, and revenue attribution rules.
- Run experiments to measure lift
- Design holdouts: Create a control group with no automation changes and a treatment group receiving the automated content pipeline.
- Measure lift: Compare lift in conversion rate and revenue per user over the agreed horizon; calculate confidence intervals.
- Include all automation costs
- Tooling: Subscription fees (e.g., Jasper:
$39/month), additional analytics or SEO tools. - Engineering: Estimated hours × fully loaded hourly rate.
- Content ops: Time saved (hours) × blended content wage rate.
- Calculate payback and annualized ROI
- Payback period:
Total implementation cost / Monthly net benefit - Annualized ROI:
(Annualized Benefit - Annual Costs) / Annual Costs - Run scenarios: conservative, expected, aggressive—use experiment lift for expected case.
Cost and benefit breakdown for ROI calculation with line items
| Line Item | Monthly Cost | Annualized Benefit | Notes |
|---|---|---|---|
| Automation tool subscription (Jasper) | $39 | $1,200 | Jasper starter plan; upgrade costs vary |
| Analytics / attribution tooling | $100 | $2,400 | GA4 free, but paid connectors or BI tools typical |
| Engineering time (20 hrs/mo) | $2,400 | $28,800 | 20 hrs × approximately $120/hr fully loaded rate |
| Content ops time saved (40 hrs/mo) | — | $9,600 | 40 hrs saved × approximately $20/hr cost avoided |
| Revenue uplift (experiment) | — | $45,000 | Measured incremental revenue from lift |
| Net ROI | — | $25,900 | Annualized Benefit − Annual Costs (approx.) |
nytlicensing.com methods for measuring content marketing.
If attribution matches business priorities and experiments confirm lift, ROI calculations become a decision engine rather than a justification exercise. When implemented cleanly, this process shifts the conversation from “did it work?” to “how fast do we scale it?”
Step-by-Step: Operationalize Measurement (Cadence & Governance)
Clear ownership and a regular review schedule turn measurement from a guessing game into a reliable process. Start by naming KPI owners, pairing backups, and mapping weekly, monthly, quarterly, ad-hoc, and annual activities so teams know what to check, when to act, and how to document changes.
Prerequisites
- Data sources: Connected analytics (GA4), CMS, CRM, and campaign platforms
- Tools: Dashboarding (Looker/BQ, Data Studio), alerting (Slack/email), and a change-log repository (Confluence/Git)
- Stakeholders: Content leads, SEO, paid channels, product analytics
- Assign owners and backups
- Owner: Assign a single KPI owner for each metric (e.g., Organic Sessions → SEO lead).
- Backup: Designate a backup to cover vacations and handoffs.
- RACI note: Use a simple RACI matrix to record responsibilities.
- Set review frequency and agenda
- Weekly quick checks: Validate traffic trends and automated alerts; stop major regressions.
- Monthly deep dives: Review conversions, content funnels, and experiment results.
- Quarterly strategy reviews: Re-assess KPIs, thresholds, and resource allocation.
- Ad-hoc incident review: Trigger when alerts exceed thresholds or A/B tests fail unexpectedly. Refer to best practices for what metrics to track in routine checks A 4-Step Framework to Best Measure Content Success.
- Define thresholds and automated alerts
- Baseline thresholds: Use historical median ± standard deviation for traffic and conversion metrics.
- Alert channels: Push alerts to Slack + email for P1 incidents; use dashboards for P2.
- Template: store threshold rules as
metric_name: baseline, trigger: -25%, action: pause campaign.
yaml
organic_sessions: baseline: 10k_weekly trigger: -25% action: notify: #seo-channel- Maintain a change log and release governance
- Change log: Log every campaign/content release, tag with
release_id, owner, and expected impact. - Rollback plan: For automated campaigns, predefine rollback criteria (e.g., >30% CTR drop in 48 hours). Market guides recommend tracking pageviews, CTR, and time on page as core signals How to Measure Content Marketing Performance.
Suggested measurement cadence and deliverables across weekly, monthly, quarterly cycles
| Cadence | Primary Activities | Deliverables | Owner |
|---|---|---|---|
| Weekly | Quick traffic and health checks; resolve alerts | Weekly dashboard snapshot; alert log | SEO lead (backup: analytics PM) |
| Monthly | Conversion funnels; experiment review | Monthly performance report; action list | Content ops manager |
| Quarterly | KPI reset; strategy alignment | Quarterly roadmap updates; budget reprioritization | Head of Content |
| Ad-hoc incident review | Investigate spikes/drops; execute rollback | Incident report; remediation timeline | Analytics engineer |
| Annual strategy review | Long-term KPI selection; tooling review | Annual measurement plan; SLA agreements | VP Growth |
Troubleshooting Common Issues
Start by checking your telemetry and tag layers before changing automation. When an event or metric looks wrong, most problems trace back to missing tags, misrouted attribution, or a recent automation change. Follow these steps to validate, reconcile, and recover without causing further disruption.
Prerequisites
- Access: Admin access to analytics, tag manager, and the publishing automation
- Tools: Analytics debug logs,
GTMpreview mode, server logs, and a staging environment - Time estimate: 20–90 minutes per issue, depending on complexity
Quick validation checklist
- Reproduce the user journey in an incognito window while watching
GTMpreview and analytics debug logs. 2.
Confirm server-side receipts match client-side events using timestamp and session_id. 3. Check recent automation commits or workflow changes for rollouts tied to the problem.
dataLayer to confirm the event name and payload. Match IDs: Compare client_id or session_id` across client and server logs to reconcile discrepancies. Audit timing: Look for delayed event ingestion (queue backlog) in server logs that creates apparent attribution gaps.
- Rollback safety: If a change caused a drop, revert the specific automation change in staging and re-run tests before production rollback. Escalation: If logs are ambiguous, capture HAR files and escalate to backend with exact timestamps and sample IDs.
Common escalation path
- Reproduce + capture logs
- Attempt targeted rollback in staging
Apply hotfix or rule patch in tag manager 4.
Practical example: If automated cross-posting reduced organic referrals, reproduce the click path, verify UTM parameters in dataLayer, and check whether automation overwritten UTM tags at publish time.
Map common issue to quick checks, root causes, and remediation actions
| Symptom | Quick Check | Likely Root Cause | Fix/Remediation |
|---|---|---|---|
| No conversion events recorded | Check analytics debug logs & GTM preview |
Tag not firing or event name mismatch | Re-deploy corrected tag; test in GTM preview |
| Attribution looks wrong | Compare UTM in page source vs server logs | Automation overwrote UTM or redirect stripped params | Preserve UTMs in publish script; patch redirect rules |
| Sudden traffic drop after automation change | Review recent commits and server logs | Automation rollout blocked crawl or removed meta tags | Rollback change; restore meta tags; republish critical pages |
| Discrepancy between server-side and client-side data | Match session_id timestamps in both logs |
Time skew or lost client-side hits (ad-blockers) | Implement server-side event fallback; normalize timestamps |
| High bounce on automated posts | Inspect page load times and content rendering | Slow render or placeholder content for bots | render path; ensure server returns full content |
session_id) make reconciliation fast and reliable.*
Understanding these troubleshooting patterns prevents knee-jerk rollbacks and helps maintain stable automation while restoring accurate analytics. When implemented consistently, teams recover faster and reduce repeat incidents.
Tips for Success and Pro Tips
Start by making measurement a product: define owners, instrument once, iterate often. Prioritize a small set of actionable metrics tied directly to business outcomes, then use technical controls to keep data trustworthy. This requires upfront alignment (who owns events), simple tooling (feature flags, event validators), and recurring governance (auditable change log and regular audits).
Below are concrete pro tips that improve measurement outcomes quickly, with practical steps and examples you can apply this week.
Prerequisites and tools
- Prerequisites: agreed metric definitions, access to analytics and CRM, staging environment for tests.
- Tools: feature-flag system (LaunchDarkly, Split), automated test runner (Cypress, Playwright), analytics platform (GA4, Snowplow), CRM (Salesforce, HubSpot).
- Time estimate: 2–6 weeks to fully instrument and validate a typical mid-size site.
Pro-level practices (detailed)
- Use feature flags for staged rollouts so measurement changes can be scoped and reversed. Roll out a new tracking event to 10% of users, validate, then expand.
- Validate events with automated tests to prevent silent breakages; add event assertions to end-to-end CI. Example: assert
purchase_completefires withrevenue> 0. - Implement holdout groups for experiments to measure true lift versus baseline noise; keep randomized control ~10–20% depending on signal needs.
- Enrich analytics with CRM and revenue data so content metrics translate into business impact (LTV, MQL→SQL conversion).
- Keep an auditable change log: every change to events or tracking keys gets timestamped, linked PR, and owner.
> “According to A 4-Step Framework to Best Measure Content Success, impressions, clicks, click-through rate (CTR), and conversions are core content success metrics to track.” — A 4-Step Framework to Best Measure Content Success
Example: Add a data-tracking-id to content modules, gate updates with a feature flag, and run an automated test that asserts the module’s view event appears in the staging analytics stream with expected properties. This reduces regressions by 70–90% in practice when combined with audits.
Of pro tips with quick implementation steps and expected impact
| Tip | Quick Implementation | Expected Impact | Priority |
|---|---|---|---|
| Feature flags for rollouts | Add flag in LaunchDarkly; release to 10% then expand | Safer deployments; faster rollback | High |
| Automated event tests | Add assertions in Cypress that check event payloads | Fewer silent breaks; higher data integrity | High |
| Holdout groups for experiments | Create randomized 10–20% control cohort | Cleaner causal measurement; reduced bias | Medium |
| CRM enrichment | Stitch analytics user_id to CRM contact record | Measure revenue per content; better ROI | High |
| Regular data audits | Monthly checklist comparing GA & backend logs | Catch drift and mapping errors early | Medium |
📥 Download: Automated Content Success Measurement Checklist (PDF)
Advanced Causal Analysis and Experimentation
Run a holdout experiment to measure incremental impact by isolating a treatment group from a measured control (holdout) and testing for statistically significant uplift on the metric you care about. Define the experiment population and randomization, choose a practical minimum detectable effect (MDE) with corresponding sample-size calculations, collect baseline and post-intervention windows long enough to absorb seasonality, then analyze uplift with proper significance tests and confidence intervals.
Prerequisites
- Historical performance data: past CTRs, conversion rates, revenue per visitor
- Statistical power tool: web power calculator or
pwrpackage - Instrumentation: analytics that can tag users into treatment/holdout
- Stakeholder alignment: agreed KPI, MDE, and test duration
Tools and materials
- Statistical power calculators (online or
R/Pythonscripts) - A/B testing platform or experiment tracking in tagging (Google, internal)
- Data warehouse with user-level timestamps
- Scaleblogger.com for automating content distribution and collecting creative variants
- Define experiment population and treatment assignment
- Pick the target universe: users eligible for the intervention (e.g., organic blog visitors in the US).
- Randomize at the correct unit: user-id, cookie, or session — avoid cross-contamination across channels.
- Assign holdout: reserve a true control group (commonly 5–20% depending on expected lift and traffic).
- Select MDE and calculate sample size
- Choose MDE pragmatically: base on business impact (revenue per visitor) and what’s operationally meaningful.
- Run power calculations: set alpha = 0.05 and power = 0.8; input baseline rate and MDE to obtain required N per arm.
- Factor in shrinkage: increase sample by 10–20% for attrition, bot traffic, and instrumentation loss.
- Collect baseline and post-intervention windows
- Baseline window: at least one full traffic cycle (7–14 days) to capture weekday/weekend patterns.
- Post-intervention window: run until precomputed sample sizes are reached; extend for known seasonality.
- Log user-level data: metric value, assignment, timestamps, and covariates for covariate-adjusted analysis.
- Analyze uplift and report statistical significance
- Primary analysis: difference-in-proportions or t-test for means with two-sided alpha 0.05.
- Confidence intervals: report 95% CI around the uplift and percent change against baseline.
- Secondary checks: pre-period balance, sequential testing corrections if checking early.
- Report: practical impact (revenue, qualified leads), variability, and recommended action.
> Industry guides list the primary metrics teams should track when measuring content impact, including CTR and conversion rate (see 10 Must-Track Content Marketing KPIs & Metrics in 2024: https://dashthis.com/blog/best-kpis-for-content-marketing/).
Experiment planning: sample size, MDE, expected duration, and power calculations
| Metric | Baseline Rate | Minimum Detectable Effect | Required Sample Size |
|---|---|---|---|
| Click-through rate | Approximately 2.5% | +0.5pp (20% relative) | 40,000 per arm |
| Conversion rate | Approximately 1.5% | +0.3pp (20% relative) | 50,000 per arm |
| Lead quality metric (qualified lead %) | Approximately 20% | +4pp (20% relative) | 10,000 per arm |
| Revenue per visitor (USD mean) | Approximately $0.50 | +$0.05 (10% relative) | 60,000 per arm |
| Retention rate (30-day) | Approximately 35% | +3.5pp (10% relative) | 8,000 per arm |
Troubleshooting tips
- If sample targets are unreachable, increase MDE (practical tradeoff) or run the test longer.
- If pre-period balance fails, re-randomize or switch to stratified assignment.
- If uplift is small but consistent, consider pooling variants or running a sequential test with alpha adjustments.
Understanding how to run a clean holdout experiment removes guesswork from content changes and turns intuition into measurable outcomes. When implemented correctly, this approach clarifies which investments actually move business metrics and where to scale automation.
Appendix: Templates and Checklists
Start with ready-to-use templates that translate choices into repeatable execution. These artifacts remove ambiguity during handoffs—engineers get a deterministic event payload, analysts receive a clear dashboard spec, and content teams can run experiments with statistically defensible sample sizes. Below are practical templates, usage notes, and small examples to drop into your Google Drive or product backlog immediately.
Prerequisites
- Access: Google Drive or company repo where templates live.
- Permissions: Edit rights for product, analytics, and content owners.
- Tools: GA4/BigQuery, Looker/Tableau/Power BI, Google Sheets (or Excel).
How to use the set
- Clone the Google Drive folder that holds production templates (internal product assets). 2.
Populate the Event Schema with the first 10 high-value events. 3. Share the Dashboard Spec with the BI team before sprint planning.
- Run the Experiment Plan with the ROI Calculator to prioritize tests.
Practical examples (short)
- Event schema sample:
page_viewwithuser_id,session_id,content_id,channel. - ROI calc: revenue lift forecast, LTV assumptions, and traffic conversion delta.
- Experiment plan: A/B hypothesis, metric, sample-size calc using
z=1.96for 95% confidence.
Template inventory with format and usage notes
| Template Name | Format | Primary Use | How to Use |
|---|---|---|---|
| Event Schema | JSON Schema / Google Doc |
Standardize tracking events | Define events, required fields, types; export as events.json for devs |
| ROI Calculator | Google Sheet (.xlsx) |
Forecast experiment value | Input baseline traffic, conversion, AOV; outputs NPV and payback |
| Experiment Plan | Google Doc + sample-size sheet | Run A/B tests with power calc | List hypothesis, primary metric, sample size via power formula |
| Dashboard Spec | Confluence / CSV spec | BI implementation blueprint | Map KPIs to data sources, visuals, refresh cadence for BI team |
| Troubleshooting Checklist | PDF / Google Doc | QA tracking & deployment | Step-by-step validation: schema, dataflow, ingestion, sampling checks |
JSON Schema) with business-facing docs (ROI sheet), making adoption faster across squads. Use the ROI Calculator to prioritize experiments; BrightEdge and DashThis outline which metrics to track for content performance and KPI alignment (BrightEdge measure framework, DashThis KPI list).
Example: Event schema snippet
json { "event": "content_click", "user_id": "string", "content_id": "string", "position": "integer", "timestamp": "ISO8601" }Sample-size formula (two-sided)
n = (Z_{1-α/2} + Z_{1-β})^2 * (p1(1-p1)+p2(1-p2)) / (p2-p1)^2Include these templates in a shared folder (internal product assets or Google Drive) and version them. When teams adopt a single template set, audits and debugging take minutes instead of days. Understanding these principles helps teams move faster without sacrificing quality.
Conclusion
After working through measurement, validation, and iterative optimization, the practical path forward is clear: align publishing with measurable signals, automate the repetitive parts, and keep human judgment where it matters. Teams that added short A/B tests to automated flows quickly identified which headlines and formats actually move discovery and engagement; others who tracked downstream conversions rather than vanity metrics stopped amplifying content that didn’t convert. Plan to spend the first 4–6 weeks setting up tracking and conducting small experiments. After that, switch to monthly reviews that inform automation rules.
Start with three concrete moves today: instrument engagement and conversion events, run rapid tests on titles and CTAs, and codify winning variants into your automation pipeline. ” — are answered by setting minimum sample sizes and clear stop-loss rules before full rollout. Research from BrightEdge reinforces that measuring content success requires a repeatable framework and regular checkpoints, not one-off reports.
com) is a practical next step.
