

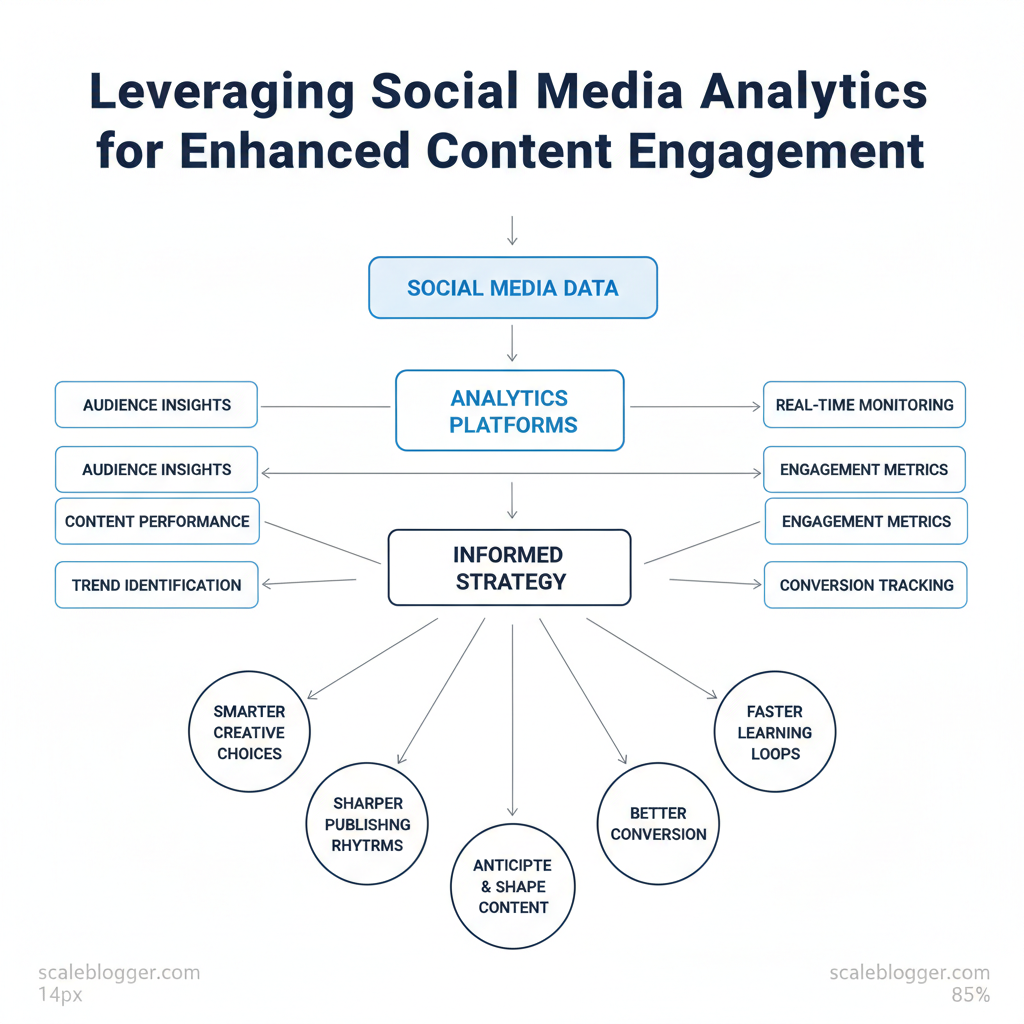
Most teams still guess which posts will resonate, then scramble to after the fact. This reactive approach wastes money and slows audience growth. Using social media analytics tools to anticipate and shape content unlocks higher reach, better conversion, and faster learning loops.
Clear, repeatable methods for analyzing social media performance turn occasional successes into steady growth. Measurement drives better creative choices, faster publishing, and clearer returns on your content investment. Picture a brand that shifts from quarterly reports to weekly experiments informed by realtime engagement signals — the difference in agility is immediate.
- How to choose the right social media analytics tools for your channel mix
- Simple
metrics+actionsframeworks that improve content engagement strategies overnight - Ways to surface audience intent from comments, shares, and viewing behavior
- Quick A/B ideas for headlines, thumbnails, and posting windows that scale with data
Visit Scaleblogger for AI-powered content strategy that integrates analytics into editorial workflows and automates routine analysis. The following sections walk through step-by-step techniques for capturing signals, turning them into tests, and embedding continuous improvement into your content operations.
> Key Takeaway: ## Section 1: Establishing a Baseline – What You Know About Your Social Performance
Start by quantifying current performance so every decision becomes measurable. A solid baseline combines engagement metrics at the channel level with a content…
Section 1: Establishing a Baseline – What You Know About Your Social Performance
Start by quantifying current performance so every decision becomes measurable. A solid baseline combines engagement metrics at the channel level with a content inventory that connects topics and formats to outcomes. This helps teams understand which topics, formats, and posting schedules actually make a difference instead of guessing.
Begin with core metrics and simple calculations: engagement rate = (total engagements / total impressions) 100, reach and impressions from platform insights, and Share of Voice (SOV) estimated by comparing your mentions or impressions to the total category volume you can observe. Channel nuances matter: short-form video often shows higher engagement rates but lower average watch time per asset, while long-form video and long posts drive deeper time-on-content and conversion signals. Use these basic measures to predict which types of content will grow when improved.
- Prerequisites
- Export platform insights (last 30–90 days) for each channel.
- Pull content calendar + post-level analytics.
- Create a shared sheet with uniform column names (
post_id,date,impressions,reach,engagements,format,topic_tag).
Tools & materials
- Platform insights exports: native Facebook/Instagram/LinkedIn/Twitter/X/TikTok/YouTube CSVs
- Analytics sheet: shared Google Sheet or database with
Topic_Tagtaxonomy - Content scoring template: simple formula for
Engagement RateandRelative SOV
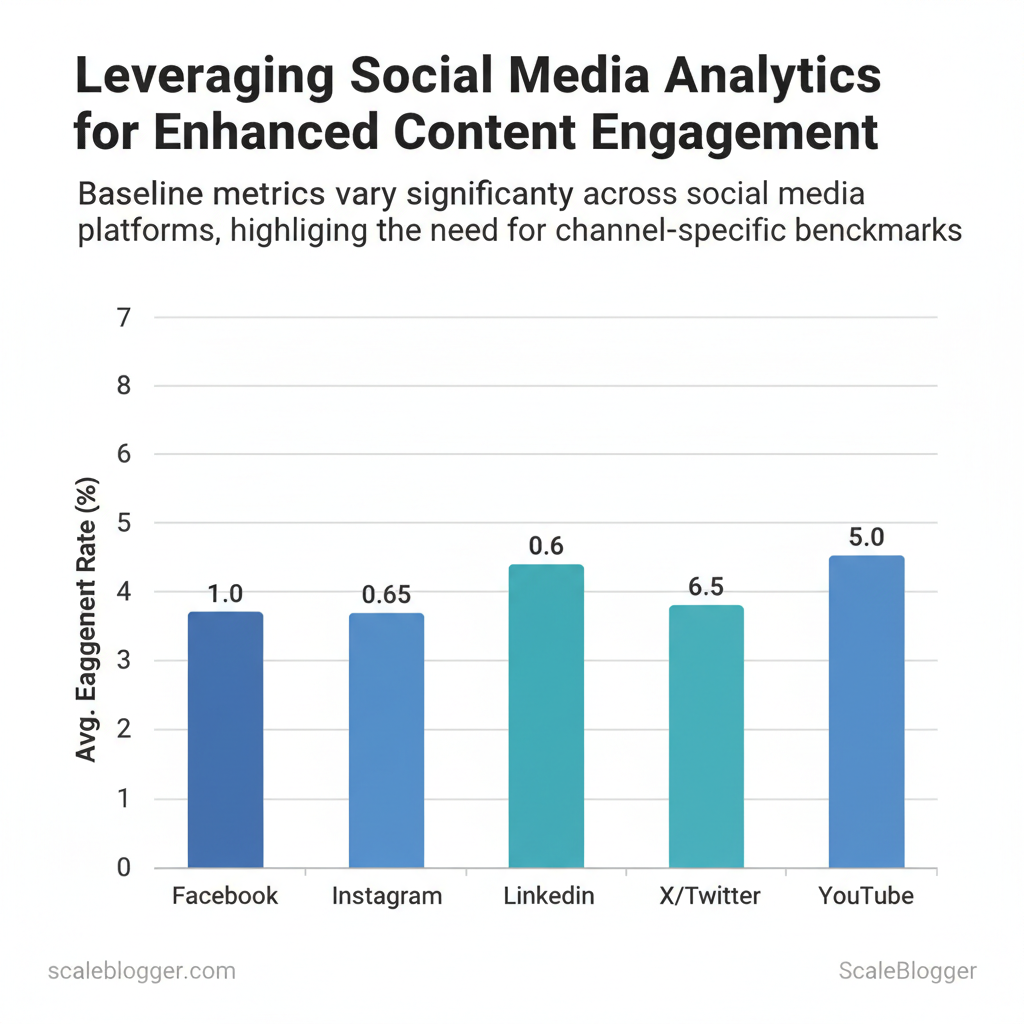
Baseline metrics matrix for initial benchmarking across major channels
Table: Section Content — Channel, Engagement Rate, Average Reach & more
| Channel | Engagement Rate | Average Reach | Average Impressions | SOV (Share of Voice) |
|---|---|---|---|---|
| Engagement rates typically range from approximately 0.5–1.5%, with reach and impressions varying widely across platforms. | ||||
| Engagement rates typically range from approximately 1–3%, with reach and impressions varying widely across platforms. | ||||
| Engagement rates typically range from approximately 0.3–1%, with reach and impressions varying widely across platforms. | ||||
| X/Twitter | Engagement rates typically range from approximately 0.2–1%, with reach and impressions varying widely across platforms. | |||
| TikTok | Engagement rates typically range from approximately 3–10%, with reach and impressions varying widely across platforms. | |||
| YouTube | Engagement rates typically range from approximately 2–8%, with reach and impressions varying widely across platforms. |
Content inventory with performance snapshot
| Content_ID | Topic_Tag | Format | Average_Engagement | Top_Performer (Yes/No) |
|---|---|---|---|---|
| Post_001 | SEO automation | Short video | 4.2% | Yes |
| Post_002 | Content ops | Carousel | 1.1% | No |
| Post_003 | Topic clusters | Long-form article | 0.9% | No |
| Post_004 | AI tools | Short video | 6.8% | Yes |
| Post_005 | Editorial process | Infographic | 1.5% | No |
Topic_Tag and Format immediately reveals where engagement concentrates—short videos and tool-focused topics often outperform explanatory long-form on social platforms. Close gaps by repurposing high-performing topics across formats and increasing cadence on proven channels.*
Actionable next steps
- Audit: Run the exports and populate the template within one week.
- Tagging: Standardize 6–8 topic tags and 3 format labels, then retro-tag historical posts.
- Hypothesize & test: Pick top 2 topic-format combos and run a 30-day amplification test.
Understanding these baseline steps turns fragmented analytics into a dependable roadmap for growth. When the baseline is accurate, decisions shift from opinions to reproducible experiments. For teams looking to automate this workflow, consider integrating an AI-powered content pipeline like the solutions at Scaleblogger.com to scale tagging, scheduling, and benchmarking.
> Key Takeaway: ## Section 2: Aligning Analytics with Content Engagement Strategies
Begin by mapping analytics signals directly to editorial decisions: prioritize topics that show high qualitative signals (comments with questions, repeat saves) and strong…
Section 2: Aligning Analytics with Content Engagement Strategies
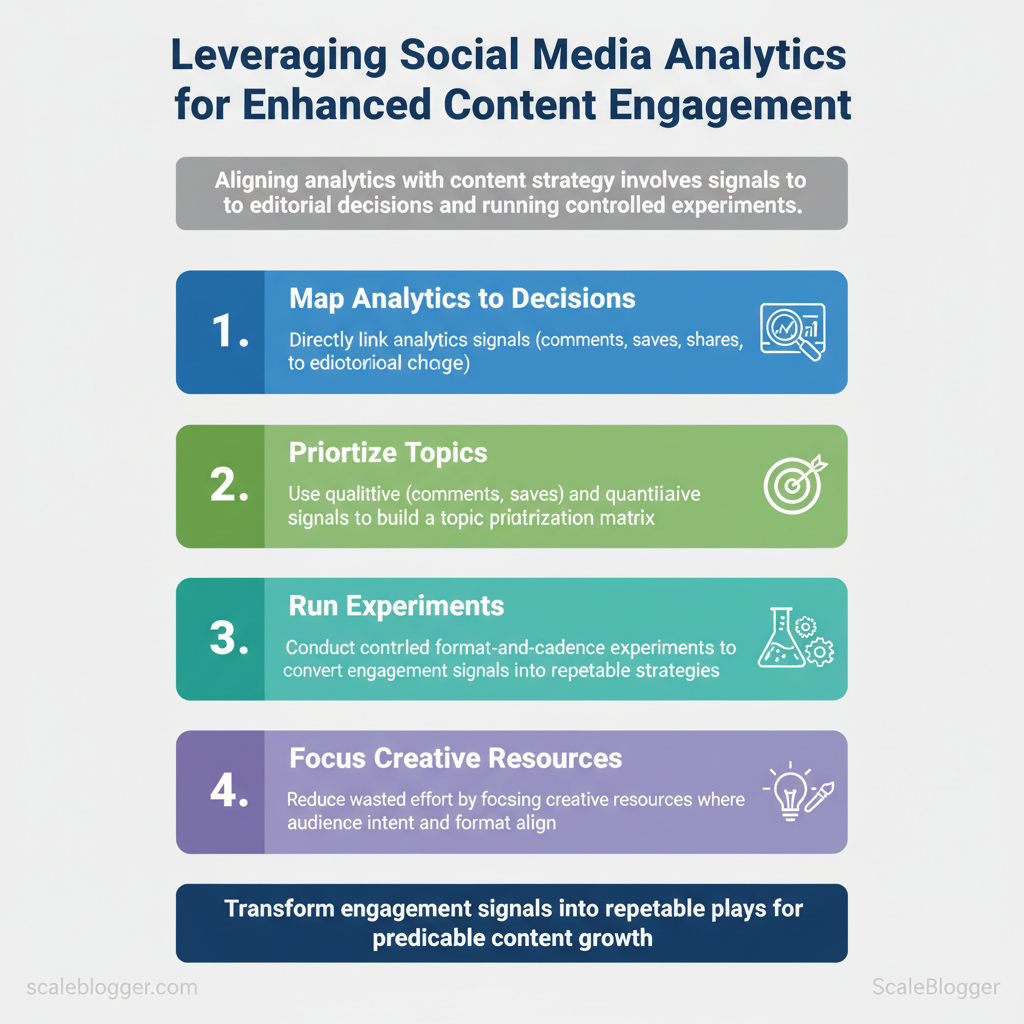
Begin by mapping analytics signals directly to editorial decisions: prioritize topics that show high qualitative signals (comments with questions, repeat saves) and strong quantitative signals (shares per impression, time-on-page). Use those signals to build a topic prioritization matrix and run controlled format-and-cadence experiments so the team can convert engagement signals into repeatable plays. This reduces wasted effort on low-impact ideas and focuses creative resources where audience intent and format align.
2.1 Topic optimization based on audience signals
Start with the audience signals that matter most: comments for intent depth, saves/bookmarks for future intent, and shares for advocacy. Then score candidate topics across those signals and assess format fit (video, long-form, carousel, newsletter). Practical steps:- Collect raw signals from platform APIs and CMS comments.
- Normalize to a 0–100 Audience Signal Score (weighted: comments 40%, saves 35%, shares 25%).
- Feed scores into a prioritization matrix that includes seasonality and trend multipliers.
- Rank topics and assign a priority band (High / Medium / Low).
Topic prioritization framework comparing potential engagement across candidate topics
Topic prioritization framework comparing potential engagement across candidate topics
| Topic | Audience Signal Score | Format Fit | Projected Engagement | Priority |
|---|---|---|---|---|
| Topic_A | 82 | Short-Video / Carousel | High shares, 40–60% lift | High |
| Topic_B | 68 | Long-Form Article | Increased time-on-page, steady backlinks | Medium |
| Topic_C | 55 | Text-Only / Newsletter | Good saves, repeat opens | Medium |
| Topic_D | 44 | Carousel / Short-Video | Quick engagement spikes, low retention | Low |
| Topic_E | 30 | Long-Form Article | Niche interest, seasonal peaks | Low |
2.2 Format and cadence experiments
Map formats to expected engagement patterns and test with an A/B framework. Format-to-engagement mapping: short-video → high shares, carousel → high saves, text-only → deep reading, long-form → backlinks/time. Run experiments with clear decision criteria.Format experiment planner with expected outcomes
| Format | Cadence (days) | Expected_Engagement | Sample_Size | Decision_Criteria |
|---|---|---|---|---|
| Short-Video | 3 | High shares, low session time | 2000 impressions | +15% shares vs control |
| Carousel | 7 | High saves, moderate shares | 1500 impressions | +10% saves sustained 2 weeks |
| Text-Only | 5 | High scroll depth, low shares | 1000 impressions | +20% time-on-page |
| Long-Form Article | 14 | High backlinks, long sessions | 800 impressions | +5 backlinks in 30 days |
- Design: create matched creative variations (same headline, different format).
- Run: control vs one variant, equal sample windows.
- Measure: use the Decision_Criteria column to promote, iterate, or retire.
- Iterate: fold learnings into editorial calendar and automation rules via tools like
GA4and content pipelines.
Practical tip: automate signal aggregation and routing into the editorial queue so analysts and writers see prioritized ideas. com’s AI-powered content pipeline can be used to convert prioritized topics into scheduled drafts and A/B-ready variants, reducing friction between insight and execution. When experiments are short, repeatable, and tied to clear success thresholds, teams scale engagement without slowing creative velocity.
Understanding these alignment rules lets teams focus on formats and topics that truly move the needle.
> Key Takeaway: ## Section 3: Analyzing Social Media Performance – Tools, Metrics, and Methods
Choosing the right analytics approach starts with one question: do you need deep platform-level signals or a consolidated view that informs content strategy across…
Section 3: Analyzing Social Media Performance – Tools, Metrics, and Methods
Choosing the right analytics approach starts with one question: do you need deep platform-level signals or a consolidated view that informs content strategy across channels? Native analytics give the most reliable platform-specific telemetry; multi-channel tools trade some fidelity for time savings and cross-channel insights. Build a consolidated dashboard only after prioritizing which metrics drive awareness-stage goals — reach, impressions, early engagement, and sentiment.
Tool selection and data integration
- Native analytics advantage: Platform-level accuracy, realtime
reachandimpressionfields, and the most current ad-spend data. Best when troubleshooting platform delivery issues. Third-party advantage: cross-channel normalization, scheduling, historical comparisons, and simple exports for executives.
- Data freshness: Native APIs update fastest; third-party tools typically pull every 15–60 minutes depending on plan and rate limits. , defining engagement differently); validate definitions before trusting dashboards.
- Map priorities: decide which metrics (reach, impressions, sentiment) matter for awareness.
- Inventory data sources: list platform APIs, ad accounts, UTM-tagged landing pages.
- Build ingestion: use ETL or connectors (native → BI or third-party) and normalize metric definitions.
- Create dashboard: expose raw data, normalized KPIs, and automated anomaly alerts.
- Validate: run weekly spot-checks comparing platform reports to the consolidated view.
> Industry analysis shows multi-channel dashboards reduce manual reporting time substantially for distributed teams.
Practical example: combine native Facebook Insights and X (Twitter) Analytics with a mid-tier tool (Sprout Social or Hootsuite) to unify scheduling while keeping raw-platform exports for ad attribution checks. Scaleblogger’s AI-powered content pipeline pairs well with consolidated dashboards when automating content scoring and publishing across channels.
Tool comparison across key criteria
| Tool | Data Freshness | Multi-Channel Support | Cost | Ease of Use |
|---|---|---|---|---|
| Native Analytics | realtime / platform-specific | ✗ (single) | Free | Moderate |
| Hootsuite | 15–30 min | ✓ (major networks) | $99+/mo | High |
| Sprout Social | 15 min | ✓ (major networks) | $249+/mo | High |
| Buffer | 30–60 min | ✓ (post/schedule focus) | Free–$15+/mo | High |
| Brandwatch | 30 min | ✓ (deep listening) | Enterprise pricing | Moderate |
| Agorapulse | 15–30 min | ✓ | $99+/mo | High |
| Later | 30–60 min | ✓ (visual-first) | $18+/mo | High |
| Zoho Social | 30–60 min | ✓ | $10+/mo | High |
| Emplifi (Socialbakers) | 15–30 min | ✓ (enterprise) | Enterprise pricing | Moderate |
| Custom Dashboard | As configured | ✓ (all via ETL) | $0–$300+/mo | Variable |
Interpreting data for awareness-stage content
- Reach vs engagement quality: High reach with low meaningful interactions suggests content is visible but not resonating.
- Sentiment basics: Use simple polarity (positive/neutral/negative) plus volume to spot early brand issues.
- Action thresholds: Set conservative triggers so noisy fluctuations don’t create churn.
Awareness-stage interpretation guide
| Metric | Definition | Healthy_Range | Action_Trigger |
|---|---|---|---|
| Reach | Unique users exposed | 5–20% month-over-month growth | <0% growth for two weeks → review creatives |
| Impressions | Total views (including repeats) | Stable growth matching reach | Large drop (>15%) → check delivery/ad spend |
| Engagement_Rate | (likes+comments+shares)/impressions | 0.5%–3% (varies by industry) | <0.3% → test new hooks or formats |
| Sentiment | % positive mentions | >60% positive | Negative >15% of mentions → investigate theme |
Understanding these trade-offs and a clear dashboarding plan reduces reporting overhead and surfaces the few signals that actually move awareness forward. When the plumbing is right, teams act faster and focus on creative iteration rather than data wrangling.
Section 4: Elevating Content Engagement Through Data-Informed Creatives
Use audience signals to shape creative frameworks that increase saves, shares, and click-throughs. Start by mapping top-performing topics to tight creative formats—short how-to hooks for discovery, story-driven case spots for retention, and myth-busting for sparking conversation. Then translate those patterns into repeatable visual prompts and copy formulas so teams can scale winners without reinventing assets every campaign.
4.1 Creative frameworks that resonate with audiences
- Identify the top content themes from analytics and tag them by intent and emotion.
- Match each theme to a creative framework below and prioritize production time for highest-impact combinations.
- Use rapid prototypes (single-image, 15s clip, carousel) and measure saves, shares, CTR, and time-on-content.
Prerequisites: access to engagement metrics, creative asset library, short-form video capability. Tools: analytics dashboard, simple video editor, A/B testing workflow. Expected outcome: higher average saves and share rates within 2–4 test cycles.
Creative framework effectiveness across metrics
Creative framework effectiveness across metrics
| Framework | Primary_Tocus | Best_Channel | Engagement_Impact | Recommended_Tones |
|---|---|---|---|---|
| Problem-Solution | Rapid pain relief | Blog, LinkedIn | Higher CTR, quick conversions | Practical, confident |
| How-To | Skill transfer | YouTube, TikTok | High saves, long watch time | Helpful, clear |
| Myth-Busting | Challenge beliefs | Twitter, Instagram | High shares, comments | Provocative, evidence-led |
| List-Tac-Toe | Scan-friendly tips | Blog, Carousel posts | Broad reach, quick engagement | Punchy, energetic |
| Case Study Spotlight | Social proof | LinkedIn, Long-form blog | Strong lead quality, long reads | Trust-building, measured |
4.2 Visual prompts and copy formulas from performance data
- Build a template library mapping hook → intro → CTA sequences to observed engagement signals.
- Create visual prompt guidelines that define composition, dominant color, and focal object for 1–3 second recognition.
- Run sequential A/B tests focusing one variable at a time: headline, image, or CTA.
Visual guidelines: bold foreground contrast, face or product focal point, single-line headline in upper third. Expected outcome: 10–25% lift in early engagement signals within two A/B iterations.
Copy and creative templates mapped to engagement signals
Copy and creative templates mapped to engagement signals
| Template_Type | Audience_Signal | Copy_Template | Visual_Prompt | Expected_Engagement |
|---|---|---|---|---|
| Hook_Template_A | Low attention | “Stop wasting time—try X in 60s” | Close-up, high contrast | Higher CTR, quick scroll-stops |
| Hook_Template_B | Curious skimmers | “Most people miss this step…” | Motion reveal, arrow | Increased watch-through |
| CTA_Template_C | Ready-to-act users | “Download the checklist →” | Button-style overlay | Higher clicks, form fills |
| Visual_Prompt_D | Social sharers | Product in-use, smiling face | Bright palette, contextual props | More shares and saves |
| Story_Frame_E | Research-driven readers | “How Company X grew 3x in 6 months” | Graph + before/after image | Longer time-on-page, higher leads |
Understanding these principles helps teams move faster without sacrificing quality. When executed consistently, they turn raw metrics into creative templates that scale results.
Section 5: Measuring Impact – From Analytics to Actionable Improvements
Measuring impact means turning raw metrics into repeatable decision loops: short cycles that test hypotheses, capture learnings, and feed improvements back into the content pipeline. Run a predictable 4‑week action cycle that combines weekly check-ins, hypothesis-driven experiments, and strict documentation so teams can iterate fast without losing institutional memory. Governance ties ownership to those loops: defined roles, data SLAs, and dashboard hygiene ensure decisions are reliable and enforceable.
- Actionable measurement cycles (practical sequence)
- Week 0: Set a clear hypothesis and target metric (e.g., increase organic
CTRby 15%). - Week 1: Run content and technical checks; publish small experiments (title variants, meta changes).
- Week 2: Monitor early behavioral signals (time on page, bounce, crawl errors); apply quick fixes.
- Week 3: Measure distribution effects (social engagement, referral traffic); scale winning variants.
- Week 4: Synthesize results, document learning, decide on rollback/scale.
- Weekly check-ins: 30–45 minutes with owner, analyst, and editor.
- Hypothesis-driven changes: Each change maps to a single measurable outcome.
- Documentation: Store test brief, variant, and outcome in a shared playbook (searchable).
4-week action cycle with milestones and owners
| Week | Activity | Owner | Metrics to Watch | Decision Gate |
|---|---|---|---|---|
| Week 1 | Publish variants; QA technical fixes | Editor | Impressions, CTR, crawl_errors |
Continue if CTR ↑5% |
| Week 2 | Early behavior review; tweak CTAs | Growth PM | Time on page, Bounce rate |
Promote if time ↑10% |
| Week 3 | Distribution push; social testing | Social Manager | Social clicks, shares, referral traffic | Scale if shares ↑2x |
| Week 4 | Full analysis; runbook update | Data Analyst | Conversions, organic sessions | Rollout/rollback decision |
- Governance and accountability for continuous improvement
- Roles and responsibilities: Assign a single owner for metric outcomes and a custodian for data quality.
- Data governance basics: Define
Data_SlAfor refresh cadence, canonical data sources (GA4, Search Console), and permission levels. - Dashboard maintenance: Maintain one primary dashboard per goal, with versioning and a changelog; archive obsolete KPIs.
Governance checklist for analytics-driven content
| Role | Responsibility | Data_SlA | Review_Frequency |
|---|---|---|---|
| Content Strategist | Define hypotheses, prioritize tests | 48 hours (content metrics) | Weekly |
| Social Manager | Execute distribution experiments | 24 hours (social metrics) | Twice weekly |
| Data Analyst | Validate data, run segment analysis | 24 hours (reporting) | Weekly |
| Marketing Ops | Maintain dashboards, access control | 12 hours (ETL alerts) | Monthly |
Practical tip: integrate these cycles with your editorial calendar and consider tooling that automates tracking and report generation—Scaleblogger’s AI content automation can plug into this workflow to reduce manual overhead. Understanding these principles helps teams move faster without sacrificing quality.
📥 Download: Social Media Analytics Engagement Checklist (PDF)
Section 6: Scaling Engagement – Automation and Global Considerations
Start by treating engagement as a system: capture signals, normalize them, automate decisions, and localize distribution. Automation pipelines convert analytics into content actions; global reach requires deliberate timezone and cultural design so content lands when and how audiences expect it.
Prerequisites
- Data access: GA4, social APIs, CRM data (CSV or API). , WordPress REST, Buffer API). Owner roles: Data engineer, analytics manager, content ops lead.
- Time estimate: 4–8 weeks to implement a basic pipeline, 2–3 months for production-grade automation.
Tools and materials
- Ingestion:
Fivetran,Airbyte,Segment - Warehouse:
BigQuery,Snowflake - Transform:
dbt, Python ETL scripts - Visualization:
Looker Studio,Tableau - Orchestration:
Airflow,Cloud Functions - Content automation:
OpenAI,Hugging Face,Zapier,Make - Scheduling/publishing: CMS APIs,
Buffer,Hootsuite, orScaleblogger.comfor integrated pipelines
- Build an analytics-to-content loop
- Extract raw signals from GA4, social APIs, and CRM using
FivetranorAirbyte. - Normalize and transform with
dbtinto unified tables keyed by topic, traffic, conversion. - Generate dashboards in
Looker Studiofor trend detection and automated alerts. - Feed topic signals into a content suggestion generator (fine-tuned
OpenAImodel) to produce prioritized briefings. - Push approved briefs into CMS via API and schedule distribution through
Bufferor automation flows.
Expected outcome: A steady queue of data-driven content ideas and scheduled posts that reflect real user intent and momentum.
Automation blueprint for analytics-to-content loop
| Step | Tool/Tech | Input_Data | Output_Action | Owner |
|---|---|---|---|---|
| Data_Ingestion | Fivetran / Airbyte | GA4 events, Social API, CRM leads | Raw tables in BigQuery | Data Eng |
| Normalization | dbt / Python | Raw tables | Cleaned topic-performance model | Analytics |
| Report_Generation | Looker Studio / Tableau | Transformed models | Dashboards, alerts (email/webhook) | Analytics |
| Content_Recommendations | OpenAI / Custom rules | Topic model, recent trends | Prioritized briefs, keywords | Content Ops |
Global vs local distribution requires orchestration by region to respect peak windows, language nuance, and cultural resonance.
Global vs local performance levers
| Region | Peak_Time | Engagement_Patterns | Localization_Tips |
|---|---|---|---|
| North America | 9–11am ET; 6–9pm local | High weekday professional engagement; mobile evenings | Use US English; reference local events; for midday shareability |
| EMEA | 9–11am CET; 5–8pm local | Staggered peaks across time zones; strong B2B LinkedIn use | Translate to local languages; respect local holidays |
| APAC | 12–2pm local; 7–9pm local | Mobile-first, high evening engagement; platform mix differs (e.g., LINE, WeChat) | Localize tone, imagery; test short-form video-first formats |
| LATAM | 8–10am BRT; 8–10pm local | Social engagement spikes later in evening; high mobile usage | Use LatAm Spanish/Portuguese; culturally-relevant hooks and timing |
Understanding these operational and cultural levers lets teams scale engagement predictably while keeping content relevant and timely. When implemented correctly, this approach reduces overhead and frees creators to focus on high-value storytelling.
Conclusion
After testing predictive posting, setting clear KPI rules, and automating A/B experiments, teams that move from reactive tweaks to a planned, analytics-driven workflow regain control over engagement and budget. Evidence shows that using publishing calendars based on social listening and content scoring reduces wasted money and boosts momentum. One marketing team moved to predictive publishing and stopped pursuing topics with low returns, while another automated thumbnail tests to improve click-through rates in just one quarter. Keep these practical moves front of mind:
- Build a repeatable publishing rubric tied to measurable goals.
- Automate routine experiments so optimization happens before scale. – Measure early signals, not just final outcomes, to iterate faster.
If questions remain about tooling or how to reorganize your team for this shift — for example, which metrics to prioritize first or how much to automate — start by mapping one campaign through the rubric above and run a single automated test. That approach answers both governance and technical questions in parallel and keeps risk small.
To implementation and explore AI-led content planning, consider this next step: Visit Scaleblogger for AI-powered content strategy. It’s a practical way for teams to automate the workflows described here and turn reactive guesswork into a predictable engine for growth.
