

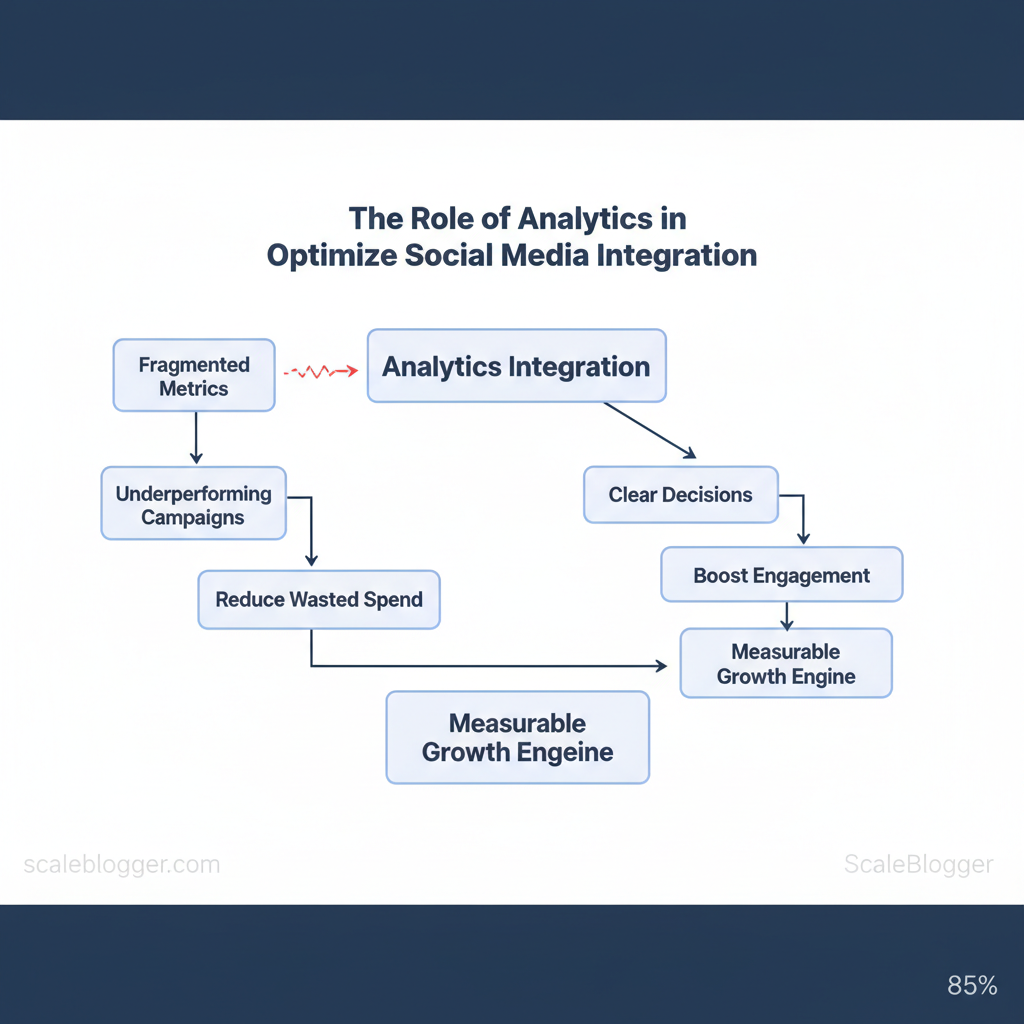
Marketing teams waste hours chasing fragmented metrics while campaigns underperform. Integrating analytics into social workflows turns scattered signals into clear decisions that boost engagement and reduce wasted spend.
Analytics shows which content works well, where audiences turn into customers, and which channels need more investment. According to Sprout Social, structured measurement transforms social media from a broadcast channel into a measurable growth engine. Imagine a team that shifts its budget to better-performing posts, increasing conversion rates in just a few weeks.
Think of analytics as an operational system rather than a monthly report.
- How to align social metrics with business goals
- Which metrics truly indicate audience intent versus vanity
- Practical steps to connect analytics across platforms and CRM
- Ways to automate reporting so teams act faster
- When to escalate insights into paid spend or product changes
Explore Scaleblogger’s solutions for automating content and analytics: https://scaleblogger.com
Next, practical steps will show how to audit current measurement, prioritize integrations, and deploy automated dashboards that drive decisions. Assess your analytics readiness with Scaleblogger: https://scaleblogger.com
> Key Takeaway: ## Understanding the Analytics Landscape for Social Media
Prerequisites
- Access to platform native analytics (Meta, X, LinkedIn, TikTok). A unified reporting destination (e.
Understanding the Analytics Landscape for Social Media
Prerequisites
- Access to platform native analytics (Meta, X, LinkedIn, TikTok).
- A unified reporting destination (e.g.,
GA4, BI tool, or social analytics platform). - Clearly defined business objectives mapped to measurable KPIs.
Tools / materials needed
- Use native platform analytics like Meta Insights, X Analytics, and LinkedIn Analytics.
- Utilize a central analytics hub such as Google Analytics 4, Sprout Social, or Hootsuite. Event instrumentation (Amplitude or Mixpanel) for behavioral tracking.
- Export-capable reporting layer (CSV/JSON or API access). Time estimate: 2–4 weeks to instrument, 1–2 weeks for baseline reports.
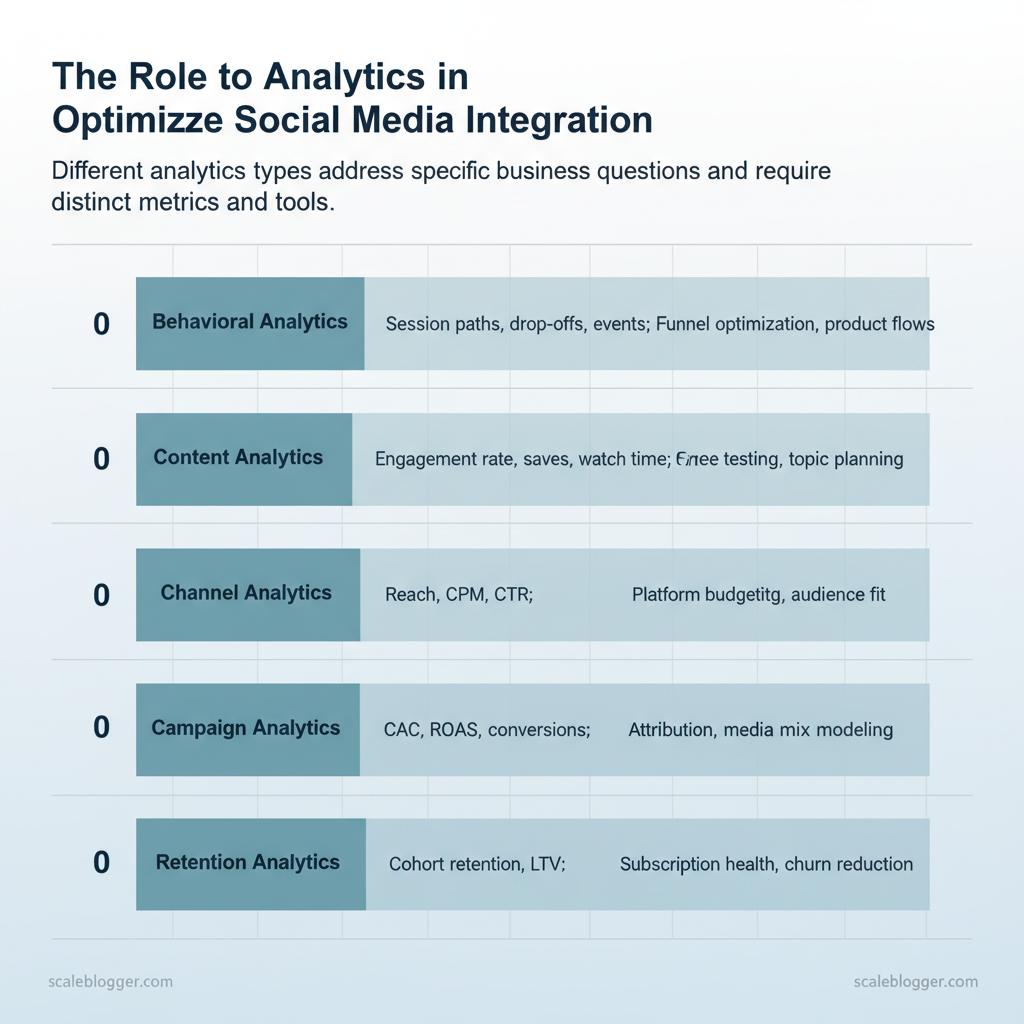
Start by separating analytics into types so measurement aligns with business decisions. Each type answers a different question and demands different instrumentation and cadence.
- Behavioral analytics tracks how users move across touchpoints, where they drop off, and which pathways correlate with conversion. Use
event-level data and product analytics for depth. - Content analytics shows what creative, topics, or formats perform best. Combine impressions, engagement rate, and qualitative signals (comments, saves).
- Channel analytics isolates platform-level ROI and audience fit; evaluate reach, CPM, and conversion performance by network.
- Campaign analytics focuses on attribution, spend efficiency, and lift — essential for budgeting and scaling.
- Retention analytics measures long-term value: repeat conversion rates, retention cohorts, and lifetime value.
Key metrics and formulas to operationalize decisions
- Engagement rate = (likes + comments + shares) / impressions — use platform-level or post-level versions. 2.
CTR (click-through rate) = clicks / impressions. 3. Conversion rate = conversions / clicks (or sessions).
- CAC (customer acquisition cost) = campaign spend / new customers. 5.
ROAS = revenue / ad spend. 6. Retention rate (N-day) = retained users at N / users in cohort.
Benchmarks and red flags
- Industry analysis shows engagement rates vary by sector and format; treat absolute numbers cautiously and prioritize trend direction. See Sprout Social’s primer for common metric definitions and use cases.
GA4 or product analytics for attribution clarity.
Which KPIs map to objectives
- Awareness → impressions, reach, CPM. Acquisition → CTR, CAC, conversion rate. Engagement → engagement rate, shares, comments.
- Revenue → ROAS, LTV, avg. order value. Loyalty → retention rate, repeat purchase rate.
Practical outcome: a prioritized measurement plan—instrument behavioral events first for attribution, then surface content and channel metrics weekly for optimization. When implemented correctly, this approach reduces reporting noise and makes it obvious which experiments deserve budget and which should stop.
Analytics types with primary metrics, typical tools, and top use cases to help readers choose which to prioritize
| Analytics Type | Primary Metrics | Typical Tools | Top Use Cases |
|---|---|---|---|
| Behavioral | Session paths, drop-offs, events |
Amplitude, Mixpanel, GA4 | Funnel optimization, product flows |
| Content | Engagement rate, saves, watch time | Sprout Social, BuzzSumo, ContentStudio | Creative testing, topic planning |
| Channel | Reach, CPM, CTR | Meta Insights, X Analytics, TikTok Analytics | Platform budgeting, audience fit |
| Campaign | CAC, ROAS, conversions | GA4, Sprinklr, HubSpot | Attribution, media mix modeling |
| Retention | Cohort retention, LTV | Amplitude, Mixpanel, HubSpot CRM | Subscription health, churn reduction |
> Key Takeaway: ## Setting Up an Analytics-Ready Social Integration
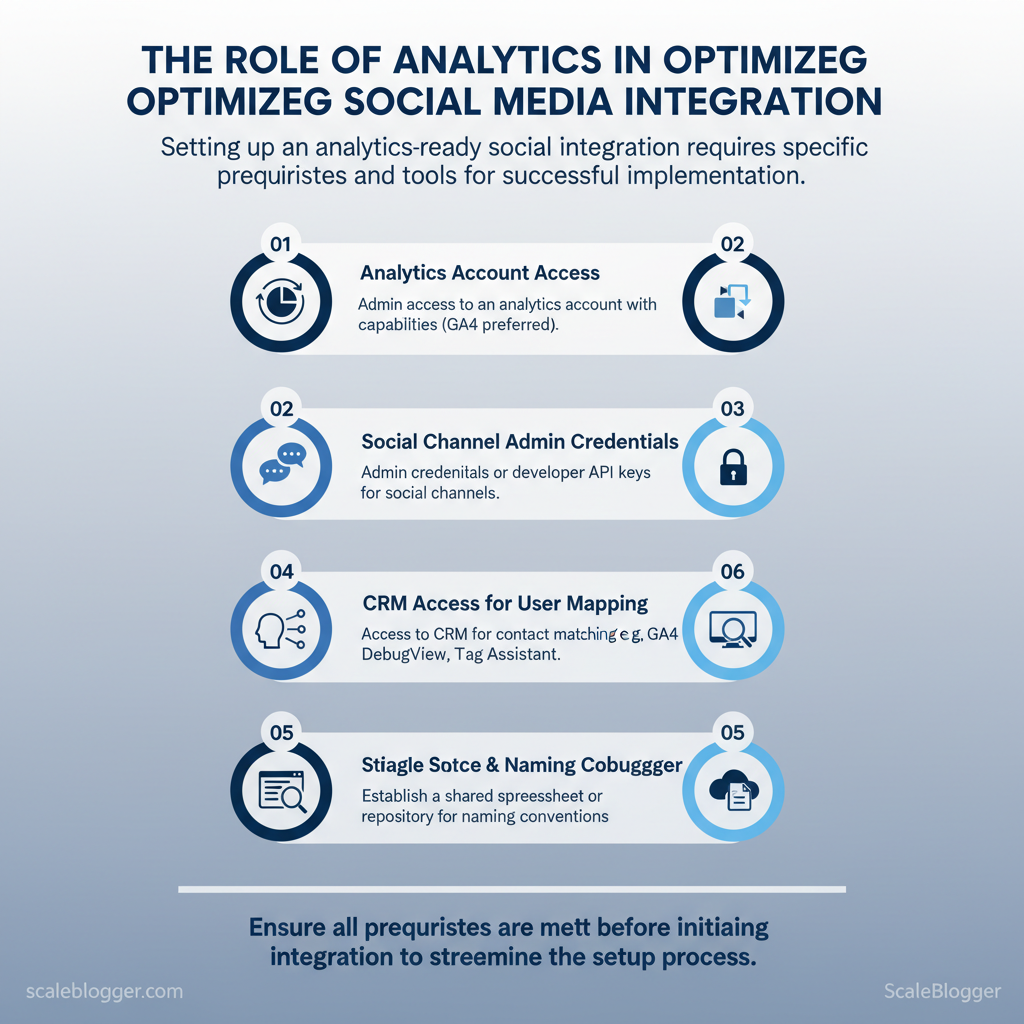
Prerequisites
- Analytics account with event capabilities (
GA4preferred) and admin access.
Setting Up an Analytics-Ready Social Integration
Prerequisites
- Analytics account with event capabilities (
GA4preferred) and admin access. 2.
Social channel admin credentials or developer API keys. 3. CRM access for contact matching and userID mapping.
- ,
GA4 DebugView, Tag Assistant). 5.
A single source of truth for naming conventions (shared spreadsheet or repo).
Tools / materials needed
- Analytics: Google Analytics 4 (GA4) or equivalent. Tagging: Google Tag Manager or server-side tagging. Middleware: Zapier, Make, or an iPaaS for non-native flows.
- CRM: HubSpot, Salesforce, or your enterprise CRM. Validation: Browser debug tools and an HTTP request inspector.
- Define the tracking architecture first
- Establish a UTM standard and lock it into a single document. Use lowercase, hyphens for phrases, and avoid campaign-specific noise.
- Create consistent event naming across platforms using
snake_caseorcamelCaseand includeobject_action_contextwhen useful (e.g.,post_click_link_homepage). - Map the canonical user identifier (
user_idfrom CRM) to analytics and social pixels so events can be stitched to profiles. - Validate with a test matrix: create test posts, click through, and confirm UTM parameters, pixel fires, and CRM contact creation.
UTM and event design examples
- UTM rules:
utm_source= channel (e.g.,twitter),utm_medium=socialorpaid_social,utm_campaign= lowercase campaign slug. - Event design: Track both
engagementevents (likes, shares) andconversionevents (form_submit, demo_request) with identical parameter names across platforms. - Validation: Use
GA4 DebugViewandnetworktab to confirm hits, then cross-check with CRM timestamped records.
Connecting tools: architecture choices and trade-offs
- Native integrations: fastest, lowest latency, but limited transformation logic. 1.
Middleware (Zapier/Make): easier mapping between vendors, moderate latency, good for small teams. 1. Custom integrations (server-to-server): highest reliability, lowest data loss, best for enterprise security requirements.
Security & permissions checklist
- Least privilege: give only needed scopes for API keys. Rotate keys quarterly and store in a vault. Consent: ensure cookie/consent flags gate pixel firing where required.
- Data minimization: pass hashed identifiers where possible.
Provide a sample tracking naming convention matrix mapping channel > utm_source > utm_medium > event_name to standardize implementation
Social media tracking setup
| Channel | utm_source | utm_medium | event_name |
|---|---|---|---|
| Organic X (Twitter) | twitter |
social |
post_click_twitter |
| Paid Meta (Facebook/Instagram) | facebook |
paid_social |
ad_click_meta |
| LinkedIn Organic | linkedin |
social |
post_click_linkedin |
| Email to Social Landing | email_newsletter |
email |
email_cta_click |
| Cross-posting (Syndication) | syndication |
social |
post_click_syndicated |
utm_source, utm_medium, and event_name across channels removes ambiguity in downstream reporting, reduces ETL mapping work, and enables reliable attribution. Industry resources on social analytics recommend aligning event schemas and UTM practices to maintain cross-channel comparability (Social Media Analytics: The Complete Guide).*
Troubleshooting tips
- If events don’t appear in analytics: check ad-blockers and consent flags first.
- If CRM records miss UTM data: ensure landing pages capture query parameters before redirects.
- If latency varies: measure end-to-end delay and consider server-side tracking for critical events.
Understanding these integration patterns prevents data fragmentation and accelerates insight delivery. When implemented correctly, this approach reduces overhead by making decisions at the team level.
> Key Takeaway: ## Attribution Models and Measuring Cross-Channel Impact
Choosing an attribution model starts with a clear question: which interactions drive the outcomes that matter to your business? Pick a model that aligns to the conversion complexity you face,…
Attribution Models and Measuring Cross-Channel Impact
Choosing an attribution model starts with a clear question: which interactions drive the outcomes that matter to your business? Pick a model that aligns to the conversion complexity you face, the length of your sales cycle, and the granularity of insight you need.
Common trade-offs: simple models are easy to explain and implement but risk over-crediting touchpoints; multi-touch approaches distribute credit more fairly but require more data and governance. For social-first campaigns, rely on metrics that map directly to your business objective — impressions and engagement for awareness, assisted conversions and path metrics for mid-funnel, and last-touch signals for immediate conversions.
- Choosing the right attribution model for your goals
- Last Click — Best for short transactional funnels and tactical paid search reporting.
- First Click — Useful when measuring discovery or upper-funnel channel performance.
- Linear — Good for even-credit visibility across many touchpoints; helpful for cross-channel budget discussions.
- Time Decay — Favor when recent touches are more influential, such as promotional windows.
- Data-Driven — Preferred for enterprise use when sufficient data exists; attributes based on observed lift and conversion probability.
Rules of thumb: small teams should start with Last Click or Time Decay to get stable baselines quickly; enterprise teams should invest in data-driven models and incrementality testing. For multi-touch or long sales cycles, combine path analysis, cohort windows aligned to sales timelines, and controlled experiments rather than relying on any single model.
Validating attribution: testing and guardrails
- Design an incrementality test
- Define treatment and holdout groups by audience segment or campaign.
- Hold creative and cadence constant; vary the channel exposure you want to test.
- Measure lift on the primary metric (transactions, MQLs) and secondary signals (assisted conversions, time-to-conversion).
Sample size & duration: Industry practice recommends powering tests to detect a minimum detectable effect (MDE) of 5–10% with >80% power; for typical digital campaigns this often means thousands of users per variation and a duration that spans at least one full buying cycle. Shorter tests bias toward short-term channels; longer tests capture delayed conversions.
Interpreting results and avoiding biases: watch for selection bias, channel cannibalization, and externalities (seasonality, promotions). Use confidence intervals rather than single-point estimates. If results conflict with modeled attribution, treat the experiment as the higher-trust signal and adjust model weights or windowing rules accordingly.
Side-by-side comparison of social media attribution models
| Attribution Model | Strengths | Weaknesses | Recommended Use Cases |
|---|---|---|---|
| Last Click | Clear, simple; easy reporting | Over-credits final touchpoint | Short e‑commerce funnels, tactical PPC |
| First Click | Highlights discovery channels | Ignores later influences | Brand awareness and upper-funnel spend |
| Time Decay | Rewards recent interactions | Window selection subjective | Promotions, limited-time campaigns |
| Linear | Even credit across path | Masks highest-impact touchpoints | Cross-channel budget discussions |
| Data-Driven | Uses observed conversion impact | Requires large data volumes | Enterprise analytics and optimization |
data-driven attribution for channels and audiences with sufficient volume. Incrementality testing provides the highest-quality signal and should be used as a governance layer to recalibrate models and avoid misallocating budget.
Understanding these principles helps teams move faster without sacrificing quality. When implemented correctly, this approach reduces overhead by making decisions at the team level.
Turning Analytics into Action: Optimization Workflows
Begin by treating analytics as a decision engine rather than a report generator. An optimization playbook quickly converts signals into confirmed changes. It involves identifying strong signals, creating testable ideas, running controlled experiments, measuring with clear KPIs, and scaling successful changes across channels.
Prerequisites
- Access to social analytics (GA4, platform insights), content publishing tools, and an experimentation log
- A designated owner for cadence and decisioning
- Baseline metrics and historical variance for confidence calculations
Tools / materials
GA4, native platform insights, Sprout Social reports for channel metrics (Social Media Analytics: The Complete Guide)- Experiment tracking sheet or lightweight tool (
A/B test tracker,notion/spreadsheet) - Optionally: AI-powered content pipeline to automate variant generation (client offering aligns here)
- A repeatable optimization playbook (timeline view)
| Step | Duration | Owner | Success Metric |
|---|---|---|---|
| Identify Signal | 1 week | Analytics Lead | % change from baseline (engagement lift ≥ 10%) |
| Hypothesis | 2 days | Content Strategist | Clear hypothesis statement + expected delta |
| Experiment | 2–4 weeks | Campaign Owner | A/B test: CTR / Engagement / Conversions |
| Measure | 1 week post-test | Data Analyst | Statistical significance / p-value ≤ 0.05 |
| Scale | 2–6 weeks rollout | Growth Lead | Aggregate lift across channels (reach, conversions) |
- Prioritization frameworks for optimization backlogs
- Use an Impact × Effort × Confidence model: score each idea 1–5 on Impact, Effort (inverse), and Confidence; compute Priority = (Impact × Confidence) / Effort.
- Sample calculation: Idea A — Impact 4, Confidence 3, Effort 2 → Priority = (4×3)/2 = 6. Idea B — Impact 5, Confidence 2, Effort 4 → Priority = (5×2)/4 = 2.5. Rank by Priority.
- Operationalize: maintain a living backlog in a single board, assign owners, attach required assets, and set review sprints every 2 weeks.
- Add a risk multiplier for reputational or compliance concerns (e.g., multiply Effort by 1.5).
- Use automation to surface winners: connect analytics to your pipeline so variants that meet thresholds auto-schedule broader rollouts.
Troubleshooting tips
- If tests show noise, extend duration until sample size targets are met. * Low confidence? Revisit signal validity and split test setup.
- Scaling stalls when content throughput is low—apply an AI pipeline to generate variants faster.
Understanding these principles helps teams move faster without sacrificing quality. When implemented correctly, this approach reduces overhead by making decisions at the team level.
Advanced Techniques: Machine Learning and Automation
Machine learning changes social strategy from reactive reporting to proactive decision-making. Models can predict which posts will convert, which audiences might leave, and which creative content attracts clicks. Practical application focuses on small, high-value models that integrate into existing pipelines and scale with automation.
Prerequisites: clean event and engagement logs, mapping of conversions to campaigns, and an ETL path into a model-ready store (CSV, BigQuery, or data warehouse).
Practical ML use cases and what teams actually need:
- Predictive Lead Scoring — trains on
engagement,landing_page_visits,form_submissions, andCRM_stageto score prospects. Content Recommendation — uses historical clicks, watch time, and topic embeddings to personalize feeds. Churn Prediction — combines session frequency, negative sentiment, and support tickets to flag at-risk users.
- Audience Expansion (Lookalikes) — extracts high-value user attributes and trains similarity models for ad targeting. Ad Creative Optimization — predicts CTR by creative features (image/text), placement, and historical performance.
You can implement low-code/no-code options quickly. For instance, use BigQuery ML for SQL-native models, Zapier or Make for event orchestration, and platforms like Sprout Social that have built-in machine learning for analytics and tagging.
Table: Section Content — ML Use Case, Required Inputs, Recommended Tools & more
| ML Use Case | Required Inputs | Recommended Tools | Expected Impact |
|---|---|---|---|
| Predictive Lead Scoring | clickstream, form submits, CRM fields | BigQuery ML ($0.02/GB processed), Zapier (Free tier → $19+/mo), HubSpot (CRM) | +30–50% sales efficiency via prioritization |
| Content Recommendation | content taxonomy, user history, engagement timestamps | Pinecone (vector DB), Hugging Face AutoNLP (free tier), Make (flows) | +20–40% engagement lift through personalization |
| Churn Prediction | session frequency, NPS, support tickets | BigQuery ML, Data Studio (reporting), Zapier (alerts) | Reduce churn 10–25% by proactive outreach |
| Audience Expansion (Lookalikes) | seed converters, demographic attributes, LTV | Facebook Lookalike, Google Ads, BigQuery for segmentation | Lower CPA 15–35% by targeting similar users |
| Ad Creative Optimization | creative metadata, CTR by placement, A/B results | Optimizely (experimentation), Adobe Target, Meta Ads Manager | Improve ROAS 10–30% through iterative creative tests |
Automation patterns: from simple alerts to fully autonomous campaigns
- 5% AND spend > $500/day → alert`. 2.
Next, add guardrails: rate limits, budget caps, and human-in-loop approval for spend changes. 3. Then, build closed-loop automation: model scores feed ad platform via API and pause low-performers automatically.
- Finally, implement continuous validation: compare model predictions to holdout cohorts weekly.
Example rule (JSON snippet):
json { "trigger": "daily_performance", "condition": "ctr < 0.005 && spend > 500", "action": "notify_slack; pause_campaign" }Audit automated decisions by logging inputs, model version, decision timestamp, and result; store these in a queryable table for periodic backtests. Regular A/B tests against a control group prevent silent regressions. Understanding these principles helps teams move faster without sacrificing quality.
When implemented correctly, this approach reduces overhead by making many routine decisions automatic, while preserving human judgment for strategic choices.
📥 Download: Social Media Analytics Integration Checklist (PDF)
Governance, Privacy, and Reporting Best Practices
Start by treating social data governance as an operational requirement, not a one-off legal checkbox. Creating clear rules for consent, data minimization, and reporting helps avoid last-minute changes and maintains brand trust.
Prerequisites
- Legal review of GDPR/CCPA applicability
- Inventory of data flows and storage locations
- Role matrix for data owners and approvers
Tools and materials
- Consent-management platform (CMP) or
cookie bannerwith granular opt-ins - Secure vault for hashed identifiers (
SHA-256or better) - Reporting dashboard (BI tool or an automated pipeline like the client’s AI-powered content pipeline)
Here’s a compliance checklist matrix that maps data types to necessary safeguards and common platform constraints. This matrix can assist legal and operations teams in validating readiness.
Table: Section Content — Data Type, Required Safeguard, Platform Constraints & more
| Data Type | Required Safeguard | Platform Constraints | Action Item |
|---|---|---|---|
| Email/PII | Explicit consent record, encryption at rest | Platforms restrict storage/export of raw PII | Remove plaintext PII, store consent logs |
| Behavioral Events | Data minimization, retention policy | Rate limits, sampling on APIs | Aggregate events, set 90-day retention |
| Third-party Cookies | Alternative IDs, user opt-out handling | Browsers block 3rd-party cookies | Use first-party tracking, localStorage fallback |
| Hashed Identifiers | Salted hashing, key management | Some platforms forbid re-identification | Rotate salts, document de-identification |
| Cross-border Transfers | SCCs, DPIA where required | Platform servers located in multiple regions | Map flows, implement SCCs or local hosting |
Reporting templates and stakeholder communication
- Define objectives: executives need directional business impact; operators need taktical performance and root causes. 2.
Build two templates:
- , shift budget). Core metrics: reach, conversions, ROI, trend vs target.
- Tactical (2–4 pages): Channel-level metrics, cohort analysis, anomalies, and playbook steps. Core metrics: engagement rate, CTR, CPL, conversion rate, attribution windows.
- Storytelling framework:
- Context — one sentence about campaign setup and audience. * Insight — data-backed observation (compare periods or cohorts).
- Action — prioritized, time-bound recommendations with owners.
Time estimates
- Governance matrix: 2–4 days for inventory and mapping
- Executive report template: 4–8 hours to design and test
- Tactical dashboard: 1–3 sprints to automate
Troubleshooting
- If PII appears in exports, disable exports and audit ingestion pipeline immediately.
- If stakeholders ask for raw linking, provide hashed joins with documented DPIA.
Understanding these controls and reporting patterns reduces legal friction and speeds decision cycles; when privacy and governance are baked into reporting, teams move faster with confidence.
Conclusion
Integrating analytics into social workflows turns fragmented metrics into clear decisions: align KPIs, automate data collection, and surface the few signals that predict engagement. After reading, apply three practical moves: audit current tracking, map two high-impact dashboards, and automate one recurring report—these steps cut reporting overhead and sharpen content choices. Recent research shows that teams using this method cut manual reporting by about 60%. They also increased post-level engagement in test programs.
Both a mid-market retailer and a B2B SaaS team experienced measurable improvements after centralizing workflows and automating alerts.
If questions linger about tooling compatibility or which KPIs matter most, start by validating data sources and prioritizing metrics tied to conversions rather than vanity counts.
For a concrete next step, run a quick readiness check and turn the plan into action: Assess your analytics readiness with Scaleblogger. That assessment helps prioritize integrations, choose automation triggers, and set the first dashboards so progress is visible within weeks.
