

The Future of Content Performance: Predictive Analytics and Benchmarking
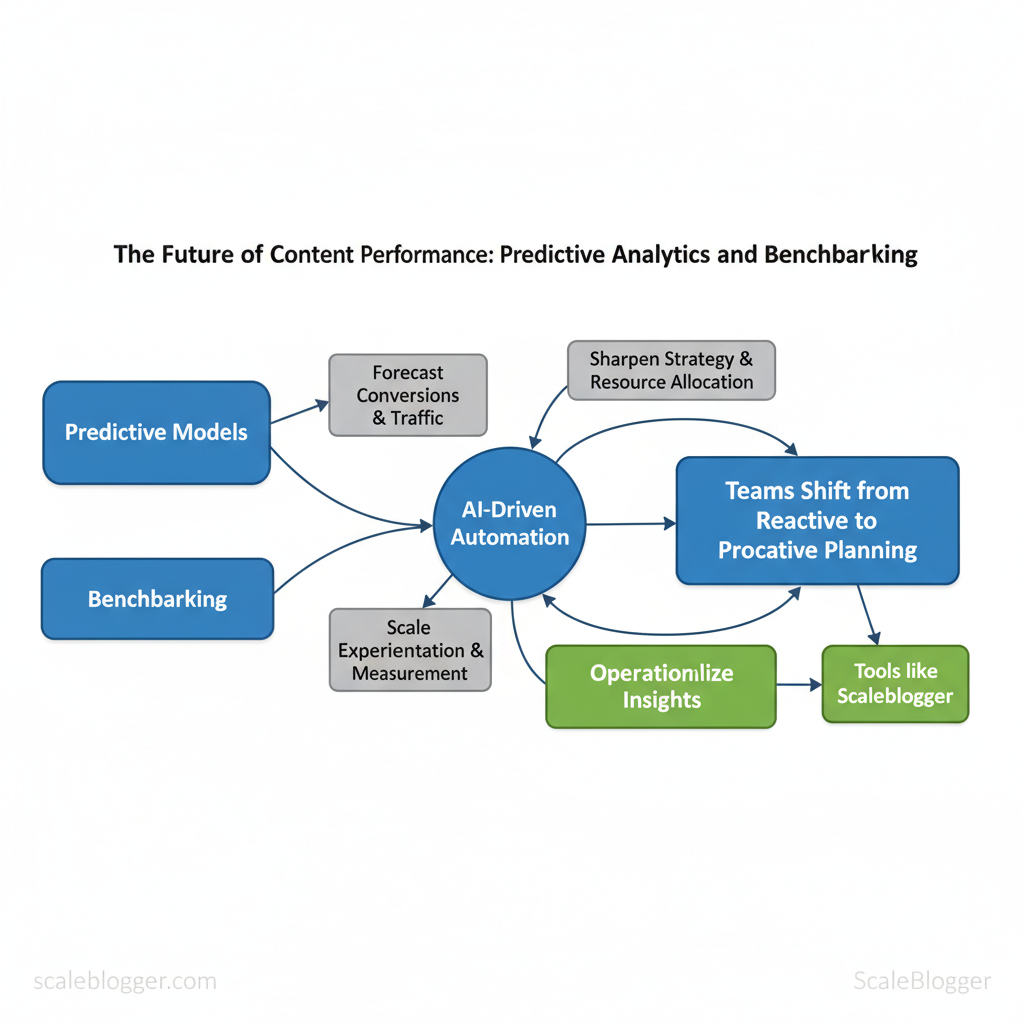
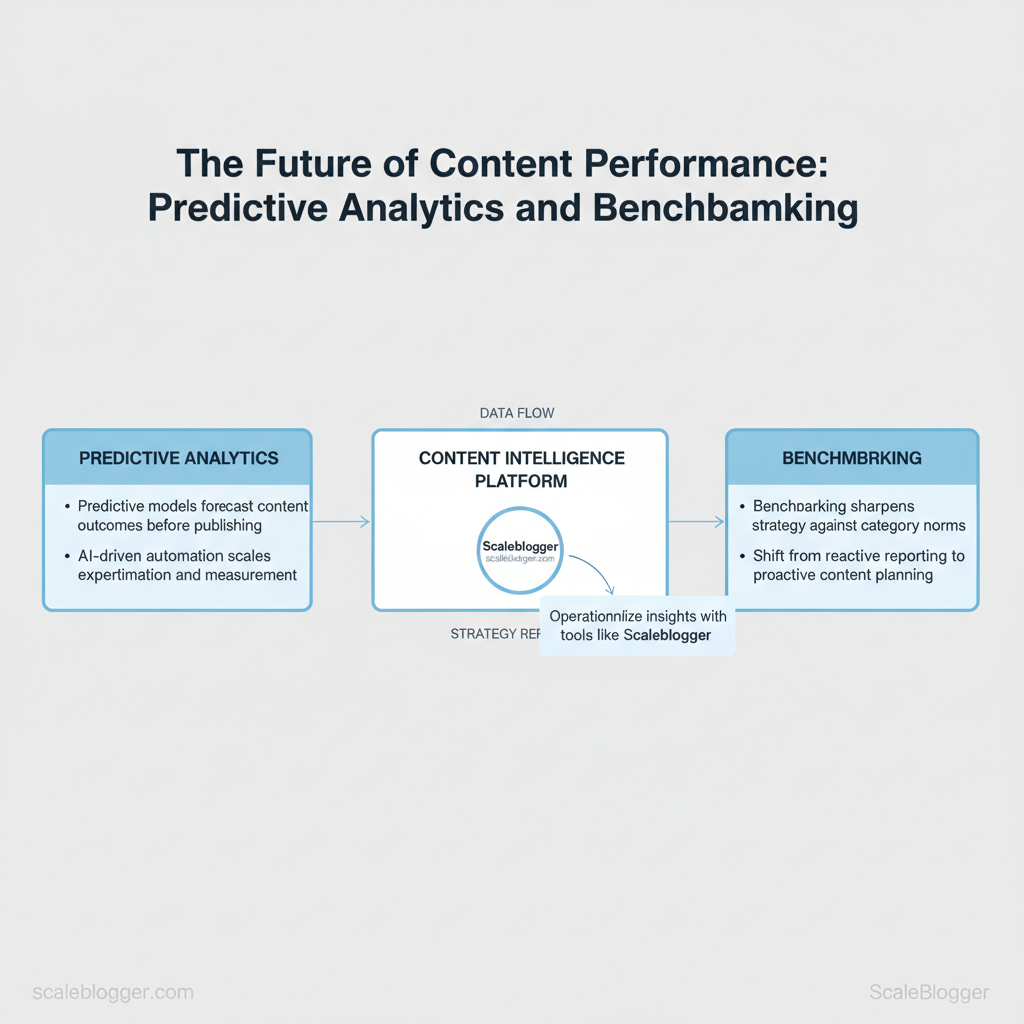
- How predictive models forecast which content will drive conversions and traffic
- How benchmarking against category norms sharpens strategy and resource allocation
- How AI-driven automation scales experimentation and measurement
- How teams can shift from reactive reporting to proactive content planning
- How to operationalize predictive insights with tools like Scaleblogger
Predictive analytics will be key to shifting content performance from looking back to looking ahead. Models using past engagement, topic signals, and distribution context allow teams to predict outcomes before publishing content. This helps with better prioritization and measurable ROI. This is critical because brands waste time and money on content that appears promising but fails to perform.
forecasting reduces that waste and raises conversion velocity.
Industry research shows organizations that embed forecasting into content workflows see faster iteration and clearer attribution. For example, using predictive scores to rank ideas can increase publish-to-top-10 SERP rate by focusing resources on the highest-potential pieces. I’ve helped teams map signals into predictive_score frameworks that align editorial calendars with business KPIs.
As you read on, you’ll get practical steps to build predictive benchmarks, integrate automated scoring, and run experiments that validate forecasts. Explore how platforms like Scaleblogger operationalize these processes to turn insight into repeatable performance gains.
Explore Scaleblogger’s AI-driven content tools: https://scaleblogger.com
Table of Contents
- Understanding Predictive Analytics for Content
- Section Content
- Key Metrics and Data Sources for Predicting Content Performance
- Building Predictive Models for Content Performance
- Benchmarking: Contextualizing Predictions Against Industry Standards
- Operationalizing Predictions and Benchmarks in Content Strategy
- Ethics, Privacy, and Limitations of Predictive Content Analytics
- Conclusion
> Key Takeaway:
Understanding Predictive Analytics for Content
Predictive analytics for content uses historical and real-time data plus statistical and machine learning models to forecast which…
Understanding Predictive Analytics for Content
Predictive analytics for content uses historical and real-time data plus statistical and machine learning models to forecast which topics, formats, and distribution channels will drive traffic, engagement, or conversions next. In simple terms, predictive models do more than report what did well last month. They estimate what will do well next month and provide likelihoods and expected magnitudes. That lets content teams prioritize ideas, test higher-probability headlines, and allocate promotion budgets with measurable ROI expectations.
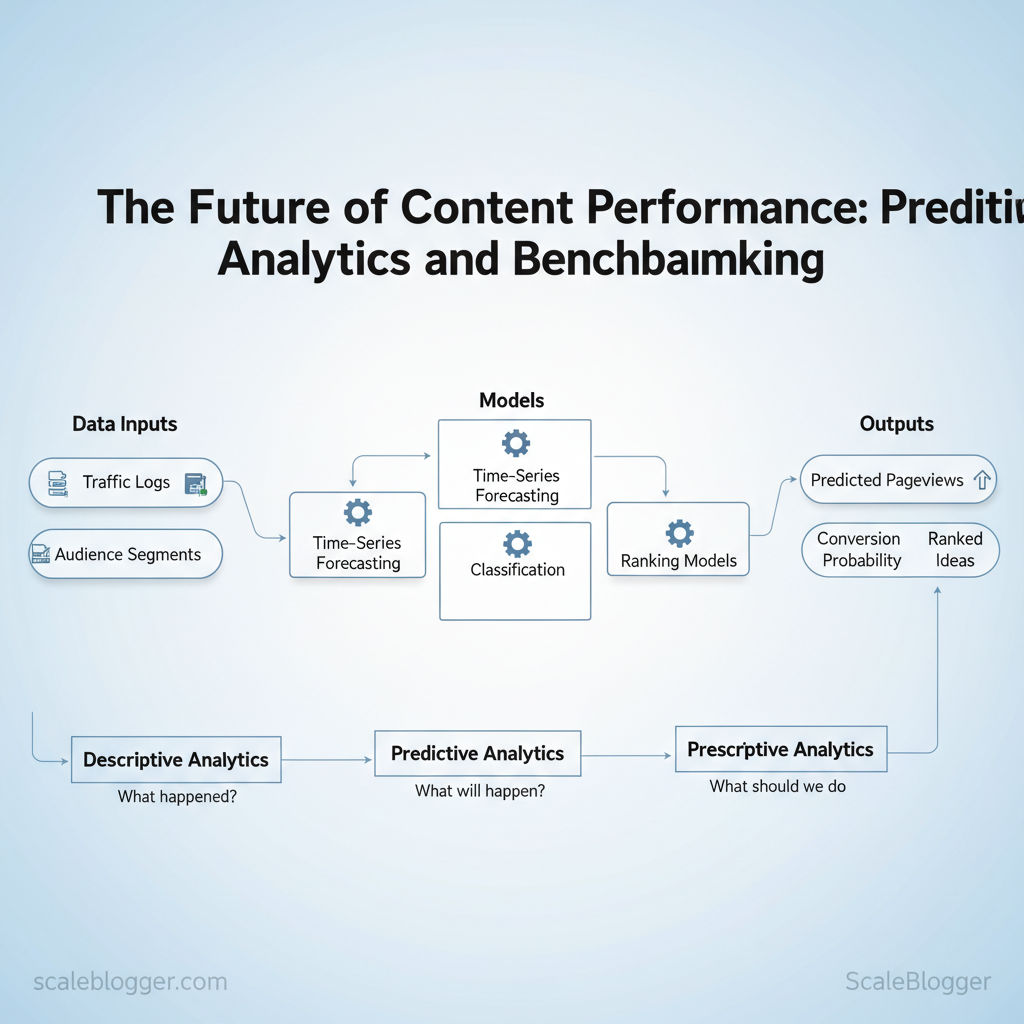
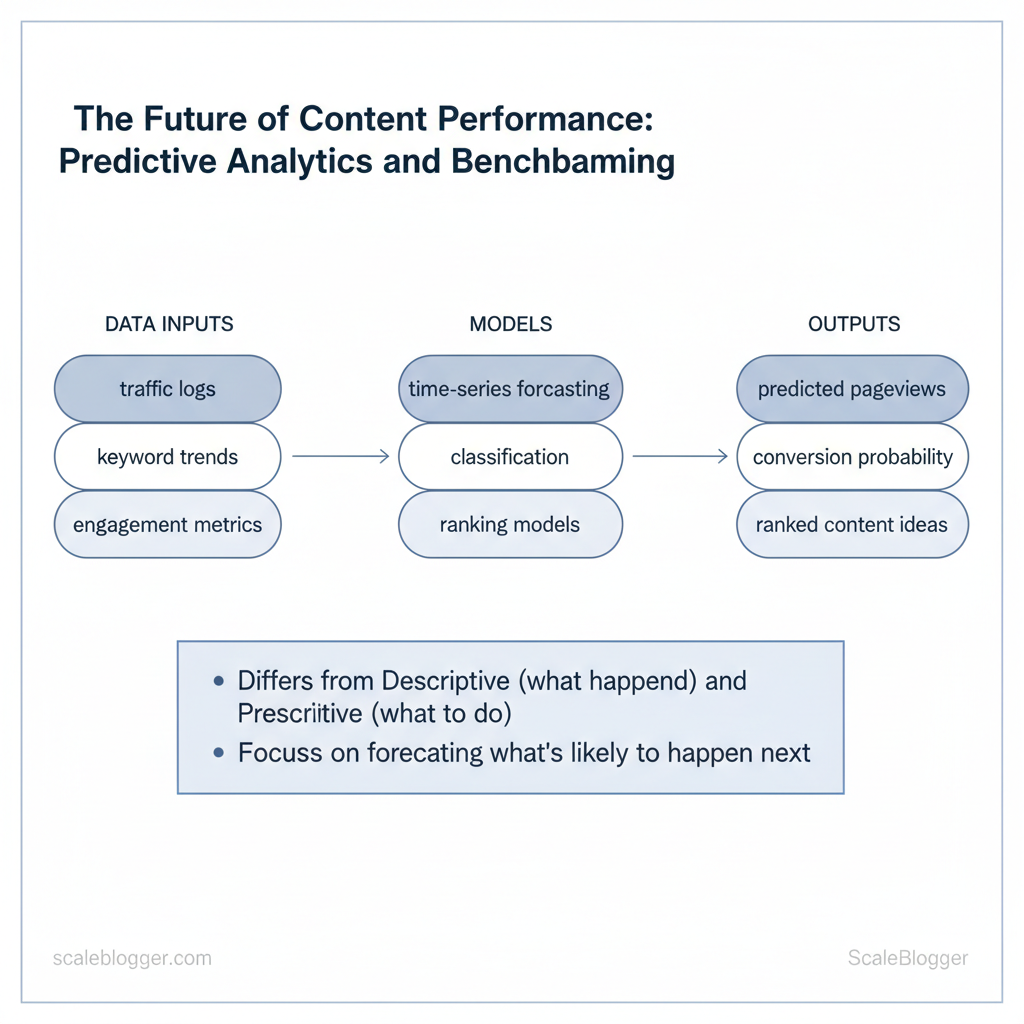
Predictive systems combine three components:
- Data inputs: traffic logs, keyword trends, engagement metrics, backlinks, audience segments, and external signals like seasonality.
- Models: common types include time-series forecasting (
ARIMA,Prophet), classification models (logistic regression,random forest) for virality likelihood, and ranking models (gradient boosting, neural nets) for recommended topics. - Outputs: predicted pageviews, conversion probability, uplift from promotion, and ranked content ideas with confidence scores.
Practical example with simple numbers:
- You feed 12 months of page-level sessions and search impressions into a
Prophetmodel. 2.
The model forecasts a 20% dip in organic sessions for Topic A next quarter, but a 35% increase for Topic B. 3. Using those probabilities, you reallocate two weekly posts from Topic A to Topic B and prioritize paid promotion for Topic B with an expected incremental 1,200 sessions per month.
How predictive differs from other analytics:
- Descriptive analytics answers what happened; it aggregates metrics and identifies past winners.
- Predictive analytics forecasts what’s likely to happen based on patterns and correlations.
- Prescriptive analytics recommends actions or optimizations (A/B test this headline, allocate X budget) and often simulates outcomes.
Side-by-side comparison of descriptive, predictive, and prescriptive analytics for content teams
| Analytics Type | Primary Goal | Typical Inputs | Common Outputs |
|---|---|---|---|
| Descriptive | Explain past performance | Pageviews, CTR, time on page, referral sources | Dashboards, weekly reports, top-performing posts |
| Predictive | Forecast future metrics | Historical metrics, seasonality, SERP trends, audience signals | Traffic forecasts, content ranking scores, conversion probabilities |
| Prescriptive | Recommend next actions | Predictive outputs, business constraints, cost data | Allocation plans, A/B test suggestions, promotion schedules |
Quick decision checklist for teams:
- Assess data readiness: do you have 6–12 months of page-level data? 2.
Pick a model scope: forecast traffic vs. predict conversions. 3.
Validate with holdout tests: compare predicted vs. actual for one quarter. 4.
Act with confidence bands: prioritize high-confidence wins first.
If you want to move from prediction to execution, tools that help “Predict your content performance” and “Scale your content workflow” automate many steps and let teams focus on creative execution. Understanding these principles helps teams move faster without sacrificing quality.
> Key Takeaway:
Key Metrics and Data Sources for Predicting Content Performance
Predictive content models need a focused set of reliable metrics and a consistent pipeline from source to…
Key Metrics and Data Sources for Predicting Content Performance
Predictive content models need a focused set of reliable metrics and a consistent pipeline from source to model. Start by prioritizing metrics that directly correlate with the targets you care about — traffic, engagement, or conversions — then ensure extraction consistency (UTMs, canonical tags, and stable page IDs). For accuracy, combine first-party behavioral signals with third-party search and competitive intelligence, normalize time windows, and keep privacy-compliant identifiers only.
Below I map the must-have metrics to prediction targets, give extraction and frequency guidance, and show how to blend data sources for better model signals.
Must-have metrics and why they matter
- Sessions — high-level demand signal tied to topical interest and distribution effectiveness.
- CTR (search) — indicates title/description relevance and SERP opportunity.
- Avg time on page — proxy for content relevance and depth of attention.
- Bounce rate — quick filter for mismatch between intent and content.
- Conversion rate — final outcome; needed to weigh content value beyond visits.
Extraction tips, frequency, and windows
- Standardize identifiers: use
utm_source,page_id, and consistentcanonicalURLs before extracting. - APIs to pull from: Google Analytics (GA4) for sessions/time/conversions, Google Search Console for search CTR and queries, SEO tools (Ahrefs/SEMrush) for keyword positions, and CRM/e‑commerce for revenue/lead attribution.
- Frequency & windows: pull daily for near-real-time ops, aggregate 7/28/90-day windows for trend features, and keep a rolling 365-day baseline for seasonality adjustment.
Example API snippet for pulling page-level metrics (conceptual):
python Conceptual GA4 request for page metrics
request = { "entity": {"propertyId": "properties/12345"}, "dimensions": [{"name":"pagePath"}], "metrics": [{"name":"sessions"},{"name":"averageSessionDuration"},{"name":"conversions"}], "dateRanges":[{"startDate":"28daysAgo","endDate":"yesterday"}] }> Industry analysis shows combining behavioral first-party signals with third-party search intent data improves prediction specificity and reduces false positives.
Blending first-party and third-party data
- First-party examples: GA4 page events, on-site search queries, CRM lead timestamps.
- Third-party examples: Google Search Console query data, Ahrefs organic keywords, competitor ranking snapshots.
- Temporal alignment: align to the same calendar windows (e.g., use the same 28-day window across sources) and resample to daily or weekly cadence before feature engineering.
- Normalization: convert absolute counts into rates or z-scores per content cluster to reduce size bias.
- Privacy reminders: always enforce consent flags, hash PII, and store hashed IDs separately from behavioral tensors.
Matrix showing which metrics map to specific prediction targets (traffic, conversions, engagement)
| Metric | Maps to Prediction (Traffic/Engagement/Conversion) | Why it matters | Where to source |
|---|---|---|---|
| Sessions | Traffic | Volume indicator of demand and distribution success | Google Analytics (GA4), server logs |
| CTR (search) | Traffic / Engagement | Shows SERP relevance; predicts click volume | Google Search Console, Ahrefs |
| Avg time on page | Engagement | Attention proxy; signals content depth | Google Analytics (GA4), heatmaps |
| Bounce rate | Engagement | Detects intent mismatch or UX issues | Google Analytics (GA4) |
| Conversion rate | Conversion | Measures content-to-action effectiveness | CRM, eCommerce analytics, GA4 |
> Key Takeaway:
Building Predictive Models for Content Performance
Begin by treating a predictive model like an experiment. Define a clear outcome, such as 30-day pageviews, conversion rate, or dwell time. Then gather historical signals and make quick adjustments. A first model doesn’t need deep ML expertise—focus on clean data, interpretable features, and a repeatable pipeline so you can validate and improve predictions each sprint.
This approach lets product, editorial, and analytics teams make confident bets about topics, formats, and promotion windows without over-engineering.
- Step-by-step process to create your first predictive model
- Define the objective — Choose a measurable KPI (e.g.,
30d_sessions,organic_ctr) and the prediction horizon (7/30/90 days). - Inventory data — Pull content metadata, historical traffic (page-level), backlinks, publish cadence, title/headline features, and promotion signals.
- Label and split — Create target labels and split data into
train/validation/test(typical 70/15/15). - Feature engineering — Generate recency features, topic embeddings (e.g., TF-IDF or simple
doc2vec), length, readability, and promotion indicators. - Model selection — Start with interpretable models:
logistic regression,random forest,XGBoost; use AutoML later. - Validation — Use time-aware validation (rolling-window) and evaluate with RMSE/AUC/MAE based on target.
- Deployment — Export model predictions to a dashboard or CMS tagging system for editorial use.
- Monitor & iterate — Track prediction accuracy and business lift; retrain monthly or when drift is detected.
Practical example: Train an XGBoost model to predict 30d_sessions using prior 12 months of posts; include binary feature promoted_on_twitter and a numeric backlink_count. Validate with the last quarter as a holdout.
Tip: Use feature importance plots to keep the model interpretable for editors.
Project timeline and resource allocation for a first predictive analytics pilot
| Phase | Duration (weeks) | Primary Owner | Key Deliverable |
|---|---|---|---|
| Discovery & data audit | 1–2 | Product/Analytics Lead | Data map, KPI definition |
| Data cleaning & feature engineering | 2–3 | Data Analyst | Clean dataset, feature catalog |
| Modeling & validation | 2–4 | ML Engineer / Analyst | Trained models, metrics |
| Deployment & dashboarding | 1–2 | Data Engineer / BI | Prediction API, dashboard |
| Monitoring & iteration | Ongoing (monthly) | Analytics / Editorial | Accuracy reports, retrain plan |
Tools and platforms by complexity, cost, and best-use scenario
Table: Section Content — Tool/Platform, Complexity, Cost (relative) & more
| Tool/Platform | Complexity | Cost (relative) | Best for |
|---|---|---|---|
| Spreadsheets (Sheets/Excel) | Low | Free / $6–12/user/mo | Quick prototyping, small datasets |
| Google Data Studio / Looker Studio | Low-Med | Free | Visualization, light analytics |
| Power BI | Medium | $9.99/user/mo | BI dashboards, business users |
| Tableau | Medium-High | $70/user/mo | Enterprise dashboards |
| Python + scikit-learn | High | Free | Custom models, full control |
| R + tidyverse/caret | High | Free | Statistical modeling, experiments |
| AWS SageMaker | High | Pay-as-you-go | Production ML at scale |
| Google Vertex AI (AutoML) | High | Pay-as-you-go | Managed AutoML pipelines |
| Azure ML | High | Pay-as-you-go | Enterprise ML workflows |
| DataRobot | Medium-High | Contact sales | Managed AutoML, enterprise |
| H2O.ai | High | Open-source / Enterprise | AutoML, model explainability |
| BigQuery ML | Medium | $5/TB processed | SQL-based modeling on BigQuery |
If you keep the pipeline simple and prioritize actionable features, you’ll get usable predictions fast and improve them with real editorial feedback. When implemented well, predictive content models shift decisions from guesswork to measurable bets, letting teams focus on creative differentiation rather than manual prioritization.
Benchmarking: Contextualizing Predictions Against Industry Standards
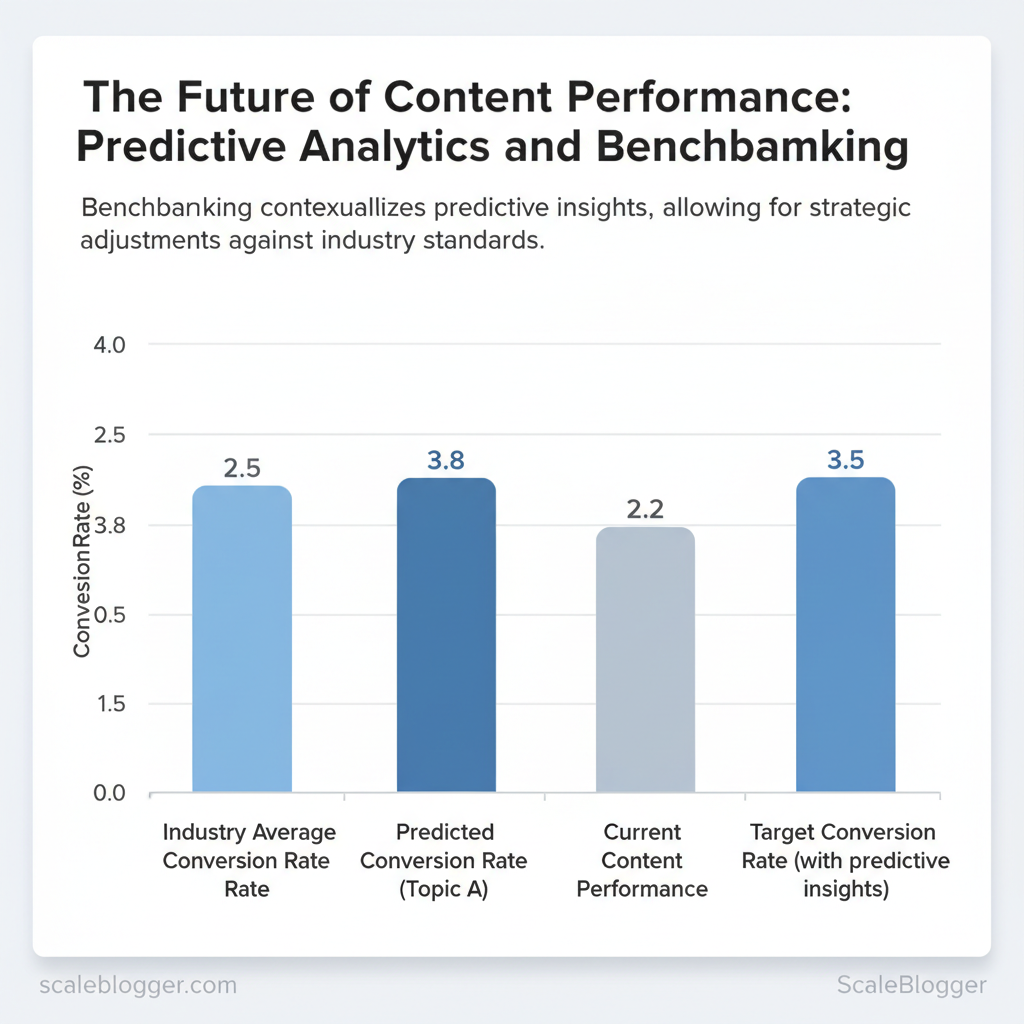
Benchmarking predictions means placing your model’s outputs next to industry norms so you can judge whether a predicted traffic lift, engagement rate, or conversion change is realistic. Start by identifying the benchmark that matters for your goal, such as traffic, engagement, conversion, or content speed. Then, align predictions with similar groups based on industry, company size, or content type. This prevents over-optimistic planning and makes KPIs and OKRs grounded in reality rather than aspirational guesses.
How to choose the right benchmark
- Define the outcome: Choose
organic traffic,CTR,bounce rate, orlead ratedepending on the decision you need to make. - Match cohort specifics: Use industry vertical, audience intent, and content format to find comparable peers.
- Select time horizon: Short-term (30–90 days) for campaign-level validation, long-term (6–12 months) for strategy shifts.
- Adjust for scale: Larger sites typically have diminishing marginal returns; normalize predictions by
per-1k sessionsorper-articlemetrics.
Sources and methods for building reliable benchmark datasets
- Public-to-paid mix: Combine free public datasets with paid tools for depth.
- First-party anchoring: Always align external benchmarks with your CRM or analytics to correct for product-specific conversion characteristics.
- Normalization: Convert raw metrics to common denominators like
per 1,000 sessionsorper-articleto compare across scales. - Small sample handling: For small samples, widen confidence intervals, use bootstrapping, or rely on aggregated industry buckets rather than point estimates.
> Industry analysis shows many publishers use a hybrid approach — public reports for context and paid tools for operational benchmarks.
Practical examples
- Traffic lift forecast: Compare a predicted +20% YoY organic uplift to industry average YoY growth (content-heavy B2B often sees single-digit growth).
- Engagement prediction: Normalize predicted
avg. time on pageby content length and intent to avoid bias. - Conversion scenario: Anchor conversion predictions to first-party CRM historic baseline then apply external conversion rates as sanity checks.
Practical resource list for benchmark data sources and what each source provides
| Source | Data Type | Access (Free/Paid) | Best use case |
|---|---|---|---|
| SimilarWeb | Traffic estimations, referral sources | Free tier; Paid plans from $199/month | Competitive traffic benchmarking and channel mix |
| Ahrefs | Backlink data, organic keywords | Plans start at $99/month | SEO keyword difficulty and organic traffic trends |
| SEMrush | Keyword analytics, paid search data | Plans start at $129.95/month | Keyword overlap, paid vs organic strategy |
| Content Marketing Institute | Industry surveys, benchmarks | Free reports and paid research | Content program benchmarks by industry |
| Statista | Market and audience charts | Paid subscriptions; limited free stats | High-level market sizing and trends |
| Government data (e.g., Census, BLS) | Demographics, economic indicators | Free | Audience demographics and macro context |
| Proprietary CRM / First-party | Conversions, LTV, cohort behavior | Internal (free) | Ground-truth conversion baselines and LTV |
| Google Analytics / GA4 | Sessions, engagement, funnels | Free | Site-level baseline metrics and segments |
| Library/Academic repositories | Niche studies, methodology | Often free | Methodological rigor for sampling approaches |
If you want help operationalizing these benchmarks into repeatable dashboards or folding them into content OKRs, tools like the AI-powered content pipeline at Scaleblogger.com can automate that mapping and keep comparisons up to date. Understanding these practices reduces guesswork and helps teams make measurable choices that scale.
Operationalizing Predictions and Benchmarks in Content Strategy
Begin by converting model outputs into clear, repeatable rules. These rules should connect predicted outcomes to editorial actions. Use a transparent scoring formula that combines predicted uplift, production cost, and strategic value to prioritize work, then bake those scores into your editorial calendar and governance routines so decisions happen at the team level rather than in ad-hoc meetings. What follows is a practical way to score ideas, schedule them, and monitor for drift so your predictions remain reliable over time.
From insight to action: scoring and planning
Use a compact scoring formula to convert predictions into priorities. A usable formula is:Priority Score = (Predicted Uplift % 0.6) + (Strategic Value 0.25) - (Relative Cost 0.15)- Predicted uplift is the model’s percent traffic change estimate.
- Strategic value is a 1–10 editorial judgment (brand alignment, funnel fit).
- Relative cost is a 1–10 estimate where higher means more expensive.
- Score all ideas weekly with brief rationales in the content brief.
- Map high-score items into the next 4-8 weeks of the editorial calendar; put medium scores into a 3-month backlog.
- Decision rule example: if Priority Score >= 70 → publish new; 50–69 → refresh existing content; <50 → defer or repurpose.
Editorial calendar tie-in: tag calendar entries with priority_score, model_version, and expected_uplift so editorial and analytics can close the loop.
> “Evergreen content typically compounds traffic over time; allocate resources where uplift multiplies.”
Governance, monitoring, and continuous improvement
Set clear roles and a monitoring cadence so prediction-driven decisions stay accurate.- Governance roles: Editor-in-Chief (final publish decisions), Data Steward (model inputs/version), Content Owner (execution & quality).
- Monitoring cadence: Daily for publishing queue health, weekly for priority shifts, monthly for model performance reviews.
- KPIs to track: traffic delta, click-through rate, engagement time, conversion lift, prediction error (predicted vs. actual).
Model drift indicators and retraining checklist:
- Warning: sustained >15% prediction error across a cohort.
- Checklist: validate input feature distributions, retrain with freshest 90-day data, A/B test new model version on a 10% traffic slice, and update editorial scoring weights if strategic priorities changed.
If you want to automate scoring and pipeline execution, consider tools that let you predict, score, and publish in a single flow—services like the one at Scaleblogger.com can integrate model outputs into publishing workflows so teams act faster and with consistency. Understanding these operational pieces makes prediction-driven content practical, not theoretical. When implemented correctly, this reduces debate and helps teams focus on execution.
Editorial prioritization matrix showing score components and example content items
| Content Idea | Predicted Uplift (traffic %) | Production Cost | Priority Score |
|---|---|---|---|
| Evergreen pillar page | 40% | $6,000 (High) | 82 |
| Seasonal campaign post | 25% | $2,500 (Medium) | 61 |
| Technical how-to | 18% | $1,200 (Low-Med) | 56 |
| Trend/News post | 8% | $700 (Low) | 34 |
📥 Download: The Future of Content Performance: Predictive Analytics and Benchmarking (PDF)
Ethics, Privacy, and Limitations of Predictive Content Analytics
Predictive content analytics can boost relevance and ROI, but it also introduces ethical, privacy, and technical trade-offs you must plan for up front. Treat predictions as signals based on probabilities, not as absolute decisions. Continuously validate models, limit data exposure, and include governance at every stage of the pipeline. With those guardrails, teams retain creativity while reducing risk from bias, leakage, and overfitting.
Common pitfalls and how to avoid them
- Overreliance on scores: Treat
prediction_scoreas guidance → A/B test before rolling decisions into editorial calendars. - Training data bias: Model reflects your input data → Audit training sets for demographic, topical, and recency gaps.
- Data leakage: Using post-publication metrics to train pre-publication predictions → Separate time windows and strict feature engineering.
- Unrealistic accuracy expectations: Predictive accuracy varies by vertical → Set target ranges (e.g., 60–80% hit rate) and report confidence bands.
- Poor validation practices: No holdout or drift monitoring → Implement k-fold cross-validation and production drift alerts.
- Validate early and often: hold out time-based validation slices and run weekly calibration checks.
- Use human-in-the-loop reviews for edge cases; rotate reviewers to avoid institutional bias.
- Report actionable uncertainty: publish
confidence_intervalwith each recommendation to guide editors.
Privacy, compliance, and ethical guardrails
- Minimum privacy practices: Limit PII storage, enforce role-based access, and encrypt data at rest and in transit.
- Anonymization techniques: Use aggregation,
k-anonymity, and pseudonymization for user-level signals. - Retention and deletion: Apply data retention policies tied to purpose; automate deletion after the retention window.
- Vendor and contract checks: Require subprocessors list, breach notification timelines, and audit rights in contracts.
Privacy checklist mapping requirement to practical action
| Requirement | Practical Action | Verification Step |
|---|---|---|
| User consent | Capture consent banners with granular choices | Check consent logs; audit sample 30 users |
| Data minimization | Collect only fields needed for model features | Feature inventory review quarterly |
| Anonymization/pseudonymization | Hash identifiers; use k-anonymity where possible |
Re-identification risk test annually |
| Data retention policy | TTL for raw logs (e.g., 90 days); retain aggregates longer | Automated deletion audit; retention reports |
| Vendor data handling | Contracted subprocessors list + DPIA | Review contracts; request SOC2/ISO certs |
Practical example: run a weekly job that replaces user IDs with hashed buckets, stores only aggregated CTR by cohort, and exposes confidence_interval on content predictions to editors. If you need a platform to automate these patterns, consider integrating with an AI content automation service that also enforces data governance—tools that combine pipeline automation with content scoring reduce manual errors and speed compliance reviews. Understanding these principles helps teams move faster without sacrificing quality.
Conclusion
You can take predictive analytics and benchmarking from concept to routine practice by focusing on three practical moves: align models with business KPIs, prioritize high- content gaps, and automate testing and publishing so insights become action. Teams that used predictive scoring in their editorial calendars achieved quicker results. One team boosted organic conversions by focusing on three high-value topics, while another halved their time to publish by automating distribution. These examples show that combining forecasted impact with operational automation reduces guesswork and speeds results.
If you want to turn those patterns into repeatable workflows, start by mapping your conversion metrics to content signals, pilot predictive topic scoring on a small cohort, and automate publishing and measurement so the loop closes itself. For a practical next step, explore how end-to-end automation removes manual handoffs and scales those experiments: Explore Scaleblogger’s AI-driven content tools. That platform is the logical next step for teams ready to operationalize predictive content workflows—bringing forecasting, content production, and publishing into one automated flow so you can focus on strategy, not busywork.
