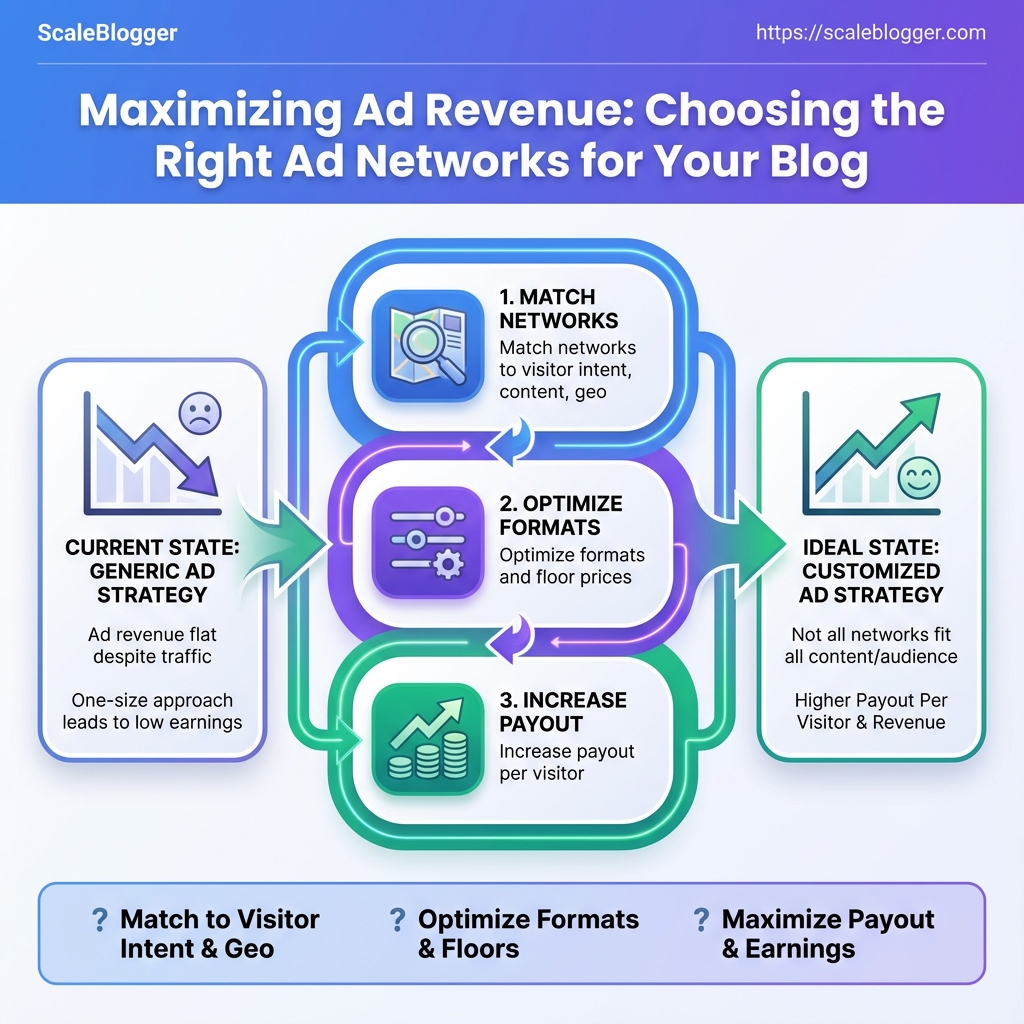
You publish steady traffic but your ad revenue barely moves, and every decision about placements or partners feels like a guess. That gap exists because not all ad networks monetize the same audience, formats, or content niches, and a one-size approach turns high impressions into low earnings. Understanding which networks reward your specific traffic mix is the lever that actually increases payout per visitor.
Identify networks that match visitor intent, content format, and geographic distribution, then optimize formats and floor prices to capture value rather than volume. Explore AI-powered content & monetization workflows — https://scaleblogger.com
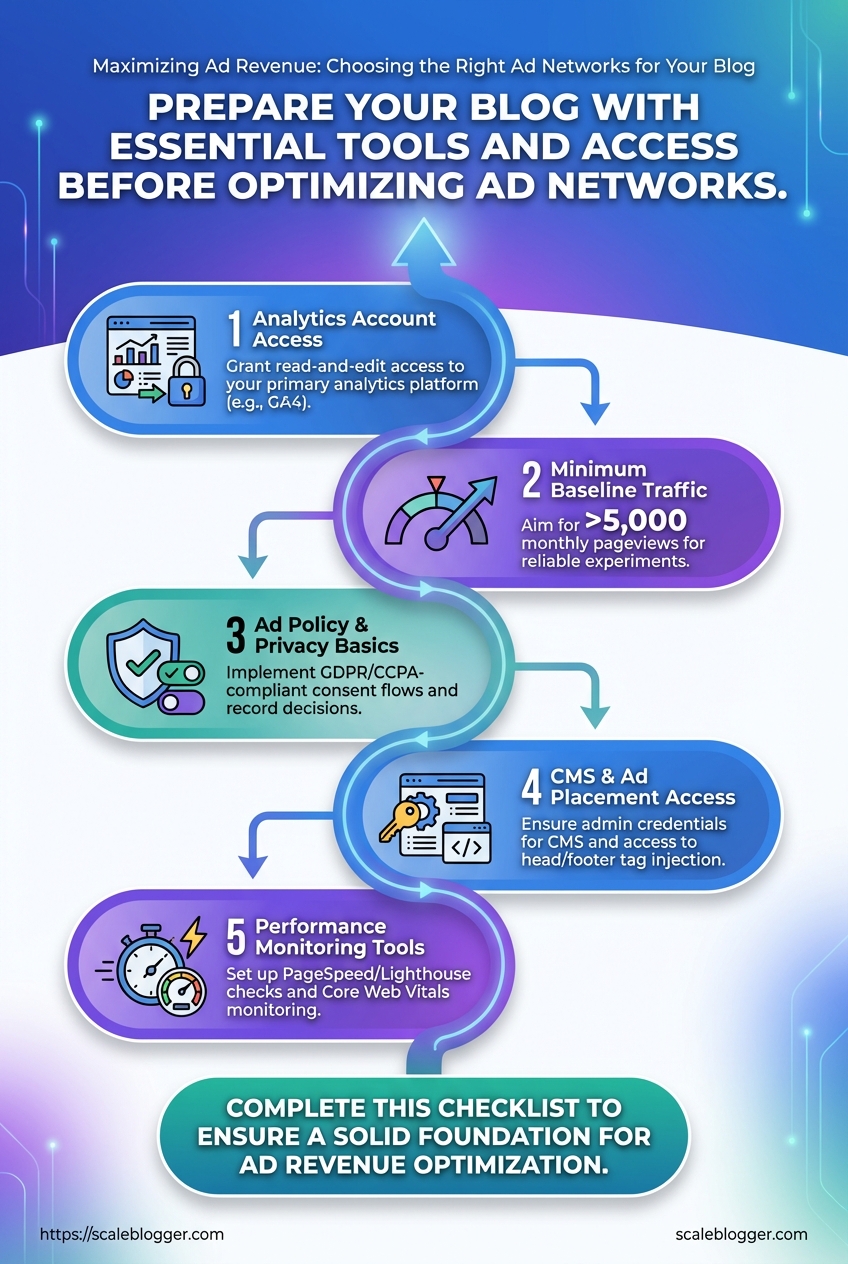
Prerequisites — What You’ll Need Before You Start
Start with a clear analytics foundation. Without reliable measurement, optimization guesses become expensive experiments. Ensure tracking is accurate, consent flows are in place, and you can edit site templates where ads and scripts live.
Analytics account access: Grant read-and-edit access to your primary analytics platform so attribution, conversion events, and traffic segments can be validated.
Minimum baseline traffic: Aim for >5,000 monthly pageviews before rolling ad-network experiments that require statistical significance; smaller sites should prioritize contextual sponsorships or direct deals first.
Ad policy and privacy basics: Implement GDPR/CCPA-compliant consent flows and record consent decisions. Advertisers and networks will require proof of compliant data handling before revenue optimization begins.
CMS and ad placement access: Admin credentials or an editor role for your CMS (for most teams, WordPress) plus access to head/footer tag injection and template editing. Without that you can’t control lazy-loading, ad placeholders, or performance-safe ad code.
Basic performance monitoring tools: Set up PageSpeed/ Lighthouse checks and Core Web Vitals monitoring to spot latency regressions when ads are added.
What to prepare, step-by-step:
- Create or confirm a
GA4property and a separate view for experimentation. - Add at least one verified user with Editor or Admin rights to analytics and your CMS.
- Install a consent-management platform and test consent states across devices.
- Reserve ad slots in templates (desktop, tablet, mobile) and document their sizes and breakpoints.
- Baseline Core Web Vitals and average page load times before any ad calls are added.
Checklist — quick scan before launch:
- Analytics: GA4 property with conversion events and segmenting set up.
- Traffic baseline: Consistent monthly pageviews above 5k or a plan for direct-sell alternatives.
- Privacy/compliance: Active consent banner and logging for GDPR/CCPA.
- CMS access: Edit rights plus ability to add
head/footertags. - Ad placements: Documented slot sizes and responsive behavior.
- Performance tooling: Lighthouse/Field CWV monitoring enabled.
For teams building an automated pipeline, consider integrating an AI-driven content workflow to tie performance signals to ad strategy. Tools like Scaleblogger.com help map content scoring to monetization opportunities and automate parts of this setup. Understanding these basics lets teams move faster without backtracking when revenue experiments start to scale.
Time & Difficulty — Expected Effort and Timeline
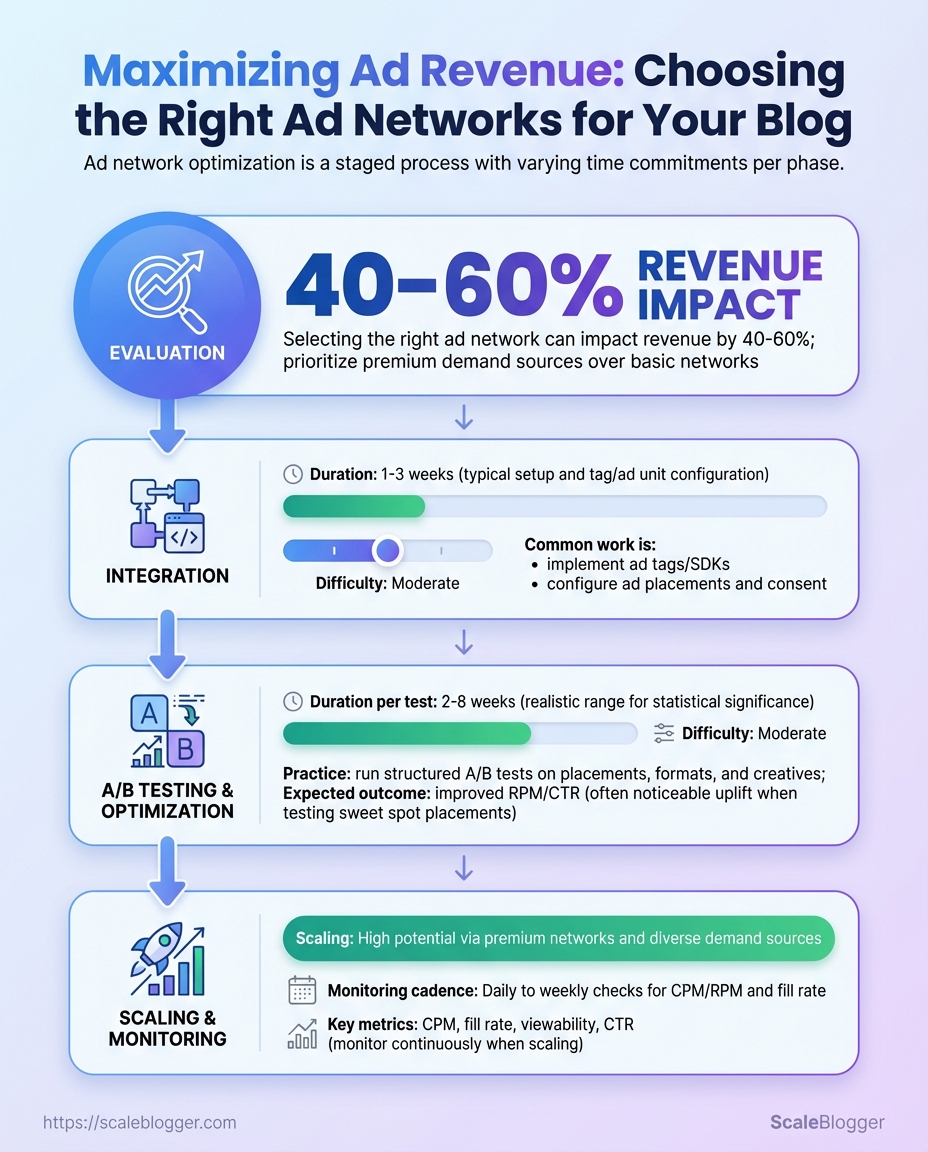
Implementing ad networks and optimizing monetization is a staged effort: initial evaluation and integration are relatively quick, while measurable revenue improvements require iterative testing and ongoing monitoring. Expect a practical implementation window of 2–12 weeks to get ads live and start gathering statistically useful data; meaningful revenue uplift typically appears within 2–6 months depending on traffic volume and experiment cadence.
Start with a short diagnostic to determine readiness.
Traffic baseline: At least 10k monthly sessions for reliable A/B testing.
Analytics: GA4 or equivalent with page-level event tracking.
Ad tech access: Ad network accounts, site header/footer editing, and CMS permissions.
Typical time allocation and responsibilities follow a clear sequence.
- Evaluation — 1–2 weeks
- Integration — 1–3 weeks
- A/B testing & optimization — 4–12 weeks (iterative)
- Scaling & monitoring — ongoing after stable setup
- Reporting cadence setup — first month, recurring monthly thereafter
Skills and difficulty levels
- Technical setup: Moderate — requires front-end editing, consent management, and tag deployment.
- Ad ops: Moderate — knowledge of ad units, viewability, and header bidding basics.
- Data analysis: Intermediate — ability to interpret lift, significance, and RPM trends.
- Content ops coordination: Low to moderate — editorial alignment for layout or content changes.
Practical examples of per-step tasks
- Evaluation: Audit current RPM, viewability, and content types; identify high-impression templates.
- Integration: Install ad tags, configure
prebid.js(if used), and validate on staging. - Testing & optimization: Run layout A/B tests, experiment with ad density and lazy-loading.
- Scaling & monitoring: Automate alerts for RPM drops and traffic shifts.
- Reporting: Build a dashboard tracking RPM, CTR, viewability, and revenue by article.
Phases, actions, and estimated time required to implement and test ad networks
| Phase | Key Actions | Time Estimate | Difficulty Level |
|---|---|---|---|
| Evaluation | Audit traffic, choose networks, set RPM targets | 1–2 weeks | Moderate |
| Integration | Tag installation, consent setup, ad unit placement | 1–3 weeks | Moderate–High |
| Testing & Optimization | A/B tests on layout, sizes, lazy-load timing | 4–12 weeks | High |
| Scaling & Monitoring | Apply winners, header bidding, CMP tuning | Ongoing (2–6 weeks to scale) | High |
| Reporting | Dashboards, weekly snapshots, monthly analysis | 1 week to set up; ongoing | Moderate |
Analysis: Early wins come from resolving technical blockers (consent, slow tags) and testing prominent layouts on high-traffic pages. Smaller sites need longer to reach statistical significance, so prioritize experiments on templates that drive the majority of pageviews. Integrating automation for tag management and reporting compresses the optimization cycle and reduces manual overhead.
Industry tools and automation platforms accelerate many of these steps; consider adding an AI content pipeline like Scaleblogger.com when coordinating content changes with monetization experiments. Understanding these timelines helps teams plan experiments that are fast to iterate yet rigorous enough to produce reliable revenue improvements. When execution follows this sequence, teams move faster without sacrificing data quality.
How to Evaluate Ad Networks — Criteria and Metrics
Start by treating ad-network selection like a product procurement decision: quantify technical performance, revenue potential, and operational fit, then score candidates consistently. Focus on the metrics that directly affect page experience, revenue predictability, and brand safety. Use the same data window (30–90 days) and your site-level baseline when comparing networks so differences reflect the network, not seasonality or content mix.
RPM/eCPM: Measure RPM (revenue per mille) and eCPM over a 30‑day rolling window to normalize traffic spikes. Fill Rate: Track the percentage of ad requests that return a bid; low fill creates blind inventory and reduces RPM. Latency: Compare tag load time and time-to-first-ad; prefer async tags to avoid blocking page paint. Ad Format Variety: Catalog supported formats (native, video, header bidding, rewarded) — more formats mean more monetization paths. Payment Terms: Note payment threshold, frequency, and accepted currencies; delayed or high-threshold payments impact cash flow.
Practical scoring rubric — apply the same weights to each candidate and produce a numeric score for side-by-side ranking.
- Assign weights (example): Revenue metrics 40%, Technical 25%, Operational 20%, Policy/Brand Safety 15%.
- For each criterion, score 1–5 against the measuring method below.
- Multiply score × weight, sum totals, and rank networks; treat anything within 5% of the top score as “tie — validate with an A/B pilot.”
Operational checks to run before onboarding: Reporting latency: Confirm hourly vs. daily aggregation and API access. Targeting capabilities: Verify geo, device, and audience segment support. * Policy enforcement: Request sample ad creatives and brand-safety controls.
Evaluation metrics
side-by-side for quick scoring across networks
| Criterion | How to Measure | Good Threshold | Why It Matters |
|---|---|---|---|
| RPM/eCPM | Publisher analytics: revenue / (pageviews/1000) | > $5 for content sites (varies by niche) | Direct income-per-impression metric |
| Fill Rate | Ad server logs: filled requests / total requests | > 85% | Higher fill reduces lost inventory |
| Latency | Tag timing, TTFB, CLS impact | Tag load < 200ms | Faster tags protect UX and SEO |
| Ad Format Variety | Network spec sheet and demo creatives | Native, display, video, header-bid | More formats unlock revenue channels |
| Payment Terms | Contract and T&C | Net-30 or sooner; <$100 threshold | Affects cash flow and reconciliation |
Key insight: Use weighted scoring to turn subjective impressions into repeatable decisions; start small with a controlled test for top candidates.
When evaluation is repeatable and tied to real test results, switching networks becomes a tactical growth lever rather than a risky experiment. Consider integrating ad-network scoring into your content operations pipeline or tools such as Scale your content workflow for consistent benchmarking and faster decisions.
Step-by-Step Implementation — Choosing and Testing Networks
Start by establishing a solid baseline and a narrow, testable shortlist. Collecting clean data up front prevents chasing noise later and keeps experiments actionable. The process below walks through gathering baseline metrics, choosing candidate networks aligned to audience and content, implementing tags safely, running controlled experiments, analyzing trade-offs, and scaling the winners with monitoring guardrails.
- Gather Baseline Data
- Shortlist Candidate Networks
Export analytics and ad platform reports for the last 30–90 days.
Capture RPM and revenue: Export page-level revenue and compute RPM as (revenue / pageviews) * 1000. Identify top pages: Pull the top 20 pages by combined traffic and revenue. Segment by device and location: Capture device splits (mobile/desktop/tablet) and geolocation percentage by country. Document UX metrics: Page load time, CLS, and bounce rate for those 20 pages.
Target networks that fit audience geography and content verticals.
Mix types: Include programmatic, native, and direct-sold options to compare yield patterns. Limit scope: Shortlist 5–7 candidates to keep test complexity manageable. Evaluate minimums: Check traffic minimums and payment terms before onboarding.
Quickly compare candidate ad networks on key features to decide shortlist
| Network | Ad Types | Minimum Traffic | Payment Terms |
|---|---|---|---|
| Network A | Programmatic display, native, header bidding | 100k monthly pageviews | Net 30, minimum $100 payout |
| Network B | Native content ads, programmatic | 50k monthly sessions | Net 45, minimum $200 payout |
| Network C | Direct-sold, high-touch native | 150k monthly pageviews | Net 30, revenue share by contract |
| Network D | Video, display, yield mediation | 200k monthly sessions | Net 30, minimum $300 payout |
| Network E | Long-tail programmatic, emergent SSP | 25k monthly pageviews | Net 60, crypto and wire options |
Key insight: Choose a mix of established players and nimble entrants; prioritize networks whose minimums align with your top-20 pages so tests produce statistically meaningful results.
- Implement and Tag for Testing
- Run A/B or Holdout Tests
Use a staging environment and asynchronous tags to avoid regressions.
Deploy safely: Add tags to staging, then replicate on a 10% traffic slice in production. Document changes: Keep a single change log with tag versions and rollback steps. Ad placement: Start with top-performing ad sizes on priority pages and observe viewability.
Run controlled experiments with clear treatment and control groups.
Design tests: Use page-level randomization or traffic-split tools; run for a full traffic cycle (min 2–4 weeks). Track metrics: Monitor revenue, RPM, pageviews, bounce rate, and time-on-page. Statistical checks: Confirm sample size and significance before declaring a winner.
Track results during testing with columns for key KPIs per variant
| Variant | Pageviews | Revenue | RPM | Bounce Rate |
|---|---|---|---|---|
| Control (no new ads) | 120,000 | $1,800 | $15.00 | 42% |
| Network A | 58,000 | $1,160 | $20.00 | 45% |
| Network B | 60,000 | $900 | $15.00 | 44% |
| Network C | 62,000 | $1,488 | $24.00 | 47% |
| Combined (mediation) | 120,000 | $2,640 | $22.00 | 46% |
Key insight: Evaluate uplift in RPM against UX degradation; a 20–30% RPM gain with minimal bounce increase is often a net win for commercial properties.
- Analyze Results and Optimize
- Scale and Monitor Ongoing Performance
Calculate uplift and weigh trade-offs between revenue and user experience.
Compute net uplift: Use absolute RPM delta and revenue per user. Technical fixes: Implement lazy load, improve viewability, and reduce tag bloat to preserve UX. Commercial moves: Consider direct deals for inventory where networks show consistent outperformance.
Phased rollouts reduce risk and make issues visible early.
Pilot then scale: Roll out by traffic deciles—10%, 30%, 60%, then full. Dashboards: Create a daily dashboard for RPM, revenue, viewability, and bounce. Alerts: Automate alerts for >15% RPM drop or >5% bounce increase. Monthly review: Run a checklist that includes top-page performance, deal opportunities, and tag audit.
Rollout phases and monitoring actions for each phase
| Phase | Scope | Monitoring Actions | Thresholds |
|---|---|---|---|
| Pilot | Top 5 pages | Hourly revenue checks, UX sampling | RPM change ±10% |
| Partial Rollout | Top decile traffic | Daily dashboards, viewability checks | RPM change ±12% |
| Full Rollout | All pages | Weekly executive summary, deal scoping | RPM change ±15% |
| Ongoing Monitoring | Continuous | Tag audits, monthly A/B refresh | Alerts for sustained drops |
| Optimization Cycle | Quarterly | Negotiate direct deals, refresh creatives | >10% QoQ RPM growth target |
Key insight: Phased scaling with automated monitoring prevents surprises and creates predictable revenue paths.
Integrating an AI content automation pipeline like AI-powered SEO tools accelerates the identification of top pages and automates report exports, making each step above faster and less error-prone. When implemented with discipline, this testing framework turns ad network selection into a repeatable capability that feeds both revenue and audience experience improvements. Understanding and following these steps helps teams move faster without sacrificing quality.
Troubleshooting Common Issues
Start by treating ad problems like service incidents: identify the visible symptom, run quick diagnostics, apply the highest-impact fix, then validate. That triage flow reduces time-to-resolution and keeps revenue leakage small.
Common quick checks before deeper debugging: Confirm delivery: Check ad server logs and request counts for recent drops. Inspect tags: Ensure gtag, prebid adapters, or header-bidding scripts load without JS errors. * Policy flags: Review network rejection emails and console warnings for disallowed content.
Map symptoms to diagnostics and fixes for quick triage
| Symptom | Likely Cause | Immediate Check | Fix |
|---|---|---|---|
| Low fill rate | Incorrect ad unit sizes or demand mismatch | Confirm impression vs. request ratio in ad network dashboard | Update size mapping, enable fallback line-items, add secondary networks |
| High ad latency | Slow third-party creatives or heavy header-bid timeouts | Measure TTI and network waterfall timing in DevTools |
Increase timeout threshold, lazy-load ads, optimize creative size |
| Policy rejection | Page content or ad behavior violates rules | Read rejection message in publisher console | Remove offending content, add age-gates, request review |
| Declining RPM | Poor CTR or lower bids | Compare RPM by placement and traffic source | A/B test placements, increase viewability, add contextual targeting |
| Ad layout shift | Ads injecting size after render | Observe CLS and ad slot dimensions | Reserve space with CSS, use min-height, implement responsive ad slots |
Key insight: Rapid triage resolves most publisher pain points. Low fill often comes from size misconfiguration or insufficient demand; latency and layout issues are usually front-end preventable. Prioritize fixes that restore revenue quickly—size maps, timeouts, and reserved slot CSS are high-impact and low-effort.
Steps to validate a fix: 1. Clear the cache and run a full crawl or smoke test on representative pages.
- Compare pre/post metrics: fill rate, RPM, latency, and CLS over a 24–72 hour window.
- Reopen the ad network ticket with logs and screenshots if metrics don’t recover.
Practical example: switching a mobile leaderboard from 320x50 to a responsive container and adding a 300ms header-bid timeout recovered fill by 18% within a day on a mid-sized site.
If automation is in use, ensure pipelines surface these alerts into the workflow so fixes are tracked. For publishers scaling content and ad stacks, tools that automate monitoring and remediation—such as an AI content automation platform—reduce manual triage time and keep operations lean: AI content automation.
Understanding these diagnostics and validation steps keeps teams agile and prevents small issues from becoming major revenue drains. When implemented consistently, this approach minimizes downtime and preserves long-term ad performance.
Tips for Success and Pro Tips
Successful ad-driven content programs treat advertising as a performance channel that needs the same iterative optimization as organic search. Focus on diversifying demand sources, improving viewability and engagement metrics, and using your first-party data to negotiate better rates. Below are practical tactics and advanced strategies that scale with publisher growth.
Quick wins to prioritize
- Diversify demand: Connect with multiple ad networks, header-bid partners, and direct buyers to avoid single-source risk.
- Improve viewability: Move high-value placements above the fold and favor responsive ad units that resize without layout shift.
- Measure engagement, not just impressions: Track
time-on-article,scroll-depth, and active view rates to price inventory more accurately. - Use data to negotiate: Aggregate performance by placement, audience cohort, and content topic to demonstrate value to buyers.
- Automate repetitive tasks: Use machine rules for floor prices, creative blocking, and tag health checks to reduce manual work.
Step-by-step: Negotiate better terms once you have data
- Collect 90 days of performance grouped by placement and audience segments.
- Create a simple scorecard showing viewability, engagement, and effective CPM.
- Use that scorecard to request a test deal: fixed floors for 30 days with performance-based escalators.
- Evaluate the test and push for long-term terms when you demonstrate consistent uplift.
Technical and editorial pro tips
Viewability: Optimize lazy-loading thresholds and reserve critical layout space to avoid cumulative layout shift.
Header bidding: Limit parallel bidders to the top 6–8 partners to reduce latency while preserving competition.
Audience signals: Enrich page-level signals with first-party user cohorts and contextual taxonomy to maintain yield without third-party cookies.
Content clustering: Group posts into topic clusters and surface high-performing clusters to buyers as packaged inventory; this consistently commands higher CPMs.
> Market leaders recommend treating viewability and engagement as primary levers for pricing.
Practical tools include ad servers, analytics suites, and automation platforms—publishers looking to scale often adopt AI-driven workflows to automate performance reporting and deal ops. Scale your content workflow can be used to automate pipeline tasks and benchmark performance.
Understanding these principles lets teams increase ad revenue while keeping reader experience intact. When implemented correctly, these tactics reduce reliance on a single partner and make pricing predictable as the site grows.
📥 Download: Ad Revenue Optimization Checklist (PDF)
Ad Network Comparison Appendix
For quick decisions, match an ad network to the site’s traffic profile, content vertical, and engineering bandwidth. Below is a compact, actionable reference that pairs each network with typical publisher sizes, expected setup complexity, and the kinds of outcomes publishers usually see.
Common features across networks: Ad formats: Display, native, video; specifics vary by network. Revenue drivers: RPM optimization, header bidding, audience targeting. * Integration needs: Tag management, consent tooling, and CSS/JS tweaks.
Side-by-side comparison of popular ad networks for quick selection
| Network | Best For | Min Traffic | Integration Complexity |
|---|---|---|---|
| Google AdSense / AdX | Small to enterprise publishers; universal fallback | No minimum | Low for AdSense; high for AdX (programmatic setup) |
| Mediavine | Lifestyle, food, parenting blogs with engaged readership | ~50,000 sessions/month | Medium — plugin support, ad layout work |
| AdThrive | Premium lifestyle and family content with US audience | ~100,000 pageviews/month | Medium — personalized onboarding, layout optimization |
| Ezoic | Sites scaling from mid-tail traffic to enterprise | ~10,000 pageviews/month recommended | Medium — AI testing layer, requires DNS or tag change |
| Amazon Publisher Services | Programmatic header bidding for publishers seeking yield | No strict minimum | High — header bidding and SSP integrations |
| Outbrain / Taboola (Native) | Content discovery, referral traffic growth | No minimum | Low to medium — widget placement and copy testing |
| Niche Networks (affiliate/native marketplaces) | Niche verticals (finance, health, travel) that monetize via CPA | Varies widely; effective at lower traffic if niche | Low to medium — depends on partner APIs |
| Sovrn | Small-to-mid publishers seeking direct-sell + programmatic | No strict minimum | Low — publisher dashboard, header bidding options |
| Magnite / PubMatic | Large publishers and publishers needing enterprise SSP | Typically enterprise-scale | High — complex programmatic setup |
| Ad Manager partners (managed suites) | Publishers wanting outsourced yield management | Typically 50k+ pageviews | High — contractual onboarding, custom optimizations |
Key analysis: Industry analysis shows networks cluster around two decision axes: traffic scale and engineering tolerance. Networks like Mediavine and AdThrive gate by volume to preserve advertiser quality, while programmatic SSPs (Amazon, Magnite) reward engineering investment with higher yield. Smaller publishers should prioritize networks with low setup friction (AdSense, Sovrn, Ezoic), then move to specialized partners as traffic and audience signals mature.
Match the choice to your immediate priorities—maximize yield, reduce engineering overhead, or grow referral traffic—and iterate. For teams automating content and monetization workflows, integrating yield testing into the editorial pipeline accelerates learning and revenue; tools that help with that are worth prioritizing early, such as Scale your content workflow. This guidance helps teams pick the right network without overcommitting resources.
Conclusion
If ad revenue feels stuck despite steady traffic, focus on systematic testing and measurement rather than swapping partners at random. Publishers that treated placements and network mixes as experiments — A/B testing a mid-content unit, enabling header bidding, or shifting floor CPMs — typically saw clearer lifts in RPM within 6–8 weeks. Ask whether your measurement windows are long enough, whether viewability and eCPM are being tracked per placement, and whether site speed trade-offs are being measured; those questions determine whether you should tweak settings, swap creative sizes, or test a new network.
Put this into action now: run a controlled A/B test for one placement, track RPM and viewability, and compare aggregated revenue across networks over a full traffic cycle. For teams looking to automate these workflows and scale tests faster, platforms like Explore AI-powered content & monetization workflows can streamline setup, reporting, and partner optimization. Practical next steps are simple—pick the highest-traffic page, run one placement experiment for 4–8 weeks, and iterate based on revenue lift and user experience. That disciplined approach to blog advertising strategies will reliably increase ad revenue and turn guessing into a repeatable growth engine.
