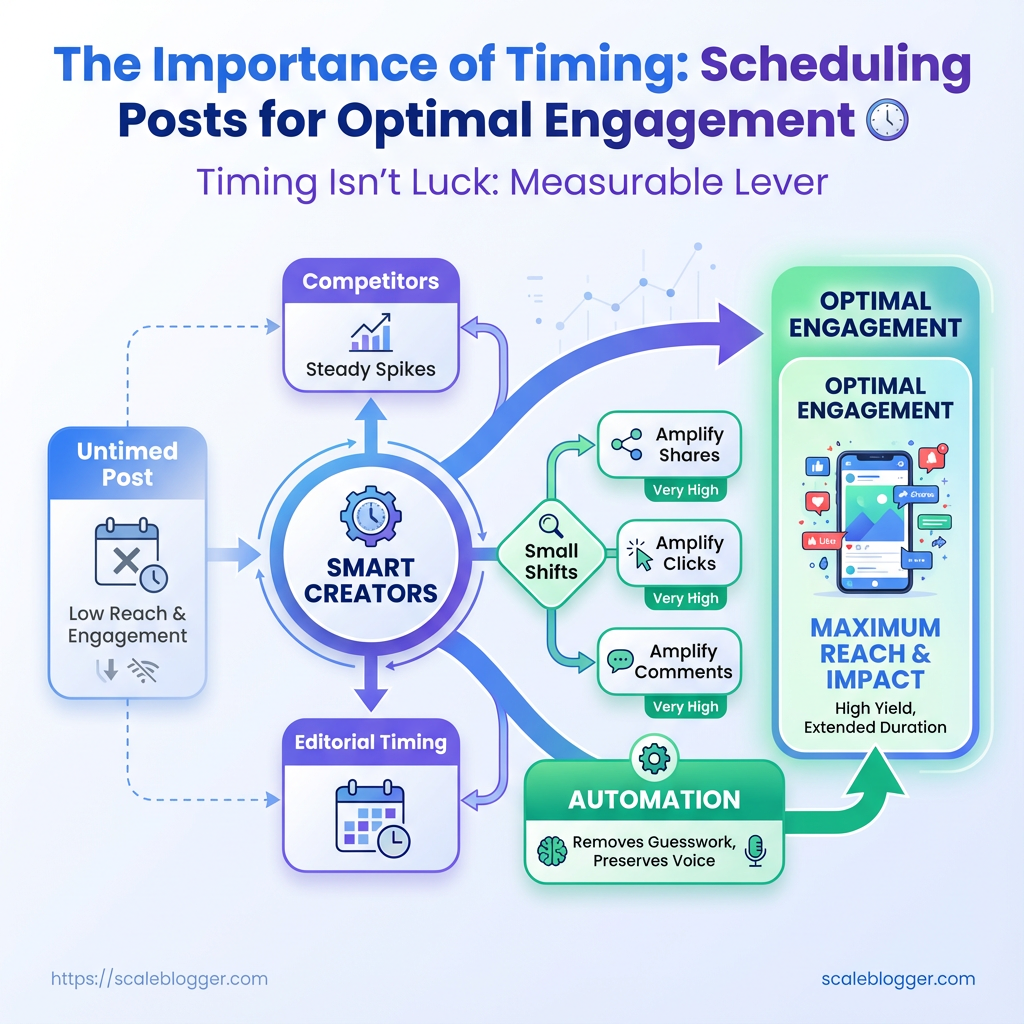
You publish when your calendar says it’s convenient, then wonder why engagement flatlines while competitors see steady spikes. That moment—an uninspired caption shared into a quiet window—costs reach, algorithm momentum, and the chance to own a conversation. Smart creators treat social media scheduling like editorial timing: every post needs a daylight where the audience is awake, scrolling, and ready to act.
Timing isn’t luck; it’s a measurable lever that multiplies effort. Small shifts toward the best posting times for your audience amplify shares, clicks, and comments, and they make paid promotion stretch farther. For teams juggling channels and time zones, automation removes guesswork and preserves voice. Try Scaleblogger’s content automation to schedule and optimize posting windows and reclaim hours while improving the odds that each post meets eyes when it matters most.
Prerequisites & What You’ll Need
Start with accounts and data in place — without connected platforms and a basic comfort level reading metrics, timing experiments become guesswork. The practical baseline: link your social accounts, surface historical post performance, pick a scheduling workflow, and make sure someone on the team can interpret engagement rate, reach, and click-through trends.
Social platform accounts: Ensure active, verified accounts for each network you’ll post to. Access level: Admin or editor permissions so scheduling tools and analytics can connect. Analytics access: Native analytics (e.g., Facebook Insights, Instagram Insights, X/Twitter Analytics) or a third-party analytics dashboard. Scheduling tool: At minimum one scheduling solution — free or paid — that supports A/B timing tests. Historical content list: A recent content calendar or exported list of past posts (30–90 days). Basic metrics literacy: Comfort reading engagement rate, impressions, reach, and clicks.
- Connect each social account to your chosen scheduling tool and confirm posting permissions.
- Export or compile a list of past posts with dates, times, and key metrics into Google Sheets or your analytics tool.
- Choose a control window (e.g., optimal time from past data) and two alternative posting times to test over the next 2–4 weeks.
Tools & materials to have ready: Google Sheets: For manual timing analysis and lightweight pivoting. A scheduling tool: To automate posting and run timing splits. Native analytics access: For reliable impressions and reach data. A content calendar file: CSV or spreadsheet with past posts and metrics. * An owner for metrics: One person assigned to validate data daily.
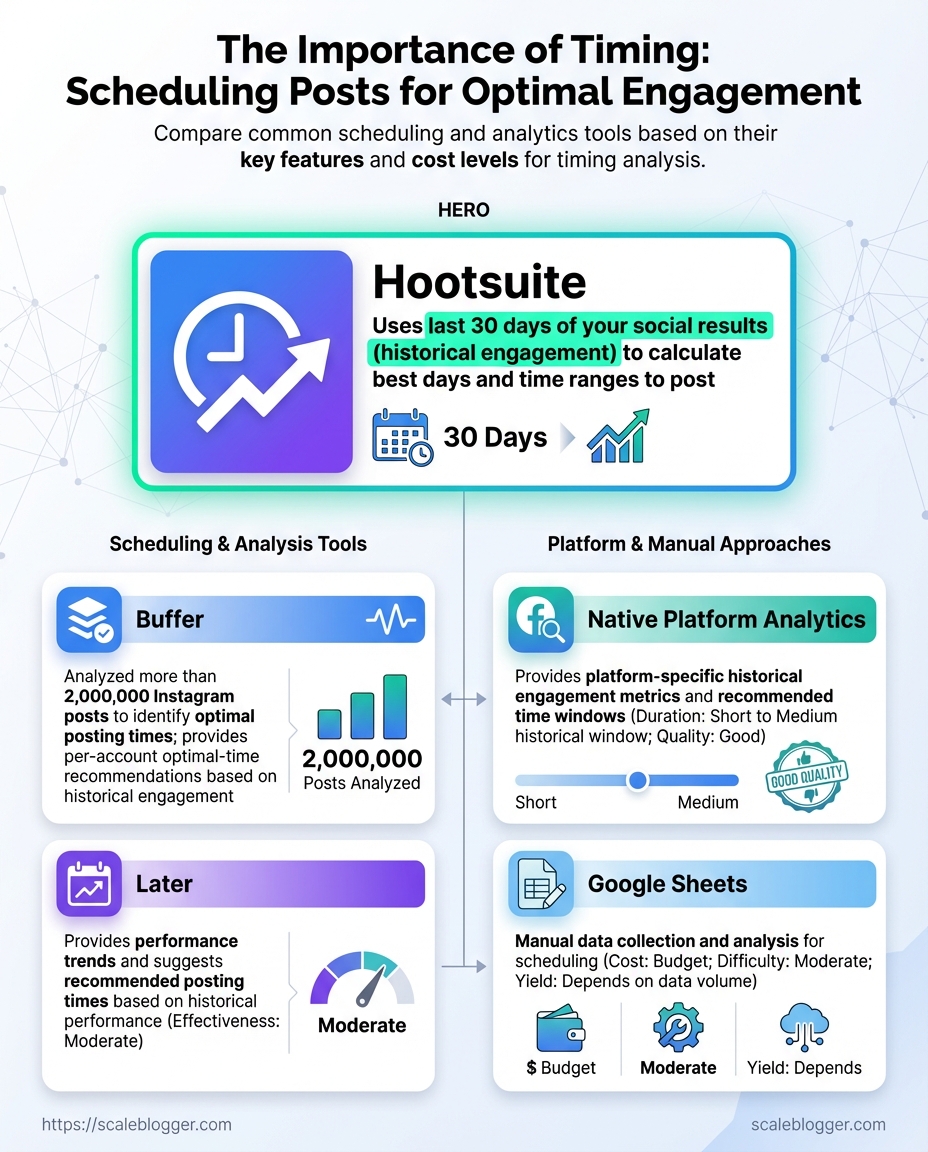
Quick comparison of common scheduling/analytics tools and their utility for timing analysis
| Tool | Type (scheduling/analytics) | Key timing features | Cost level |
|---|---|---|---|
| Buffer | Scheduling | Best time suggestions, queue management, basic analytics | Free tier; paid from $6/mo per channel |
| Hootsuite | Scheduling/Analytics | Auto-schedule, post performance reports, bulk scheduling | Plans from $99/mo; enterprise options |
| Later | Scheduling | Visual planner, best time to post suggestions, Instagram-specific analytics | Free tier; paid from $12.50/mo |
| Native Platform Analytics | Analytics | Platform-specific reach/impressions, hourly breakdowns, demographic filters | Free with platform accounts |
| Google Sheets | Manual option | Fully customizable timing analysis, pivot tables, manual imports | Free with Google account |
The table shows trade-offs: scheduling tools speed up experimentation while native analytics remain the authoritative source for impressions and reach. Use Google Sheets for flexible analysis if budget is tight, and pick a scheduling tool that surfaces best posting times to shorten the testing loop. Consider integrating an AI content workflow like Scaleblogger.com if automating timing insights and scaling tests across topics is a priority.
Having these prerequisites in place turns timing tests from hunches into repeatable experiments, and makes it straightforward to iterate toward consistently better engagement.
Step-by-step: Audit Your Past Performance (Step 1)
Start by exporting every post- and post-level metric you can get your hands on. Raw data reveals patterns that dashboards hide: which hours actually move the needle, which formats underperform relative to audience size, and where you lost momentum. This step turns intuition into measurable signals you can act on.
Prerequisites
Access: Admin-level access to analytics and social platforms.
Time estimate: 1–3 hours for a single-channel export; 4–8 hours for cross-channel consolidation.
Desired outcome: A clean dataset with one row per post and consistent timestamp, reach/impressions, and engagement fields.
Tools & materials
- Export capability: Platform CSV/JSON exports or API access.
- Workspace: Google Sheets, Excel, or a BI tool for normalization.
- Optional automation: Scaleblogger.com for automated content benchmarking and pipelines.
Step-by-Step Process
- Export full post-level datasets from each platform (CSV/JSON).
- Standardize column names so every file uses the same labels:
post_id,timestamp,impressions,engagements,followers_at_post. - Normalize timestamps to your audience time zone. Convert
UTCor platform-native zones to a single zone (for example,America/New_York) so hourly buckets line up with when your audience is awake. - Bucket posts by hour and day-of-week. Create two derived fields:
post_hour_localandpost_weekday. - Calculate engagement rates. Use both per-follower and per-impression metrics:
- Engagement per follower: engagement_rate_follower = engagements / followers_at_post
- Engagement per impression: engagement_rate_impression = engagements / impressions
- Segment by content type and CTA. Add categorical fields like
format(video/image/text),topic_cluster, andcta_type. - Run simple aggregations: average engagement_rate by
post_hour_local, bypost_weekday, and byformat.
Practical example
If a post at 14:00 local gets 200 engagements with 10,000 impressions and the account had 50,000 followers then: engagement_rate_follower = 200 / 50000 = 0.004 engagement_rate_impression = 200 / 10000 = 0.02
This shows stronger performance relative to impressions than to follower base—suggesting high relevancy or distribution efficiency.
Expected outcome: A single, queryable dataset ready for visualization and hypothesis testing.
With this cleaned and normalized dataset, determining the best posting windows and content pivots becomes a data exercise, not guesswork. Keep the dataset tidy and you’ll shave hours off future experiments.
Step-by-step: Identify Your Best Posting Windows (Step 2)
Start by turning your raw analytics into a simple hour-by-day heatmap, then rank the busiest cells by engagement and impressions. Build rules to avoid overfitting: require minimum sample sizes, apply smoothing across adjacent hours, and select a primary plus one or two backup windows per weekday. This makes publishing predictable without chasing noise.
Analytics export: CSV or native export with timestamp, impressions, clicks, and engagement metrics. Observation period: At least 4–8 weeks of data. Baseline volume: Aim for a minimum of 30 posts per day-cell across the period before trusting that cell.
Step-by-step process
- Export timestamps and engagement metrics for the last 4–8 weeks.
- Convert timestamps into two dimensions: Day of week and Hour block (use 60- or 120-minute blocks).
- Aggregate each cell to compute Avg engagement rate = engagements / impressions, and record Number of posts.
- Apply smoothing: blend each cell with the average of adjacent hours (e.g., 25% weight to previous hour, 50% to current, 25% to next) to reduce hour-to-hour noise.
- Filter out low-sample cells: drop cells with
Number of posts < 30or mark them as inconclusive. - Rank remaining cells by Avg engagement rate, then break ties with impressions.
- Choose windows:
Primary window: top-ranked cell that passes sample-size and smoothing checks.
Backup window: second-best cell within the same day or same general time-zone block.
Rotation window: optional third slot used when experimenting with formats.
Tools & materials
- Spreadsheet or BI tool: for pivoting and smoothing
- Scheduling tool: to reserve chosen slots (many teams use automated publishers or an AI content pipeline like Scaleblogger.com)
- Visualization: heatmap visual to make patterns obvious
An example hour-by-day heatmap summary with engagement rates to illustrate selection
| Day | Hour range | Avg engagement rate | Number of posts |
|---|---|---|---|
| Monday | 11:00–12:00 | 2.4% | 46 |
| Tuesday | 09:00–10:00 | 3.1% | 52 |
| Wednesday | 15:00–16:00 | 2.8% | 41 |
| Thursday | 12:00–13:00 | 3.6% | 63 |
| Friday | 10:00–11:00 | 2.1% | 38 |
Key insight: The heatmap reveals a cluster around late-morning and midday on weekdays, with Thursday midday showing the strongest combination of engagement and volume. Thursday 12:00–13:00 is a strong primary candidate; Tuesday 09:00–10:00 is a reliable backup.
Common pitfalls to avoid: overreacting to a single viral post, trusting low-sample cells, or choosing slots only by impressions (engagement rate matters more for audience response). Track performance after switching windows for another 4–8 weeks and treat this as an iterative process.
Picking consistent windows reduces scheduling friction and helps test content effects cleanly. Keep one primary and one backup per day, and revisit them with fresh data quarterly to stay aligned with audience habits.
Step-by-step: Build a Test Schedule and Hypotheses (Step 3)
Start by turning assumptions into measurable bets: a testable hypothesis, a clear control, and an experiment window that gives results without wasting time. Tests for posting time, format, or CTA should all read like mini-science experiments — specific, measurable, and repeatable.
Baseline metrics: Know current engagement rate, click-through rate, and follower growth.
Audience windows: A rough list of 3–5 candidate posting times based on analytics.
Consistent format: A template for post length, creative style, and CTA so format variance doesn’t bleed into timing results.
Design experiments
1. Write a measurable hypothesis. Example: Hypothesis: Posting at 11:00 AM on weekdays will increase link clicks by 20% versus the current 6:00 PM baseline.
2. Define control vs test. Choose your control (current best performing time) and 1–2 test windows. Keep content identical across windows except for the variable being tested.
3. Set the test length. Run each test for a minimum of 14 days or until you hit a statistically meaningful sample — whichever comes later.
4. Pick success thresholds. Define a numerical lift (e.g., +15–20% engagement) and a minimum sample size (e.g., 1000 impressions or 50 link clicks) before declaring a winner.
5. Schedule and randomize. Use a scheduler to post at exact times and rotate days to avoid weekday biases.
- Consistent content formats: Use the same image, caption length, and CTA across test conditions to isolate timing effects.
- Small-batch approach: Test one variable at a time to avoid confounded results.
- Failure-case plan: Predefine what happens if tests are inconclusive — extend duration, increase sample size, or change the effect size you’re powered to detect.
Practical example
Test: 11:00 AM vs 6:00 PM, weekdays only. Control: 6:00 PM posts for two weeks prior. Duration: 14 days per condition. Success: +20% link clicks with ≥50 clicks per condition.
Use tools to automate posting and collect results; services that provide automated scheduling and performance benchmarking can speed iteration. Scaleblogger.com is one option that integrates scheduling with content scoring for faster hypothesis cycles.
Follow this structure and tests stop feeling like guesswork — they become a repeatable engine for better posting decisions and measurable gains in reach and conversions.
Step-by-step: Implement Scheduling & Automation (Step 4)
Start by treating scheduling as an operational system, not a one-off task. Set the campaign timezone, enforce a naming convention for every draft, enable auto-post with preview checks, and bake tracking into every URL. Those small disciplines remove guesswork, make A/B analysis straightforward, and keep analytics trustworthy.
Scheduling platform: Choose a scheduler that supports timezone configuration, draft previews, and UTM templating. Analytics: GA4 or equivalent set up with campaign tracking. Content calendar: A master calendar with target windows and campaign IDs.
Tools & materials
- Platform: Examples include Buffer, Hootsuite, Sprout Social, Later, and native CMS schedulers.
- Tracking: Google Analytics, or your preferred analytics tool.
- Shortener/UTM helper:
bit.lyor internal URL-builder script.
Step-by-step process
- Configure the campaign and set the target timezone in the scheduler.
- Define a consistent naming convention for posts and tests.
- Create test posts using the naming convention and enable preview checks before enabling auto-post.
- Set up UTM parameters for each campaign, template them in the scheduler, and validate in a test publish.
- Enable auto-post with a publishing buffer and monitor the first 48 hours of performance.
Naming convention example
Campaign ID: Q4-blog-launch Post slug: q4-blog-launch_topic_variantA_2025-11-04
UTM example
UTM template: ?utm_source=twitter&utm_medium=social&utm_campaign=q4-blog-launch&utm_content=variantA Use inline code for dynamic values like {{campaign}} or {{variant}} if your tool supports templating.
- Publishing buffer: Set a 5–10 minute buffer to let preview checks complete.
- Preview checks: Always confirm headlines, image crops, and link validity in the preview pane.
- Auto-post: Use it for scale, but restrict it to posts that passed preview and UTM validation.
Automation rules and tag conventions across different scheduling workflows
| Workflow Element | Recommended Setting | Why it matters | Example |
|---|---|---|---|
| Naming convention | campaign_topic_variant_YYYYMMDD |
Keeps assets searchable and sortable | q4-blog_launch_variantA_20251104 |
| Tagging for A/B analysis | Add a variant tag + audience tag |
Enables segment-level performance queries | variant:A audience:highengage |
| Publishing buffer | 5–10 minutes | Catches last-second errors from previews | Buffer allows image/link refresh |
| Timezone handling | Set campaign timezone per market | Prevents off-hour posting and skewed analytics | America/Los_Angeles for west-coast audience |
| UTM tagging | Template UTMs with dynamic tokens | Ensures consistent campaign tracking | ?utm_campaign={{campaign}}&utm_content={{variant}} |
Key insight: Standardizing naming, tagging, timezone, buffers, and UTMs makes automation reliable and analytics actionable. Consistent conventions reduce manual cleanup and speed up learning loops.
Mentioning automation platforms naturally: Scaleblogger.com offers pipeline automation and UTM templating that fit neatly into the workflow above.
Get these pieces right once and the day-to-day work becomes predictable: posts publish on time, reports line up, and A/B tests actually tell you something useful.
Step-by-step: Measure Results & Iterate (Step 5)
Start by treating test results like raw material: aggregate them, translate them into comparable signals, then turn the clearest winners into repeatable publishing plays. This phase separates guesswork from a reproducible growth engine — measure relative lift with sensible confidence checks, promote winning windows into the calendar, and design the next round of experiments that narrow the gap between good and great.
What to collect and how to normalize
- Collect: Pageviews, unique visitors, engagement rate, conversion events, session duration, and channel attribution.
- Normalize: Compare equivalent time windows (same weekdays, same hour buckets) and use rolling averages to smooth daily noise.
- Segment: Break results by audience cohort, traffic source, and device to spot hidden wins or loses.
Step-by-step process
- Aggregate metrics into comparable periods (same weekdays and hours).
- Compute relative lift for each variant:
(Variant - Control) / Control. - Estimate confidence by checking sample size and variance; ensure meaningful sample thresholds before declaring winners.
- Promote winning windows to a recurring schedule (move winning posts into the content calendar).
- Plan the next round: define hypothesis, KPI, required sample size, and variant changes.
Each numbered step stands alone and guides the work in order.
Practical examples and quick heuristics
- Example — cadence test: A newsletter sent at 9am vs 2pm shows a 12% lift in opens for 9am over a matched 4-week window. Promote 9am slots for that segment and run a follow-up test swapping subject-line tone.
- Example — headline variants: Two headlines produce similar clicks but different time-on-page; keep the headline with higher engagement for long-form content and test meta descriptions to improve CTR.
Common pitfalls to avoid
- Small-sample decisions: Waiting until sample size is sufficient prevents false positives.
- Mixing windows: Comparing a weekend launch to a weekday control hides channel effects.
- Ignoring retention: A high initial lift that drops off after promotion is not a true win.
Use tools that automate aggregation and significance checks — many content platforms and analytics suites provide this; for an integrated approach to scaling tests and automating promotions, consider exploring Scaleblogger.com as one option. Iteration is where content experiments become predictable growth — keep testing, keep promoting, and let the data shape the calendar.
Step-by-step: Scaling and Maintaining Optimal Times (Step 6)
Start by locking in what works, then build simple automation and governance so the schedule scales without constant firefighting. Operationalizing means converting successful test slots into repeatable calendar entries, assigning clear ownership, and wiring monitoring so deviations are caught fast. Maintain a lightweight SOP that new campaigns can follow, and automate alerts to reduce manual checks.
Verified posting windows: Last 4–8 weeks of analytics showing uplift for chosen times.
Analytics access: Read access to your social/analytics dashboards and export capability.
Automation tool: Scheduling platform with API or webhook support (or use an integrated service like Scale your content workflow where appropriate).
Step-by-step process
- Create a canonical calendar entry for each proven timeslot and tag by audience and content type.
- Assign a single owner for each calendar stream (e.g., mornings for audience A) and document their responsibilities.
- Configure automated monitoring: set
CTR,engagement rate, anddeliverythresholds in the dashboard. - Set alert rules to notify owners via Slack/email when a timeslot falls below threshold or when publish jobs fail.
- Run a weekly review where the owner validates anomalies and either re-queues tests or confirms stability.
- Quarterly, run a controlled re-test across 3–5 alternate times to detect shifting audience behavior.
Operational definitions
Owner: Person responsible for day-to-day adherence and first responder for alerts.
Review cadence: Frequency and format for evaluating performance (e.g., weekly 15-minute standup + monthly deep-dive).
SOP: Step-by-step document that covers scheduling, escalation, re-testing, and documentation.
Automation considerations:
- Use APIs: Automate schedule updates and status checks with
POST/GETcalls where possible. - Alert granularity: Start with broader thresholds, then tighten as noise reduces.
- Backup process: Keep a manual fall-back for publishing if automation fails.
An example monitoring and review cadence for maintaining posting times
| Frequency | Action | Owner | Success metric |
|---|---|---|---|
| Daily | Verify scheduled posts executed; check immediate delivery errors | Channel owner | 99% successful publishes |
| Weekly | Review engagement trends for each timeslot; flag anomalies | Social lead | ≥5% week-over-week stability |
| Monthly | Deep-dive on top/bottom performing slots; decide retests | Growth manager | Retest plan approved or slots locked |
| Quarterly | Run controlled A/B tests on 3 alternate slots | Analytics team | Statistically valid lift (p<0.05) or no change |
| Annually | Re-evaluate timezone strategy and audience segmentation | Head of Content | Updated calendar and SOP versioned |
Key insight: Maintaining posting schedule cadence relies on fast daily checks to catch failures, weekly trend reviews to spot drift, and structured quarterly tests to adapt to audience shifts. The mix of owner accountability and automated alerts minimizes manual work while keeping timing optimal.
Closing thought: Treat the schedule as a living asset—small, frequent checks plus a short SOP keep posting times effective without turning operations into a full-time job.
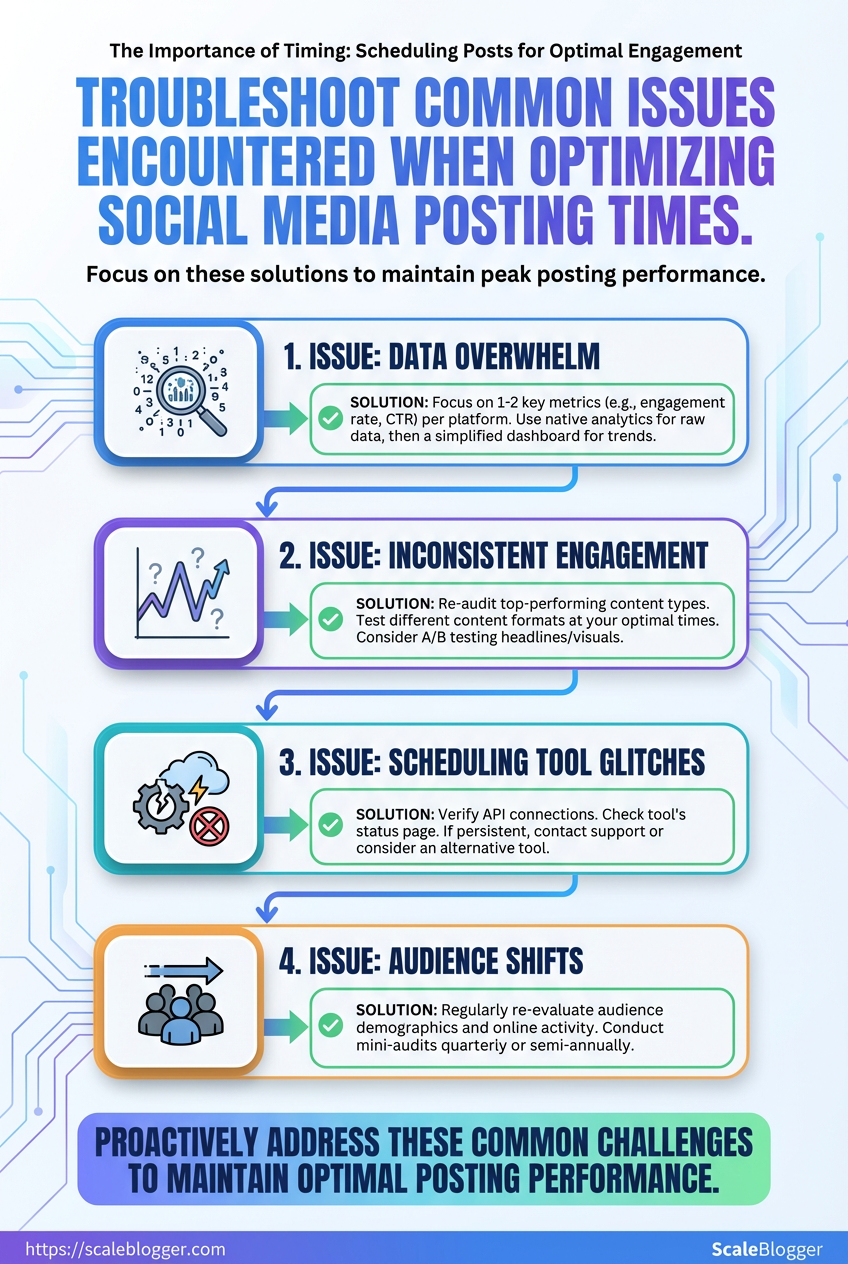
Troubleshooting Common Issues
When performance looks noisy or schedules break, the fix usually starts with precise detection rather than guesswork. Common problems—small sample sizes, timezone/DST mismatches, platform API outages, and sudden algorithm shifts—each have distinct symptoms and reliable fixes. Walk through these checks before making big changes to strategy.
How to detect and fix sample-size problems
- Run a quick sanity check: compare the metric baseline against a rolling window of at least 14–28 days.
- Look for volatility: if daily engagement swings exceed ±30% of the rolling mean, treat results as underpowered.
- If you used A/B splits, confirm each variant has at least 100–300 independent impressions (more for conversion events).
Underpowered sample: When counts are low, results will flip unpredictably. Fix: Increase the test window, aggregate similar posts, or pool comparable audiences. Avoid re-running tests mid-flight; extend instead.
Resolving timezone and DST issues
Timezone mismatch: Scheduling systems that mix UTC and local time produce posts at unintended hours. Fix: Normalize all timestamps to UTC in your pipeline, then convert to the target audience’s local time only for display. Audit scheduled posts monthly around DST changes.
DST drift: Automated schedules may shift by one hour after DST transitions. Fix: Use timezone-aware libraries (for example, systems that respect tz databases) when generating Cron expressions. If your scheduler lacks timezone support, rebuild the schedule around UTC offsets.
Handling platform API or scheduling outages
- Immediate triage: Pause scheduled retries and check platform status pages.
- Fallback posting: If API rate limits trigger failures, queue posts locally and retry with exponential backoff.
- Post-mortem: Log request IDs, timestamps, and error codes for accountability.
Adapting when algorithm changes shift engagement
- Monitor lift/decline patterns: Track impressions, CTR, and dwell time together—engagement can fall even if impressions rise.
- Adjust content signals: If reach drops, prioritize content formats currently favored (short video, carousels, long-form) based on platform trends.
- Re-test cadence and creative: Run small controlled experiments to find the new sweet spot.
Practical tooling and automation note
AI content automation: When schedules and tests become many, automate monitoring and retries with tools like Scaleblogger.com to keep pipelines consistent and surface anomalies faster.
Catching these four failure modes early keeps experiments honest and saves time that would otherwise go into chasing phantom problems. Troubleshooting with disciplined checks prevents knee-jerk strategy changes and keeps momentum on what actually moves metrics.
📥 Download: Social Media Posting Timing Checklist (PDF)
Tips for Success & Pro Tips
Start by thinking like an experimenter: run many small, measurable tests while keeping a few long-game plays that compound over weeks. Micro-tests reveal quick wins; macro-strategies build sustainable traffic. Combine both deliberately rather than treating them as alternatives.
Micro-tests vs. macro-tests Micro-tests: Fast A/B checks on headlines, creatives, or UTM tagging; low effort, quick signal. Macro-tests: Multi-week changes to content pillars, site architecture, or publishing cadence; higher effort, bigger payoff.
Segmented schedules for international audiences Local-first windows: Post during local business hours in the highest-priority market. Overlap windows: Target regions whose peak times overlap with a secondary market to squeeze more engagement from one post. * Staggered cadence: Rotate the same asset across time zones with small local tweaks (language, cultural hook).
Batching content to match the best windows 1. Plan editorial clusters for the week, aligned to topic pillars. 2. Produce assets in concentrated sessions (scripts, visuals, captions). 3. Schedule publishes to coincide with peak local engagement, then rerun with edits for secondary markets.
When to rely on platform signals vs audience signals Platform signals: Use for short-term optimization (what the algorithm favors today); follow trending formats and native features. Audience signals: Use for durable decisions (what your followers repeatedly engage with); prioritize direct feedback like comments and repeat shares.
Practical pro tips Micro-test often: Run headline or thumbnail swaps daily for one week to gather quick direction. Segment time zones: Set posting buckets (AM local, midday hub, PM international). Batch production: Record 4–6 videos or draft 8–12 posts in one session to reduce context-switching. Trust audience data: If your core audience repeatedly prefers long-form explainers, tune the algorithmic experiments around that preference rather than chasing every new format. * Automate wisely: Use automation to handle scheduling and performance benchmarks, but keep human review for tone and cultural nuance. Tools like Scaleblogger.com fit naturally when building an AI-powered content pipeline that enforces these rules.
Quick-win tactics vs long-term strategies and expected effort/impact
| Tactic | Effort required | Expected impact | When to use |
|---|---|---|---|
| Micro-testing | Low (hours) | Quick lift in CTR/engagement | Headline/creative experiments |
| Segmented scheduling | Medium (planning) | Higher regional engagement | International audiences |
| Batch publishing | Medium (production) | Consistent quality & cadence | Resource-constrained teams |
| Reactive posting (newsjacking) | Low–Medium (fast turnaround) | Short spikes in visibility | Timely events & trends |
| Paid amplification | Variable (budgeted) | Scalable reach & conversion | Validate winners & widen reach |
The comparison shows clear trade-offs: micro-tests buy speed, batching buys efficiency, and paid amplification buys scale. Mix them: validate with micro-tests, produce in batches, and amplify the clear winners.
Small, repeatable experiments plus a consistent batching rhythm create both momentum and insight. Keep testing, but reserve resources for the longer plays that actually move growth metrics.
Appendix: Templates, Checklists, and Example SOPs
This appendix supplies ready-to-use templates and crisp checklists to stop decision friction and speed execution. Each item is presented so it can be copied into a doc or template system, then adapted to your workflow. Templates cover a functional test plan, an export & data-cleaning checklist, practical scheduling naming conventions for social posts, and a one-page SOP snapshot you can paste into a team wiki. Use these as starting points: they reduce rework, make handoffs predictable, and let automation tools take over repetitive steps.
Copyable test plan template
- Test Plan ID: TP-
YYYYMMDD-Project - Objective: Describe expected behavior in one sentence.
- Scope: List included features and excluded items.
- Preconditions: Environment, user accounts, data setup.
- Test cases:
- Test case ID: TC-001
- Title: Short descriptive title
- Preconditions: Data or state required
- Steps:
- Step 1: Do X
- Step 2: Do Y
- Expected result: Clear pass/fail criterion
- Test data:
[email protected], dataset name - Run schedule: Who, when, environment
- Results summary: Pass/Fail counts, blockers, notes
- Owner: Name and contact
Export and data cleaning checklist
- Export settings: Ensure include headers, UTF-8 encoding, and consistent delimiter.
- Schema validation: Confirm columns match expected names and types.
- Deduplication: Remove exact duplicates by unique key.
- Null handling: Replace or flag
NULL/empty values per field policy. - Date normalization: Convert to
YYYY-MM-DDand timezone-align timestamps. - Value mapping: Standardize categorical values (e.g.,
NY→New York). - Sample verification: Spot-check 10–20 rows against source.
- Backup: Archive original export with timestamped filename.
Scheduling naming convention examples
Blog post: YYYYMMDDtopic-slugstage Example: 20251201_ai-content-automation_final Social post: platformYYYYMMDDcampaign_variant Example: x_20251202_blackfriday_v1 * Asset: typetopicsize Example: image_ai-content_1200x628
These conventions make searching, filtering, and automations reliable when pushing to scheduling tools or syncing with analytics.
SOP one-page snapshot
Purpose: One-line intent.
Owner: Name / role.
Frequency: Daily / Weekly / On-demand.
Tools: List tools (editor, CMS, analytics).
Steps: 1. Pull latest content from source.
- Run export & cleaning checklist.
- Apply naming convention and tag content.
- Schedule into publishing queue and confirm publish window.
- Log results and anomalies to tracking doc.
Escalation: Who to contact for failures.
Automating parts of this process with an AI content pipeline reduces manual checks and speeds throughput—tools like Scaleblogger.com map neatly onto several steps above, from automation to performance benchmarking. These templates are practical: copy them into your team docs, tighten the language for your stack, and watch coordination overhead fall.
Conclusion
By auditing past posts, isolating when your audience is actually active, and running short, measurable tests you can turn guesswork into a repeatable rhythm that boosts reach and consistency. Focus on three things: prioritize data over habit, test a few windows deliberately, and automate the routine once a winner emerges. Earlier examples showed how shifting to targeted morning and early-evening slots produced clear engagement lifts for teams that stopped posting by convenience; likewise, the troubleshooting section helps when time zones or platform changes muddy results. If your audience is global, stagger tests by region and compare relative lifts; if results are noisy, extend each test one additional week before changing variables.
Next steps: run the audit template from the appendix, pick two candidate posting windows, and commit to a three-week test with clear hypotheses. For teams looking to automate scheduling and free up creative bandwidth, platforms like Try Scaleblogger's content automation to schedule and optimize posting windows can speed setup and help maintain the cadence you prove works. For more tactical reads, see undefined. Start small, measure what moves, and let the data dictate the calendar—that steady feedback loop is where predictable engagement comes from.
