

Learn how to build a reliable editorial rhythm with analytics, track key metrics, and convert insights into actionable weekly content.
A data-driven content calendar begins with clear goals. It includes measurable metrics and repeatable processes. Use audience and performance data to prioritize topics. Set publishing schedules and assign resources based on this data to make evidence-based decisions.
This approach reduces wasted effort, increases engagement, and helps teams scale predictable growth.
Why this matters: content teams that schedule by signal rather than guesswork save time and boost ROI. Industry research shows content planned around behavior and performance consistently outperforms ad-hoc publishing. Experts recommend aligning KPIs, search data, and engagement metrics to create a single source of truth.
Example: a B2B blog that shifted to weekly topics prioritized by organic CTR and lead quality saw steadier month-over-month traffic and more qualified inquiries.
I’ve helped content leaders design calendars that balance evergreen depth and timely experiments. In this guide you’ll get actionable frameworks, measurement templates, and automation tips to make scheduling repeatable.
Launch your data-driven calendar with Scaleblogger — planning, automation, and analytics in one workflow: https://scaleblogger.com
Next, we’ll map the operational steps and tools to build your first 90-day calendar.
Table of Contents
- Foundations of a Data-Driven Content Calendar
- Section Content
- Setting Up a Data-Driven Scheduling Framework
- Analytics for content planning: collecting, interpreting, acting
- Audience alignment and global relevance
- Operationalizing the calendar with automation
- Measurement, iteration, and continuous improvement
- Conclusion
> Key Takeaway:
Foundations of a Data-Driven Content Calendar
A data-driven content calendar serves as your planning system. It uses measurable signals to guide editorial choices, such as…
Foundations of a Data-Driven Content Calendar
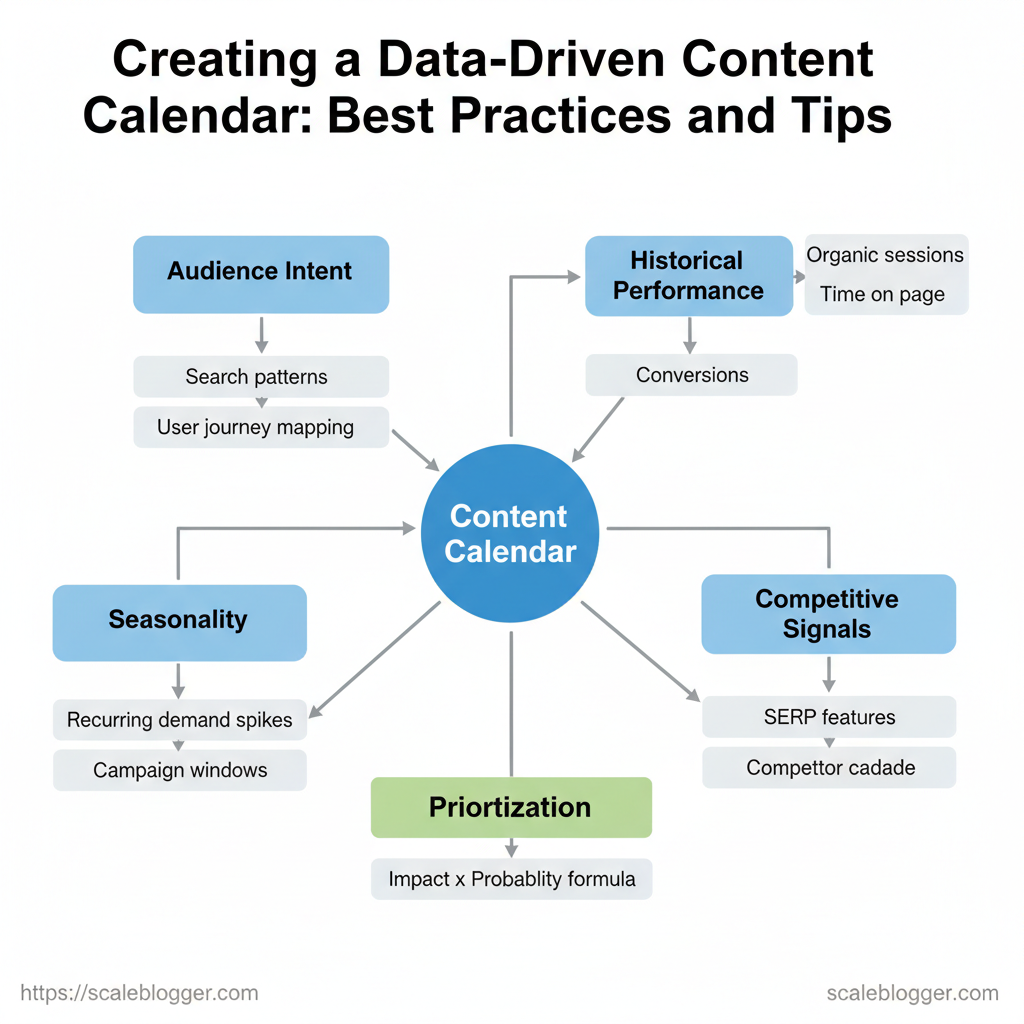
A data-driven content calendar serves as your planning system. It uses measurable signals to guide editorial choices, such as audience intent, past performance, and seasonality, instead of relying on intuition or fixed schedules. Begin by replacing topic lists based on gut feelings with measurable inputs. These include search intent clusters, historical engagement and conversion metrics, seasonality signals, and a formula to rank topics by their expected value.
This approach aligns day-to-day publishing with measurable outcomes, so teams spend time creating content that moves KPIs instead of filling a calendar.
How to think about the core inputs
- Audience intent: Use search patterns, query modifiers, and user journey mapping to group topics by intent (informational, transactional, navigational). Historical performance: Pull metrics like organic sessions, time on page, and conversions to estimate baseline potential. Seasonality: Track recurring demand spikes and campaign windows; map promotional calendars to content windows.
- Competitive signals: Monitor SERP feature presence and competitor cadence to spot whitespace. Prioritization: Apply a simple formula —
Impact x Probability— to rank ideas by expected return (impact = estimated traffic/conversion uplift; probability = likelihood of ranking/supporting performance).
A practical prioritization flow
- Collect ideas from keyword research, audience questions, and competitor gaps. 2.
Score each idea using Impact (1–10) and Probability (1–10). 3. Calculate priority as Priority = Impact × Probability.
- Allocate effort: top decile → flagship long-form; mid decile → cluster posts; low decile → repurposed content.
Starter template structure
markdown - Title / Working headline
- Intent: (Informational / Transactional / Navigational)
- Target keywords / Search phrases
- Historical benchmark (avg sessions / conversions)
- Priority score: Impact x Probability = #
- Publish window / Seasonality note
- Distribution channels / CTA
- Owner / Production ETA
Traditional vs. data-driven calendar elements to highlight benefits and gaps
| Element | Traditional Approach | Data-Driven Approach | Impact / Notes |
|---|---|---|---|
| Topic selection | Editorial ideas from brainstorming | Keyword-intent clusters + competitor gaps | Higher relevance; reduces wasted content |
| Post cadence | Fixed weekly/monthly schedule | Flexible cadence based on opportunity | Improves ROI per publish slot |
| Keyword alignment | Broad keywords, few modifiers | Intent-aligned long-tail + semantic keywords | Better SERP feature capture |
| Seasonality handling | Ad-hoc holiday posts | Mapped demand curves + publishing windows | Higher traffic during peaks |
| Cross-channel consistency | Separate social/SEO plans | Unified theme with repurposing cadence | Stronger amplification, less duplication |
If you want a ready-built pipeline that automates scoring, scheduling, and publishing while tying each title back to performance benchmarks, tools like AI-powered content automation from Scaleblogger.com can plug into your workflow and help predict performance so teams focus on execution rather than triage. Understanding these principles helps teams move faster without sacrificing quality.
> Key Takeaway:
Setting Up a Data-Driven Scheduling Framework
A reliable scheduling framework starts with the right inputs and clear ownership. It also requires a repeatable schedule to avoid…
Setting Up a Data-Driven Scheduling Framework
A reliable scheduling framework starts with the right inputs and clear ownership. It also requires a repeatable schedule to avoid making decisions randomly. Begin by mapping the specific data signals you’ll use (traffic, engagement, seasonality, competitor moves, and backlog), assign accountable owners using a simple RACI-style approach, and set update frequencies that balance freshness with operational overhead. This ensures the content calendar becomes an active decision system rather than a static spreadsheet.
Inputs and why they matter
- Traffic signals: Use pageviews, organic sessions, and referral trends to prioritize topics that already attract visitors. Engagement metrics: Track time on page, scroll depth, and social shares to decide whether to refresh or expand content. Seasonality cues: Calendar events and historical spikes guide timing for promos and evergreen updates.
- Competitor insights: Monitor competitor publishing cadence and gaps to identify opportunity windows. Content backlog status: Understand capacity and resource constraints so the schedule is realistic.
Ownership and accountability
- Define roles: Assign a Content Owner (accountable), Data Analyst (responsible for pulling signals), Editor (consulted), and Marketing Lead (informed). 2.
Use RACI shorthand: R=Data Analyst, A=Content Owner, C=Editor/SEO, I=Marketing Lead. 3. Escalation path: Content Owner resolves conflicts; unresolved issues go to head of content weekly.
Cadence for updates
- Daily: Monitor critical traffic dips and social virality alerts. Weekly: Update short-term calendar (next 2–4 weeks) and review engagement anomalies. Monthly: Re-prioritize backlog, add seasonal slots, run KPI health check.
- Quarterly: Strategic planning, major pillar audits, and capacity forecasting.
Basic starter KPIs
- Traffic growth: % organic sessions month-over-month. Engagement lift: Avg. time on page and scroll depth changes.
- Publish velocity: Number of publishable assets per sprint. ROI proxy: Estimated traffic x conversion rate for prioritized pieces.
Provide a clear mapping of inputs to owners, update frequency, and sources
Table: Section Content — Input Type, Source, Owner & more
| Input Type | Source | Owner | Update Frequency | Notes |
|---|---|---|---|---|
| Traffic signals | Web analytics (GA4), Search Console | Data Analyst | Daily (alerts), Weekly review | Organic sessions, CTR, landing pages |
| Engagement metrics | CMS analytics, Hotjar, Social Insights | Editor / Analyst | Weekly | Time on page, scroll depth, social shares |
| Seasonality cues | Historical traffic, Marketing calendar | Content Owner | Monthly | Holiday windows, sales, industry events |
| Competitor insights | Competitive intelligence tools, SERP tracking | SEO Lead | Weekly | New topics, backlink moves, publish cadence |
| Content backlog status | Project management (Asana/Trello), Editorial calendar | Content Owner | Weekly | Status, blockers, priority tags |
For most teams, implementing this takes an initial two-week setup and single dashboard for weekly syncs; tools and automation speed adoption (consider using an AI content automation partner to reduce manual pulls). When everyone knows which signal moves the needle and who decides, planning becomes faster and less political. Understanding these principles helps teams move faster without sacrificing quality.
> Key Takeaway:
Analytics for content planning: collecting, interpreting, acting
Begin with metrics that directly impact decisions. Measure what drives the content calendar.
Analytics for content planning: collecting, interpreting, acting
Begin with metrics that directly impact decisions. Measure what drives the content calendar. For blog-led growth this usually means a mix of engagement signals (how content performs with readers), traffic signals (how discoverable content is), and retention signals (whether visitors return or convert). Collect consistently, segment by audience and intent, and convert simple thresholds into calendar actions: update, repurpose, promote, or retire.
That makes analytics operational instead of academic.
How to collect and organize data
- Set up core sources: connect
GA4for page metrics, your CMS for publishing dates, and search console for impressions/CTR. - Define event taxonomy: track
scroll_50,cta_click,signup_from_post— keep names consistent. - Segment at ingestion: tag by topic cluster, funnel stage, and intent (informational, transactional, navigational).
Segmentation strategies that reveal action
- Prioritize topics: rank by traffic potential and conversion history. 2.
Audience slices: new vs returning, referral vs organic, mobile vs desktop. 3. Intent-driven buckets: update how-to posts monthly, promote product-intent posts weekly.
Decision-rule examples (practical)
- If engagement rate > 3% and keyword rank in top 10 → Action: schedule a promotion push and add internal links.
- If average time on page < 60s for long-form pieces → Action: run content audit and A/B test headings.
- If CTR < 2% but impressions high → Action: rewrite meta title/description and requeue for social.
> According to industry data, there is a consistent uplift when teams convert analytics thresholds into calendar rules rather than one-off reports.
Practical templates and code examples
yaml rule: metric: avg_time_on_page threshold: 90 comparator: "<" action: "audit_and_rewrite"Key metrics and decision rules
Contrast metric thresholds and corresponding calendar actions
| Metric | Benchmark | Thresholds | Calendar Action |
|---|---|---|---|
| Engagement rate | 1–5% (page-level) | <1% (low) / 1–3% (normal) / >3% (high) | Low: content audit; Normal: monitor; High: promote & update |
| Average time on page | 90s–180s | <60s / 60–150s / >150s | <60s: rewrite intro/format; 60–150s: CTAs; >150s: repurpose long-form |
| CTR (organic) | 2–5% | <2% / 2–4% / >4% | <2%: rewrite meta; 2–4%: test titles; >4%: scale with paid ads |
| Return visits | 10–25% | <10% / 10–20% / >20% | <10%: add retention flows; 10–20%: nurture sequence; >20%: feature in newsletter |
| Keyword rank | Top 10 target | >50 / 11–50 / 1–10 | >50: reoptimize; 11–50: content expansion; 1–10: internal links & promotion |
Actionable next steps
- Start small: pick 3 rules to automate reporting.
- Instrument accurately: confirm event names and UTM consistency.
- Iterate weekly: review rule outcomes and adjust thresholds.
If you want a ready-to-run framework that automates these decision rules into your editorial calendar, consider integrating an AI-powered content pipeline like the one at Scaleblogger.com to automate scoring, scheduling, and promotion so teams spend less time deciding and more time creating. When analytics drive the calendar, teams act faster and experiments compound into predictable growth.
Audience alignment and global relevance
Audience alignment starts by mapping topics to the actual signals people show when they search, click, or engage. This mapping should extend across markets to maintain global relevance. Start by classifying intent into informational, commercial, transactional, and navigational, then attach measurable signals (search queries, CTR patterns, on-page time, conversion events) to each topic. For global relevance, layer in region-specific language, seasonal timing, and platform preferences so content lands where and when audiences expect it.
This process converts broad topic ideas into prioritized workstreams that feed an editorial calendar and a continuous analytics-to-action loop.
, time-on-page for informational). Validate with signals: use search query modifiers, engagement metrics, and competitor SERP features to confirm intent. Regionalize at scale: adjust examples, currency, imagery, and local terms for each market variant.
- Close the loop: move from analytics insight to calendar update within a sprint.
What follows are workflows, examples, and a compact table you can drop into planning docs.
Topic-intent mapping workflow
- Audit topic candidates: gather top queries, internal search logs, and social mentions.
- Tag by intent: mark
informational,commercial,transactional, ornavigational. - Assign signal validators: choose 2–3 metrics per topic (search volume, CTR, conversion rate).
- Regionalize copy: localize headlines and CTAs; test microcopy in-market.
- Calendarize and iterate: schedule content, measure performance, then update slots every 4–8 weeks.
Iteration loop from analytics to calendar updates
- Measure: capture core KPIs weekly.
- Diagnose: surface failing intent matches (e.g., high bounce on commercial pages).
- Adjust: rewrite or retarget content, swap intent tag if needed.
- Reschedule: reassign to calendar with A/B test notes.
Topic-to-intent mapping with validation across markets
| Topic | Intent Signal | Region Considerations | Calendar Status |
|---|---|---|---|
| How to use data APIs | informational (search volume, long-tail queries) |
English docs vs localized SDK examples | Planned Q2, technical deep-dive |
| Best practices for localization | informational → commercial (tool comparisons) |
Local idioms, translators, legal terms | Drafted, review for EU/APAC |
| Seasonal topic windows | transactional (seasonal spikes, paid search CTR) |
Holiday timelines differ by region | Live for NA holiday; APAC next quarter |
| Evergreen vs trending balance | informational (time-on-page) |
Evergreen core, trending overlays per market | Ongoing, evergreen backlog |
If you want to scale this into an automated pipeline, integrating an AI content automation partner can reduce manual tagging and speed iterations—Scaleblogger.com can help you build topic clusters, automate scheduling, and tie performance benchmarks back into the editorial calendar. When done right, this alignment lets teams move faster without losing relevance across markets.
Operationalizing the calendar with automation
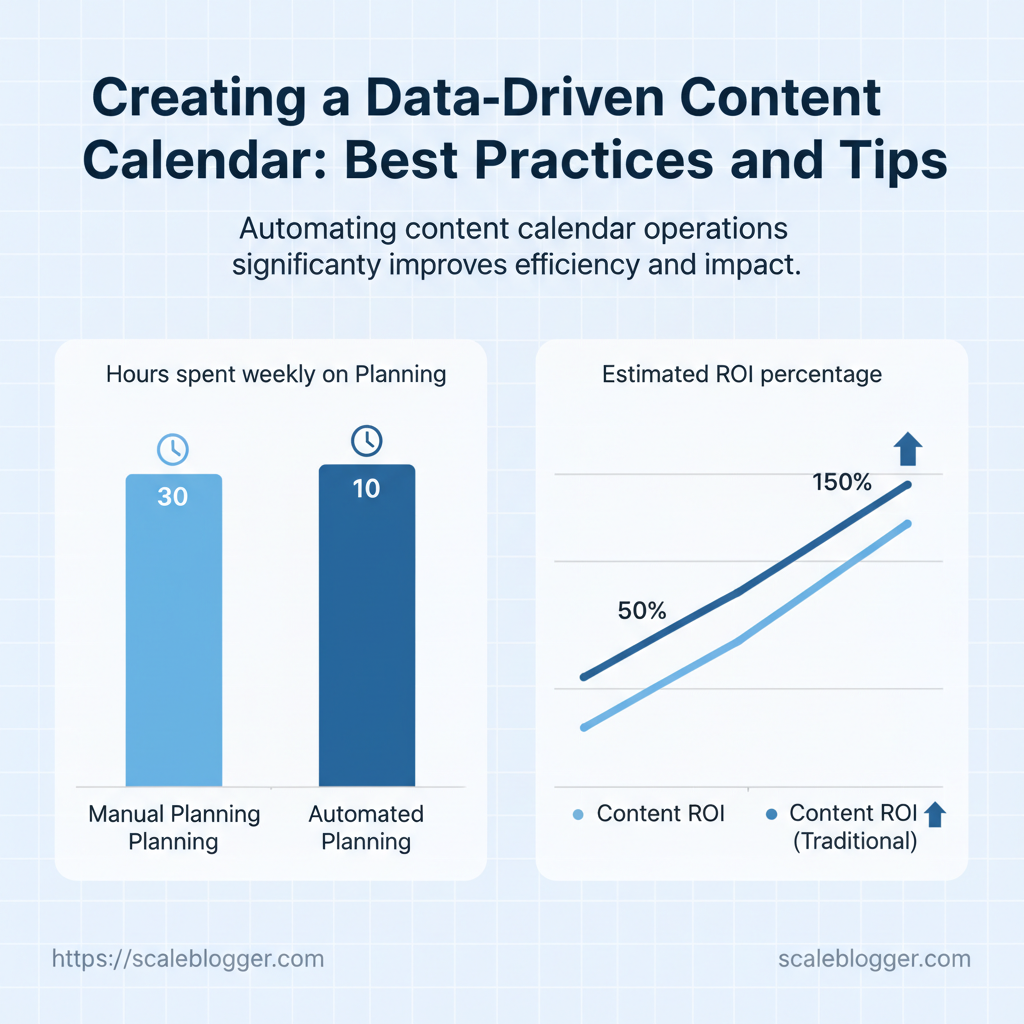
Automating your content calendar means creating repeatable rules for scheduling decisions. It also involves setting up a reliable publishing system and monitoring to catch problems before they escalate. Start by mapping the phases—data ingestion, rule-based scheduling, queueing for publishing, and observability—then attach owners and measurable success criteria so the automation actually runs and improves over time. This approach reduces manual routing and keeps strategic decisions at the team level while routine tasks are handled by systems.
Automation blueprint and governance
- Phase mapping: Define five automation phases from ingest to scale and assign a product/ops owner for each.
- Rule-based scheduling logic: Use explicit if/then rules—
if topic_score > 80 and freshness <= 60 days → schedule priority—so decisions are auditable. - Publishing pipeline overview: Pipeline stages include content validation, SEO checks, media processing, CMS ingestion, and distribution webhooks.
- Monitoring and alerts: Implement synthetic checks and real-time alerts for failures (publish stalls, 404s, metadata gaps).
- Plan the rules first: codify scheduling logic as readable rules (
yamlorjson) so non-engineers can review. - Automate safe defaults: set a conservative
retrypolicy and an approval gate for high-impact posts. - Add observability hooks: track
time_to_publish,publish_failures, andfirst_hour_traffic.
> Research from recent industry analysis indicates that teams that define clear ownership and SLAs for automation experience fewer publish failures and faster content velocity.
Example webhook payload for enqueueing a post:
json { "post_id": "12345", "priority": "high", "seo_score": 86, "publish_window": "2025-11-20T09:00:00Z" }Practical governance tips
- Owner clarity: Assign one owner per phase to avoid handoff delays.
- Versioned rules: Store scheduling rules in repo so changes are auditable.
- Rollback plan: Define a rollback (unpublish API) for urgent fixes.
- Performance SLAs: Set targets like <5% publish failures and <30 min mean time to recover.
Phased automation timeline with key milestones
| Phase | Key Activities | Owners | Timeline (weeks) | Success Criteria |
|---|---|---|---|---|
| Phase 1: Data ingestion | Aggregate content briefs, traffic signals | Content Ops | 2 | Ingest 95% of briefs |
| Phase 2: Scheduling rules | Author rules, priority buckets | Content Strategist | 3 | 90% rule coverage |
| Phase 3: Publishing queue | Validate assets, CMS API push | Engineering Ops | 4 | <2% publish failures |
| Phase 4: Monitoring & optimization | Instrument metrics, alerts | SRE / Analytics | 3 | Alerts <1/min false positive |
| Phase 5: Review & scale | Audit, add automation, scale infra | Product Lead | 4 | 20% faster time-to-publish |
If you want a turnkey starting point, tools that combine rule engines and publishing connectors save weeks of work; for teams focused on scaling content, platforms like Scaleblogger.com can help you implement AI content automation and Scale your content workflow without rebuilding pipelines from scratch. Understanding these principles helps teams move faster without sacrificing quality.
📥 Download: Data-Driven Content Calendar Checklist (PDF)
Measurement, iteration, and continuous improvement
Continuous improvement starts with a predictable rhythm: measure what matters, test deliberately, and document decisions so the team learns faster. Start with a quarterly review cadence for strategic evaluation and run shorter, focused experiments every 4–8 weeks to validate tactical changes. That rhythm keeps long-term goals aligned while letting teams iterate on headlines, formats, and distribution without paralysis.
Review rituals and post-mortems
- Quarterly strategic reviews: evaluate pillar performance, content ROI, and audience shifts for roadmap updates.
- Sprint retrospectives (4–8 weeks): review experiments, surface friction, and decide next hypothesis.
- Post-mortem template: document goal, what happened, measurable impact, root causes, corrective actions, and owners.
markdown
Post-mortem: [Title]
- Goal: (what we expected)
- Timeline: (dates)
- Outcome: (metrics vs target)
- What went well: (2-4 bullets)
- What failed: (2-4 bullets)
- Root cause analysis: (one-paragraph)
- Actions: (owner + due date + acceptance criteria)
- Learnings: (what to apply next time)
Experiment design basics
- A 2023 study found that: defining a single measurable hypothesis with one change can increase organic clicks by 12% with optimized meta descriptions.
- Set guardrails: sample size, duration (
4–8 weeks), and statistical threshold for success. - Control and variant: use A/B where feasible, or time-based windows for rolling channels.
- Track implementation fidelity: ensure the variant is actually deployed (screenshots, timestamps).
- Decide before you test: predefine success/failure actions to avoid bias.
Documentation and knowledge sharing
- Centralized experiment log: one row per test with
hypothesis → result → link to assets. - Content playbook updates: convert successful experiments into templates or
how-tosnippets. - Monthly learning newsletter: short summaries of wins and failed hypotheses for cross-team visibility.
Checklist of review criteria and corresponding calendar actions
| Criterion | Measurement | Decision Trigger | Calendar Action |
|---|---|---|---|
| Content diversity | % new formats per quarter | <20% new formats → diversify | Add format pilots to next quarter roadmap |
| Topic saturation | Share of traffic from top 10 topics | >60% → reduce concentration | Schedule 6 new topic cluster briefs |
| Format performance | Avg engagement by format (CTR, time) | Format CTR < site avg by 15% | Retire or rework format next sprint |
| Cross-channel alignment | Repurposing ratio (posts→social/video) | <30% repurposed → inefficient | Plan repurpose cycles in monthly ops |
| Localization effectiveness | Local traffic lift vs baseline | <10% lift after localization | Reassess translation + local promotion |
For teams that want to scale this process, consider integrating an AI-driven pipeline like the ones that automate scheduling, scoring, and benchmarking—tools that help you predict which experiments deserve ramp-up and which need to stop. Understanding these principles helps teams move faster without sacrificing quality.
Conclusion
We’ve walked through how to turn analytics into a dependable editorial rhythm, which metrics actually move the needle, and how to bake repeatable workflows into your publishing process so your calendar stays productive instead of chaotic. A few concrete points to carry forward:
- Prioritize engagement and conversion metrics over vanity numbers to shape topics that retain attention. - Automate upstream tasks like topic scoring and scheduling to keep cadence consistent.
- Run short experiments and iterate weekly so your calendar evolves with audience signals.
You saw how data-informed planning helped teams shift from ad-hoc publishing to predictable growth, and how simple automations rescued hours every week. If you’re wondering how long before this pays off, start with a four-week sprint: set one hypothesis, track two core metrics, and automate the publishing steps you repeat most. If you’re asking what to build first, create a scoring rule for topic selection and an automated draft-to-publish workflow.
When you’re ready to put this into practice, explore Scaleblogger’s workflow templates for hands-on structure and then take the logical next step: Launch your data-driven calendar with Scaleblogger. That will get you end-to-end automation of content creation and publishing, so you can move from planning to measurable results faster.
