

Marketing teams invest in multi-modal content—like video, long-form articles, short social posts, and interactive experiences. However, they find it hard to show return on investment (ROI) for these formats. Performance is often assessed based on superficial metrics. It should instead focus on interactions that lead to conversions and longer-term value.
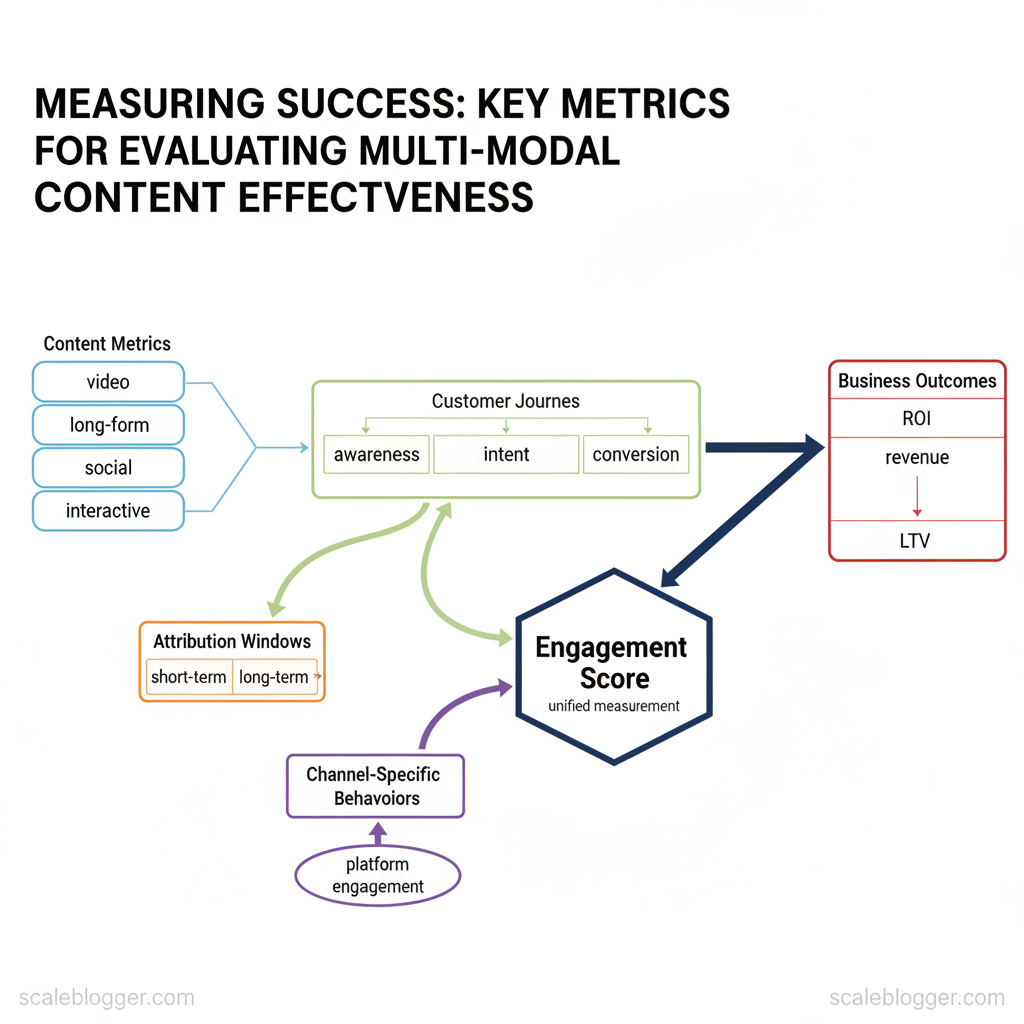
To measure success, you must align content metrics with customer journeys, the times that connect actions to purchases, and specific behaviors for each channel.
Industry research shows that using integrated measurement reveals different insights compared to isolated or siloed reporting. Look beyond simple views and clicks to engagement depth, assisted conversions, and cross-channel lift. When teams adopt a consistent engagement score and map it to business outcomes, optimization moves from guesswork to growth.
> Linking creative variations to revenue turns content from a cost center into a reliable growth engine.
Picture a product launch where short-form ads drive awareness, long-form guides build intent, and webinars close high-value accounts. Tracking the right content performance analysis across those touchpoints surfaces which formats to scale and which to retire. This approach reduces wasted spend and sharpens creative strategy.
- How to choose measurable KPIs for each content format
- Ways to align attribution windows with buying cycles
- Methods to combine qualitative signals with quantitative metrics
- Practical steps to build a unified dashboard for cross-channel analysis
Explore Scaleblogger’s AI workflows for content measurement automation: https://scaleblogger.com
> Key Takeaway: ## What You Need to Get Started
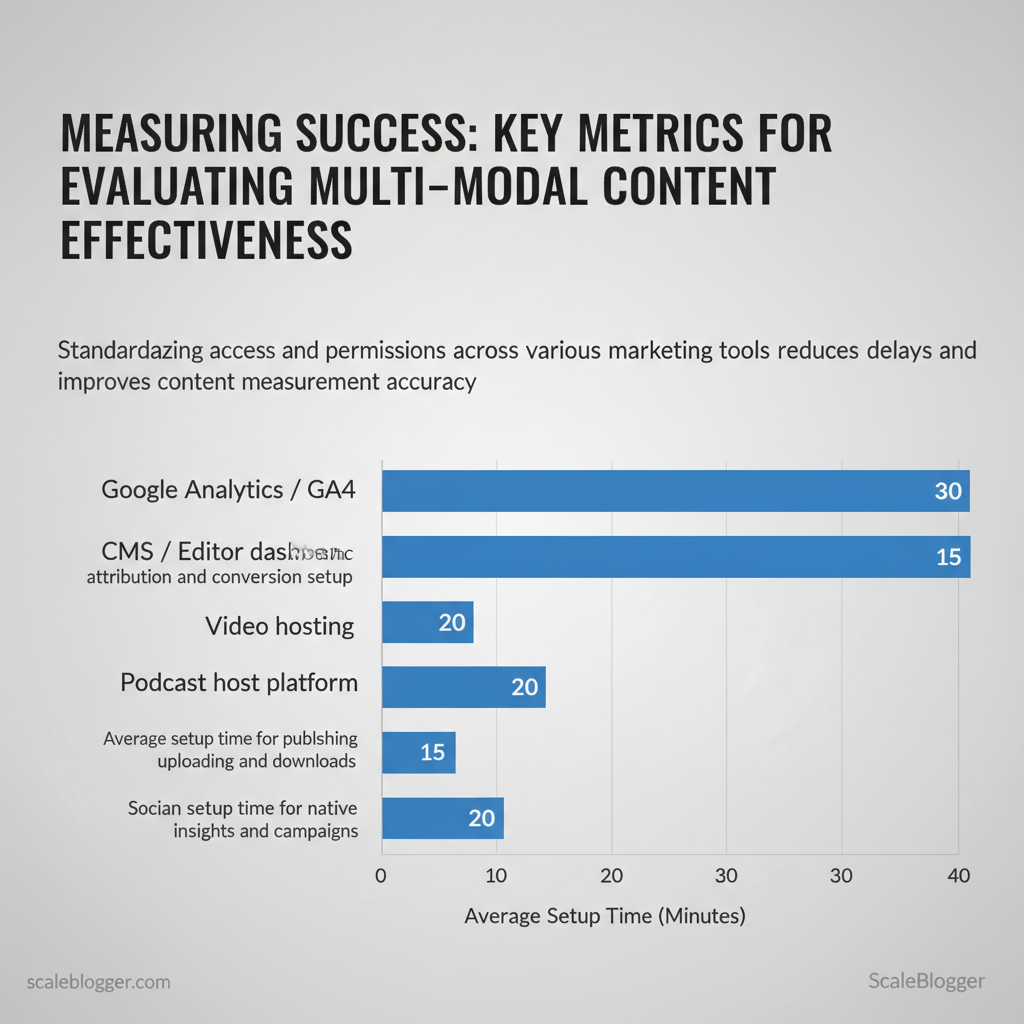
Begin with access and clean baseline data. Without the right permissions and the last 3 months of What You Need to Get Started
Begin with access and clean baseline data. Without the right permissions and the last 3 months of comparable metrics, automated content workflows and performance testing will come to a halt. Prepare tool access, basic analytics skills, and a minimal dataset so automation and editorial decisions operate on reliable inputs. Core skills and knowledge required: > Industry analysis shows teams that standardize permissions and tagging reduce reporting time and attribution errors. Practical checklist (what to gather before you start): Side-by-side checklist mapping tools to required permissions and why they’re needed
utm_source, utm_medium, utm_campaign pattern). Conversion funnel understanding — map content to funnel stage (TOFU/MOFU/BOFU) and expected KPIs.
?utm_source={source}&utm_medium={medium}&utm_campaign={campaign}&utm_term={term}
> Key Takeaway: ## Step-by-Step Measurement Framework (Overview)
Start by defining a clear framework that connects your measurement goals with how often you execute them. This framework breaks the measurement program into discrete phases—discovery,…
Step-by-Step Measurement Framework (Overview)
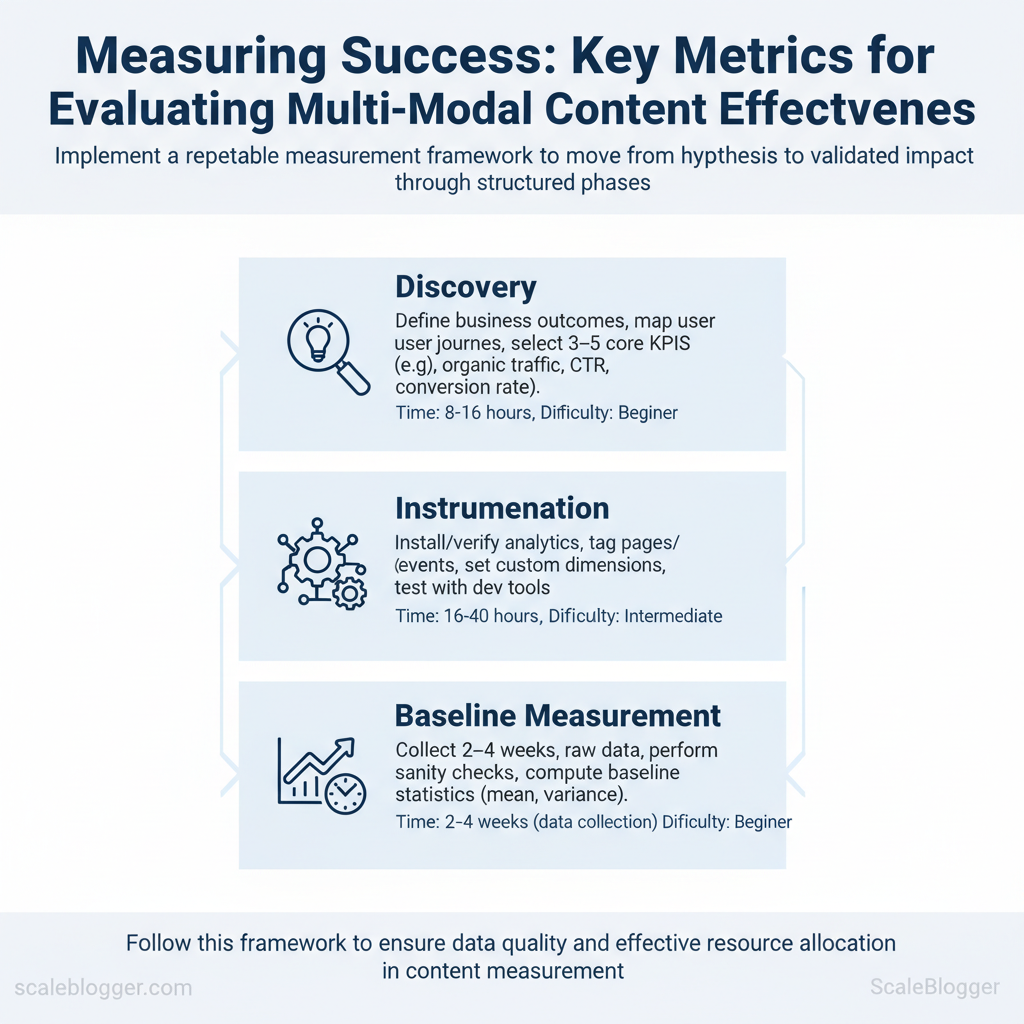
Start by defining a clear framework that connects your measurement goals with how often you execute them. This framework breaks the measurement program into discrete phases—discovery, instrumentation, baseline measurement, testing, scaling, and governance—so teams move from hypothesis to validated impact without losing sight of data quality. Each phase has a clear objective, an estimated timebox, and a suggested difficulty level so planners can assign resources and anticipate blockers.
- Discovery — Purpose: align goals and KPIs
- Primary activities: define business outcomes, map user journeys, select 3–5 core KPIs (e.g., organic traffic,
CTR, conversion rate) - Time estimate: 8–16 hours (1–2 days)
- Difficulty: Beginner
- Instrumentation — Purpose: ensure data fidelity
- Primary activities: install/verify analytics, tag pages/events, set custom dimensions, test with dev tools
- Time estimate: 16–40 hours (2–5 days)
- Difficulty: Intermediate
- Baseline Measurement — Purpose: capture current performance for comparison
- Primary activities: collect 2–4 weeks of raw data, perform sanity checks, compute baseline statistics (mean, variance)
- Time estimate: 2–4 weeks (data collection window)
- Difficulty: Beginner
- Testing & Experimentation — Purpose: run controlled changes and measure lift
- Primary activities: design A/B or content experiments, power calculations, run test, collect results
- Time estimate: 2–8 weeks per experiment (depends on traffic)
- Difficulty: Advanced
- Scaling — Purpose: operationalize winning approaches
- Primary activities: build templates, automate rollout, update content pipeline, monitor for regression
- Time estimate: 1–3 weeks for initial rollout; ongoing refinement
- Difficulty: Intermediate
- Governance & Reporting — Purpose: maintain integrity and transparency
- Primary activities: document metrics, set alerting, schedule reviews, train stakeholders
- Time estimate: 8–16 hours monthly maintenance
- Difficulty: Beginner
Practical example: a mid-traffic blog can complete Discovery + Instrumentation in a week, collect a 3-week baseline, run a 4–6 week content experiment, then spend two weeks scaling winners — about 8–10 weeks end-to-end for a single cycle. Industry teams often parallelize phases (instrumentation while baselining smaller segments) to shorten timelines, but avoid skipping full baseline collection. Tools that automate tagging and content scoring—such as AI content automation platforms—can reduce instrumentation time and make scaling predictable.
Understanding these phase-level estimates helps prioritize work and set realistic stakeholder expectations.
> Key Takeaway: ## Step 1: Define Success — Objectives & KPIs for Each Modality
First, identify the business outcome you want from your content. Then select specific goals and measurable KPIs that directly relate to that outcome.
Step 1: Define Success — Objectives & KPIs for Each Modality
First, identify the business outcome you want from your content. Then select specific goals and measurable KPIs that directly relate to that outcome. This prevents vague briefs like “increase engagement” and replaces them with precise targets such as According to Industry data, increase qualified trial signups by 20% from blog-driven traffic within 6 months. Use formulas for clarity (conversion rate = conversions / sessions) and set pragmatic benchmarks using historical account data or market norms when no baseline exists.
- Establish the business objective (revenue, leads, awareness, retention).
- Choose content modality that best serves that objective (written, video, landing pages, audio).
- Assign a primary KPI that ties to business value and a secondary KPI that tracks supporting behavior.
- Define formulas and an initial benchmark; revise after 90 days using observed data.
Common formulas to include in briefs
- Conversion rate = conversions / sessions
- Playthrough rate (video) = completed plays / starts
- Clickthrough rate (CTR) = clicks / impressions
- Average session duration = total time on page / sessions
Benchmarks: when account history is absent, use conservative market baselines — e.g., blog Recent research indicates conversion rates ~0.5–2%, landing page conversion rates ~5–15%, podcast completion rates ~40–70% depending on length. Adjust targets by channel sophistication and audience intent.
Modality-specific KPIs side-by-side for quick selection
| Business Objective | Content Modality | Primary KPI | Secondary KPI |
|---|---|---|---|
| Awareness | Written (SEO blog) | Organic sessions per month | Average time on page (s) |
| Awareness | Video (short-form) | Views per 30 days | Playthrough rate (%) |
| Acquisition | Landing Page / Interactive | Landing page conversion rate (%) | Cost per acquisition (CPA) |
| Engagement | Podcast / Audio | Episode downloads per month | Completion rate (%) |
| Retention | All Modalities | Returning users rate (%) | Churn reduction vs cohort (%) |
Practical tip: add one trailing KPI (e.g., assisted conversions) to capture multi-touch influence. For teams adopting automation, integrate content scoring from tools like Scaleblogger.com to predict performance and prioritize high-impact briefs. When targets are realistic and instrumented, teams move faster and make fewer subjective decisions.
Step 2: Instrumentation — Implement Tracking Across Modalities
Begin by treating tracking like product-level instrumentation. This includes using consistent identifiers, machine-readable events, and automated verification. Instrumentation ties distribution channels, engagement events, and backend IDs together so analytics teams and content owners can trust the numbers and act quickly.
- Standardize UTM naming and application (15–30 minutes per campaign)
- Create a single UTM dictionary. Use short, predictable keys:
utm_source,utm_medium,utm_campaign,utm_term,utm_content. Store canonical values in a shared spreadsheet orconfigfile. - Naming conventions: Use lowercase, hyphenated values and avoid stopwords. Example:
utm_source=twitter,utm_medium=paid-social,utm_campaign=spring-sale-2025. - Apply by channel: Use
utm_medium=emailfor newsletters,utm_medium=referralfor partner links, andutm_contentto differentiate creatives. Automate tag generation with templates in the CMS or link shortener.
Define event taxonomy and parameters (30–60 minutes to design, ongoing enforcement)
- Taxonomy root: Start with verbs:
viewed_article,cta_clicked,form_submitted,video_started. - Parameter set: For each event include
content_id,content_type,author_id,campaign, andengagement_value. - Version events: Add a
schema_versionparameter so downstream ETL knows how to parse older events.
Example event names and parameters:
javascript // GA4 event example gtag('event', 'cta_clicked', { content_id: 'article-2025-04-01', content_type: 'blog_post', campaign: 'spring-sale-2025', schema_version: 'v1' });Link cross-platform IDs (20–40 minutes to map, maintenance ongoing)
- Persist a
content_idacross CMS, analytics, and CRM. - Map user identifiers: Use
cross_platform_user_idto join anonymous sessions to logged-in profiles where privacy allows. - Store mappings in a lightweight lookup service or within the content platform.
Verify events in real time and schedule audits
- log` traces during rollout to confirm events fire with correct parameters. 2.
Automated audits: Run weekly tests that sample 1% of events and validate schema, UTM presence, and content_id continuity. 3. Error alerts: Trigger alerts when required fields are missing or event volume deviates by >30% from baseline.
Practical tip: integrate this instrumentation with content workflows—embed UTM templates in editorial briefs and enforce event hooks in publishing pipelines. For teams scaling content operations, consider platforms that automate tagging and audits; tools like Scaleblogger.com can help automate pipeline steps and enforce taxonomy consistently. Understanding these practices lets teams move faster without sacrificing data quality.
Step 3: Data Collection & Centralization
Collect and normalize every content, traffic, and engagement signal from each platform into a single canonical store so analysis and automation operate from the same truth. Start by cataloging data sources, choose pull methods that match access patterns, and apply consistent normalization rules (timezones, user IDs, content IDs) before ingesting. This reduces duplicate work, prevents attribution errors, and enables automated workflows to act on standardized records.
Prerequisites
- Access credentials: API keys, CSV exports, SFTP credentials for each source.
- Data schema: agreed field list (e.g.,
content_id,published_at,author_id,page_views,search_queries). - Storage choice: cloud data warehouse, data lake, or a managed analytics DB.
, Airbyte, Fivetran). Storage: BigQuery/Redshift/Snowflake, or a centralized PostgreSQL. com for content pipelines.
- Validation utilities: scripts in Python/SQL and simple dashboards for reconciliation.
Step-by-step process
- Identify sources and export methods: API endpoints, CSV exports, webhooks, or scheduled database dumps. 2.
Implement extraction: schedule daily pulls for high-volume sources and weekly aggregations for low-volume feeds. 3. Normalize fields: convert all published_at timestamps to UTC, map author_email → author_id, and ensure content_id is globally unique.
- Load into canonical store: use bulk
upsertto avoid duplicates and maintain history. 5.
Validate and reconcile: run row-count checks, sample record comparisons, and compare totals with platform dashboards.
Example API pull (Python)
python import requests, json res = requests.get("https://api.example.com/posts", headers={"Authorization":"Bearer TOKEN"}) posts = res.json() Map fields
normalized = [{"content_id": p["id"], "published_at": p["date"], "title": p["title"]} for p in posts] Bulk insert/upsert into DB
Normalization rules (common)
- Timezone standardization: Store everything in
UTCand render in local time only at presentation layer. - Identifier mapping: Create a single
author_idnamespace to join analytics and CMS records. - Canonical content ID: Generate a stable
content_idusing CMS ID + source slug.
Validation steps and sanity checks
- Row counts: verify expected rows per source vs. previous run. Checksum or hash: detect silent changes to content bodies.
- Dashboard reconciliation: compare aggregated metrics against platform dashboards within a 5% variance tolerance.
Troubleshooting tips
- If API rate limits block extraction, implement incremental syncs using
modified_aftercursors. - If duplicates appear, inspect
upsertkeys and ensure idempotent loads. - If timezones mismatch, backfill corrected
UTCvalues and mark affected records with acorrectedflag.
Expected outcomes
- Centralized, normalized dataset enabling automated content scoring, reliable attribution, and consistent feeds into publishing and reporting systems. When implemented well, teams spend less time fixing data and more time optimizing content.
Step 4: Analysis — Interpreting Metrics and Attribution
Start by merging various metrics into one clear view so you can make decisions based on solid data. Normalization and a defensible attribution choice let teams prioritize content investments and channels that truly move conversions.
Prerequisites
- Data access: GA4, CRM conversion logs, ad-platform reports
- Identifiers: UTM taxonomy, campaign IDs, content IDs
- Baseline KPIs: target CPA, LTV, engagement thresholds
Tools and materials
- Analytics platform: GA4, Adobe, or a BI tool
- Attribution engine: native analytics models or
data-drivensolutions - Spreadsheet/SQL: for normalization and score calculations
- Normalize metrics into comparable scores
- Calculate z-scores or min-max normalize for
sessions,engagement,leads,revenue. - Create a weighted composite score:
Composite = 0.4RevenueNorm + 0.3LeadsNorm + 0.2EngagementNorm + 0.1ReachNorm. - Validate by sampling top/bottom content and confirming business alignment.
- Why normalize: different scales (time on page vs. revenue) distort comparisons.
- What success looks like: top 10% of content by composite score consistently outperforming baseline CPA.
- Choose an attribution model aligned to goals
- Performance marketing goal: favor
last-touchfor short-funnel buys. - Brand or discovery goal: favor
first-touchortime-decayto credit early awareness. - Complex, multi-step journeys: adopt
linear multi-touchordata-driven.
- Visualize for action
- Funnel visualization: conversion rates at each stage, segmented by channel.
- Cohort retention charts: returns and LTV by acquisition month.
- Time-to-convert histogram: identifies long-tail paths requiring nurture.
Practical example
- Run normalized composite scores across 120 blog posts. 2.
Use time-decay for content-first campaigns, last-touch for promotional email bursts. 3. Reallocate ad budget from channels with high reach but low composite scores.
Attribution models and when to use each for multi-modal campaigns
| Attribution Model | Best Use Case | Pros | Cons |
|---|---|---|---|
| Last-touch | Short-funnel conversions | Simple, quick insights | Over-credits final touch |
| First-touch | Awareness/brand lift | Highlights discovery channels | Ignores later conversion drivers |
| Linear multi-touch | Balanced credit across journey | Fair distribution across touchpoints | Can dilute impact signals |
| Time-decay | Long sales cycles with nurture | Credits recent influences more | Requires time-window tuning |
| Data-driven | Complex journeys with ample data | Most accurate when trained |
choose the model that maps to your objective—awareness, consideration, or conversion—and validate by testing shifts in composite scores and business metrics after reassigning credit.
When analysis and attribution are coherent, teams make faster, more confident tradeoffs between content creation, paid amplification, and nurturing. Understanding these mechanics reduces guesswork and lets creators focus on high-impact work.
Step 5: Reporting & Dashboards — Communicate Insights
Begin by treating reporting as a delivery mechanism for decisions: dashboards should reduce ambiguity and point teams to the next action. Design two complementary views — an Executive dashboard for direction-setting and a Tactical dashboard for execution — then standardize templates and alert thresholds so every stakeholder knows what to do when a metric moves.
Executive vs Tactical components
- Executive — high level: traffic trend, conversions, topical cluster performance, ROI by channel, and a 90-day forecast.
- Tactical — operational: page-level clicks, impressions, publish cadence, keyword ranks, content scoring, and backlog velocity.
- Common crosswalks: link metrics to business outcomes (e.g., leads per topic cluster) so both views speak the same language.
Suggested visualizations and cadence
- Monthly executive report: line charts for total traffic and conversions, stacked area for channel mix, single-number KPIs for MQLs and revenue impact. 2.
Weekly tactical dashboard: heatmap for page engagement, bar chart for new vs updated posts, table for pages below CTR threshold. 3. Daily alerts feed: anomaly detection on sudden traffic drops, crawl errors, or publish failures.
Dashboard specs — fields to include
- Title: clear and time-bound. Owner: responsible person. Update cadence:
daily/weekly/monthly.
- Primary metric: the one metric that changes decisions. Secondary metrics: 3–5 contextual metrics. Data sources: GA4, Search Console, CMS, CRM.
- Action links: direct links to content, task in project tool, and source queries.
Report template
markdown Report: Monthly Content Exec — Mar 2025 Owner: Content Lead Primary metric: Organic MQLs (MTD vs LY) Secondary metrics: Sessions, Avg. CTR, Top 5 topic clusters Highlights: 1-2 bullet insights Risks: pages with >30% traffic drop Actions: 1) Prioritize 5 pages for refresh 2) Pause low-performing experimentsAlerting thresholds and example action items
- Alert: CTR < 1% for prioritized pages → Action: run headline A/B within 48 hours.
- Alert: Sessions down 20% week-over-week on a core cluster → Action: audit backlinks and check indexing within 24 hours.
- Alert: Publish failure → Action: rollback draft and notify editor immediately.
Operationalize with automation: tie alerts to tickets and use scheduled exports for exec summaries. For orchestration and AI-driven pipelines, consider platforms that Scale your content workflow (https://scaleblogger.com) or Predict your content performance (https://scaleblogger.com) to reduce manual overhead. Understanding these reporting principles helps teams move faster while keeping decisions aligned with business goals.
Step 6: Iteration — Testing, Learning, and Optimization
Prerequisites: a baseline KPI set (traffic, CTR, conversion), tracking in place (GA4, server logs, or analytics API), and a content backlog ready for experiments. Tools/materials needed: access to publishing CMS, A/B testing framework or simple experiment tracker, a sample-size calculator (or statsmodels/GPower), and a shared results spreadsheet or dashboard. Time estimate: plan biweekly sprints for rapid tests, monthly reviews for statistical significance, quarterly strategy adjustments.
Start by prioritizing experiments using a simple scoring model so teams run the highest-impact tests first. Use either ICE (Impact, Confidence, Ease) or PIE (Potential, Importance, Ease) to rank ideas quickly. Score each idea 1–10 and sort; this prevents chasing low-value optimization.
- Design the experiment
- Define the hypothesis: state expected direction and metric (e.g., “adding table of contents increases average session duration by 10%”).
- Set the success criteria: choose primary metric, minimum detectable effect (MDE), and required confidence level (
95%typically). - Calculate sample size: use a sample-size calculator or the approximate formula for proportions:
n ≈ (Z^2 p * (1-p)) / d^2Z is 1.96 for 95% confidence, p is baseline conversion, and d is MDE.
- Run the test and monitor
- Traffic allocation: split traffic to avoid bias; run tests across representative segments.
- Duration: run until sample-size and time-window cover weekly seasonality (minimum two full weeks).
- Monitor for anomalies: spikes, bot traffic, or tag failures invalidate results — pause and debug if seen.
- Learn and scale
- Validate: if statistically significant, replicate on other content formats or topics.
- Generalize: test the winning variation on a small set of pages across modalities (long-form, listicles, video landing pages) to see if lift holds.
- Document: capture hypothesis, datasets, results, and implementation notes in a central playbook.
Practical examples
- Content headline test: headline A vs B → 12% CTR lift on long-form; replicated across 8 pages → rolled into headline templates.
- Structured data: adding FAQ schema → improved rich result impressions; implemented as a sitewide pattern for category pages.
Troubleshooting tips: if results fluctuate, segment by device and channel; if sample sizes are too large to achieve, increase MDE or consolidate test variants. For teams wanting automation, integrate experiment tracking with an AI content pipeline so scoring and rollout are programmatic — see resources on how to Scale your content workflow with AI content automation at Scaleblogger.com.
Understanding and operationalizing this iterative cycle lets teams convert experiments into repeatable improvements while keeping velocity and quality aligned. When tests are run thoughtfully, learning compounds into measurable growth.
Troubleshooting Common Issues
Missing or inconsistent metrics are usually a pipeline or identity problem rather than an algorithmic mystery. Start by isolating where the gap appears — at collection, ingestion, or reporting — then apply targeted fixes that restore confidence in the numbers. Below are practical diagnostics, fixes, and checks that resolve the five most frequent measurement headaches.
Common diagnostics and quick tactics
- Check quotas and schedules first: Missing or delayed data often comes from exhausted API quotas or failed export jobs. Validate identity stitching: Attribution mismatches frequently trace to cookie expiration, inconsistent
user_id, or multiple identity providers. Dedupe at ingestion: Duplicate events are best handled by event-level keys (event_id) and idempotent inserts.
- Reconcile raw logs: When platform and warehouse numbers diverge, compare raw delivery logs and export manifests before adjusting business metrics. Preserve UTMs: Social platforms or link shorteners commonly strip UTMs; enforce
utmpreservation on redirect services.
Step-by-step fixes
- For missing/delayed data: confirm API responses and view export job history; increase retries and implement exponential backoff. 2.
For duplicate conversions: run a dedupe pass using event_id or a composite key (user_id, timestamp, event_type). 3. For platform vs warehouse mismatch: checksum raw files and compare row counts by day and event type.
- For low experiment sample: extend duration, reduce segmentation, or power-up traffic allocation. 5.
For UTMs stripped: update redirect rules or append utm parameters server-side.
Code example — dedupe by event_id (Postgres)
sql CREATE TABLE events_dedup AS SELECT DISTINCT ON (event_id) FROM events_raw ORDER BY event_id, received_at DESC;Quick troubleshooting cheat sheet: content measurement troubleshooting checklist
| Symptom | Likely Cause | Immediate Fix | Verification Step |
|---|---|---|---|
| No video views in dashboard | Tracking pixel blocked / SDK disabled | Re-deploy pixel and confirm SDK initialisation | Check network logs for 200 on pixel and video_play events |
| Duplicate conversions | Retries without idempotency / multiple SDK fires | Dedupe on event_id or composite key |
Run distinct count by event_id and compare totals |
| Mismatch between platform and warehouse numbers | Export failures / partial uploads / time zone shifts | Re-run exports; align ETL timezone handling | Compare raw export row counts and MD5 checksums |
| Low sample size for experiment | Short test duration / heavy segmentation | Increase traffic or broaden cohorts | Monitor statistical power and daily sample counts |
| UTMs stripped from social links | Redirects or shorteners drop query params | Preserve or append UTMs server-side | Click test links and inspect landing page URL parameters |
When event-level troubleshooting grows complex, automating checks and alerts reduces firefighting. Consider integrating monitoring into the CI/CD pipeline or using an automated content pipeline like AI-powered content automation to keep measurement feeds healthy. Understanding these principles helps teams move faster without sacrificing data quality.
📥 Download: Content Measurement Checklist (PDF)
Tips for Success & Pro Tips
Start by treating measurement as an operational system, not an afterthought. Establishing strong governance, automating data flows, and building a measurement culture prevents noisy dashboards and ensures decisions rest on reliable signals.
- Governance: naming, ownership, and a single source of truth
- Create strict naming conventions. Use predictable identifiers like
channel_campaign_metric(e.g.,email_welcome_open_rate) so queries and dashboards remain readable and reusable. Example rule: always includechannel_category_metric_timeframe. - Assign dataset ownership. One team or person owns each data domain (traffic, engagement, conversions) and approves schema changes.
- Enforce a single source of truth. Point every dashboard and report to one canonical table or view to avoid divergent numbers.
Practical example:
sql CREATE VIEW canonical_page_metrics AS SELECT page_id, date, sessions, conversions FROM raw_analytics WHERE is_valid = TRUE;- Automation: scheduled pulls, anomaly alerts, and validation
- Scheduled pulls: Set ETL runs at predictable intervals (hourly for real-time signals, nightly for heavier aggregations).
- Automated validation: Run checksum or row-count checks after each load and flag mismatches.
- Anomaly alerts: Configure alerts for metric drift (e.g., >20% change week-over-week) and route them to a dedicated Slack channel.
- Culture: share findings and reinforce good behavior
- Monthly insight memos: Produce a one-page memo with 3 wins, 2 problems, and 1 experiment idea. Distribute to stakeholders and archive in the knowledge base.
- Quick wins log: Capture fast, testable actions that came from data—this builds trust and shows immediate ROI.
- Review cadences: Hold a 30-minute monthly review with product, content, and growth to align on actions.
Troubleshooting tips
- If metrics disagree across tools, trace back to the ingestion timestamp and filters; mismatches are usually schema or time-zone related.
- If alerts fire too often, widen thresholds and implement a suppression window to avoid alert fatigue.
Tools and templates to build now
- Content scoring framework spreadsheet: map content → intent → KPI → benchmark.
- Automated report template with parameterized date ranges to reuse across teams. Consider integrating with AI content automation like
Learn how to automate your blogat Scaleblogger.com for pipeline orchestration.
Understanding these practices accelerates reliable decision-making and reduces rework so teams can focus on improving content, not reconciling numbers.
Appendices: Templates, Queries, and Resources
This appendix contains practical, ready-to-drop-in assets for measurement, experimentation, and executive reporting. Use the CSV and SQL examples to standardize event collection, drop the executive summary and experiment plan into stakeholder decks, and apply the UTM sheet to keep acquisition reporting accurate. These assets reduce ambiguity between engineering, analytics, and content teams so decisions happen faster.
Prerequisites
- Access to your analytics property (GA4, Snowflake, BigQuery) and version control for templates. 2.
Naming conventions agreed across teams (channels, content types, experiments). 3. Stakeholder list for the experiment plan (owners, reviewers, approvers).
Tools / materials needed
- Spreadsheet (Google Sheets or Excel) for taxonomy and UTM sheet.
- SQL client (BigQuery, Snowflake) for queries.
- Slide deck template for executive summaries and experiment briefs.
Time estimates
- Event taxonomy CSV — 1–2 hours to adapt. 2.
SQL aggregation query — 2–4 hours to test on sample dataset. 3. Executive summary — 30–60 minutes per report.
- Experiment plan — 1–3 hours depending on complexity.
Code and templates
Event taxonomy CSV example (first rows)
csv event_name,category,action,label,value,required,notes page_view,engagement,view,page_path,,yes,auto-collected cta_click,conversion,click,button_id,,yes,track all CTAs newsletter_signup,conversion,submit,form_id,,no,include user_id if availableCross-modality aggregation SQL (BigQuery example)
sql SELECT user_id, MIN(event_timestamp) AS first_touch, COUNTIF(event_name='page_view') AS page_views, COUNTIF(event_name='cta_click') AS cta_clicks FROM project.dataset.events_ WHERE event_date BETWEEN DATE_SUB(CURRENT_DATE(), INTERVAL 30 DAY) AND CURRENT_DATE() GROUP BY user_id;Executive summary template (slide-ready)
- Objective: one sentence goal. Metric focus: primary KPI + baseline. Key findings: 3 bullets.
- Recommendation: 1 action with confidence level. Next steps & owners: list with due dates.
Experiment plan template (step sequence)
- Hypothesis: concise and testable. 2.
Metric(s): primary + guardrails. 3. Design: variant details, sample size.
- Analysis plan: statistical test, significance threshold. 5.
Of templates and what they produce
| Template | Purpose | Format | How to Use |
|---|---|---|---|
| Event taxonomy CSV | Standardize events | CSV | Import to GTM or share with devs |
| Cross-modality aggregation SQL | Aggregate events by user | SQL (BigQuery) | Run as daily job in scheduler |
| Executive summary template | Stakeholder-ready report | PPT / Google Slides | Copy into weekly reporting deck |
| Experiment plan template | Structured A/B testing | Doc / Google Doc | Use for pre-launch review & approvals |
| UTM naming convention sheet | Consistent campaign tracking | Spreadsheet | Reference when creating tracking links |
Understanding these resources helps teams ship experiments and reports with confidence while maintaining consistent data hygiene. When properly integrated, they convert ad-hoc measurement work into repeatable workflows that scale.
Conclusion
After investing in multi-modal content, focus shifts from volume to measurable impact: align attribution models with channel behavior, automate cross-format tagging, and normalize KPIs so short-form and long-form can be compared. Practical experiments in the field show that teams who standardized metadata and automated engagement mapping cut reporting time by weeks and uncovered underperforming formats they could. Expect to establish a single source of truth, set up automated measurement pipelines, and iterate on creative based on outcome signals rather than impressions.
- Standardize tagging and metadata across formats.
- Automate measurement workflows to reduce manual reporting.
- Prioritize outcome metrics that map to business goals, not vanity metrics.
For teams wondering how long this takes, plan for a 4–8 week pilot to implement tagging and connect measurement; for questions about staffing, start with a small cross-functional team and scale automation; for concerns about comparability, run parallel A/B-style tests across formats. To that process, platforms like Explore Scaleblogger’s AI workflows for content measurement automation can accelerate setup and surface actionable insights faster. Next step: pick one format, apply standardized tags, and automate a weekly report to see where optimization delivers the fastest ROI.
