

> Key Takeaway: # Comparative Analysis: Benchmarking Your Content Against Competitors
How to measure where your content truly stands,…
Comparative Analysis: Benchmarking Your Content Against Competitors
How to measure where your content truly stands, where to invest next, and how to translate insights into measurable gains.*
- How competitive analysis reveals opportunity gaps and content strengths
- Practical benchmarking techniques to compare performance metrics and content quality
- A step-by-step approach for running repeatable content benchmarking cycles
- How to prioritize topics, formats, and distribution channels based on competitor data
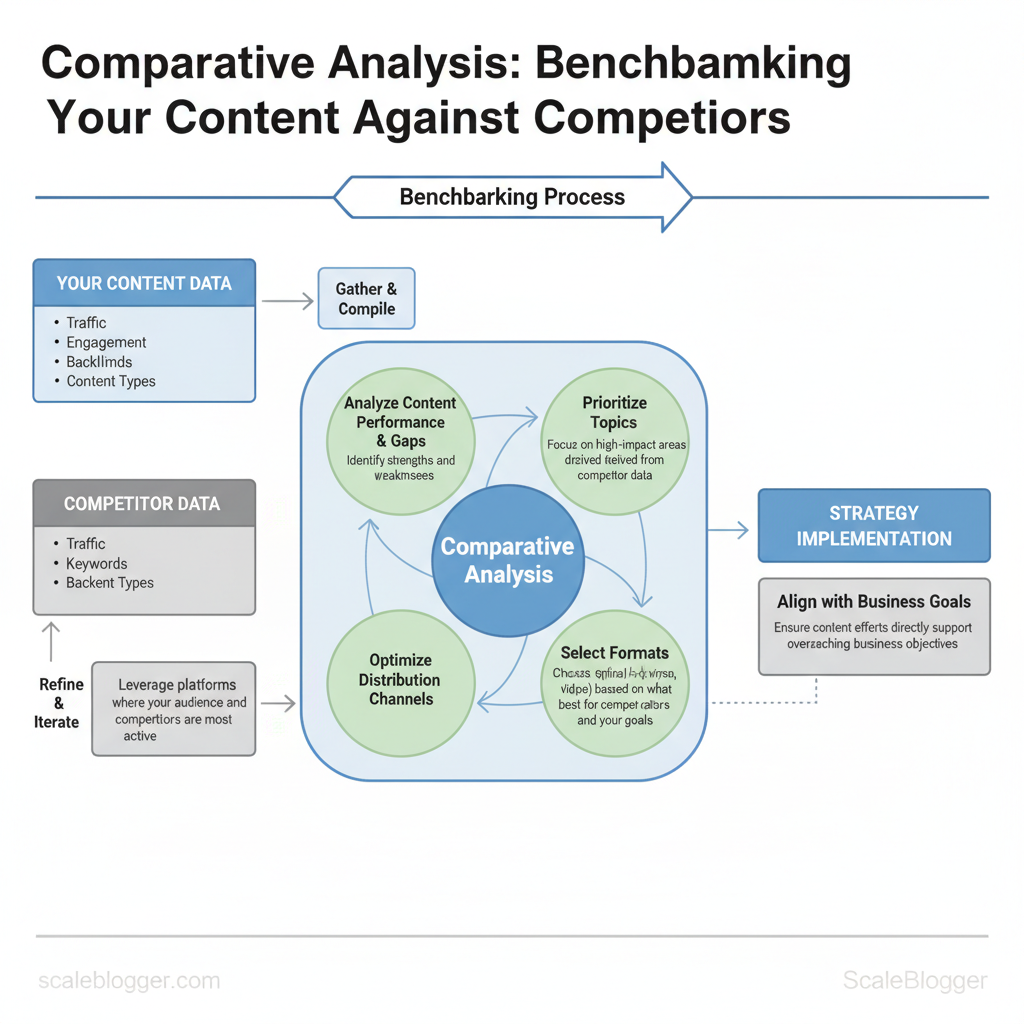
Here’s the short answer: conduct a focused competitive analysis. This should align metrics, content formats, and audience intent to create useful content benchmarks. Start by defining comparable KPIs, gather competitor data across those KPIs, normalize results for fair comparison, and convert gaps into prioritized experiments. This process uncovers both quick wins and strategic investments.
This matters because teams waste resources chasing vanity metrics. Benchmarks turn noisy signals into repeatable decisions that improve organic visibility and engagement. Some industry research suggests that structured benchmarking may increase clarity for editorial roadmaps, and experts often recommend automating data collection for consistency.
Example: comparing three competitors on organic traffic, backlink velocity, and topic depth often surfaces one high-value topic that can boost traffic by double-digit percentages when properly optimized.
I’ve advised content teams for years on competitive analysis and content benchmarking, focusing on practical frameworks rather than one-off audits. Expect clear scoring, prioritized actions, and metrics that tie to business goals.
> Benchmarks are not judgments; they are roadmaps. Use them to allocate effort where it scales.
Automate your content benchmarking with Scaleblogger: https://scaleblogger.com
Table of Contents
- H2 – Define Your Benchmarking Goals and Scope
- Section Content
- H2 – Collect Competitor Data Efficiently
- H2 – Analyze Content Performance and Gaps
- H2 – Craft a Competitive Content Plan
- H2 – Measure, Report, and Iterate
- H2 – Scale Benchmarking with Automation and Teams
- Conclusion
> Key Takeaway:
H2 – Define Your Benchmarking Goals and Scope
Identify a clear business objective first. Then, link it to measurable KPIs, a timeframe for goals, and the tools you will use to…
H2 – Define Your Benchmarking Goals and Scope
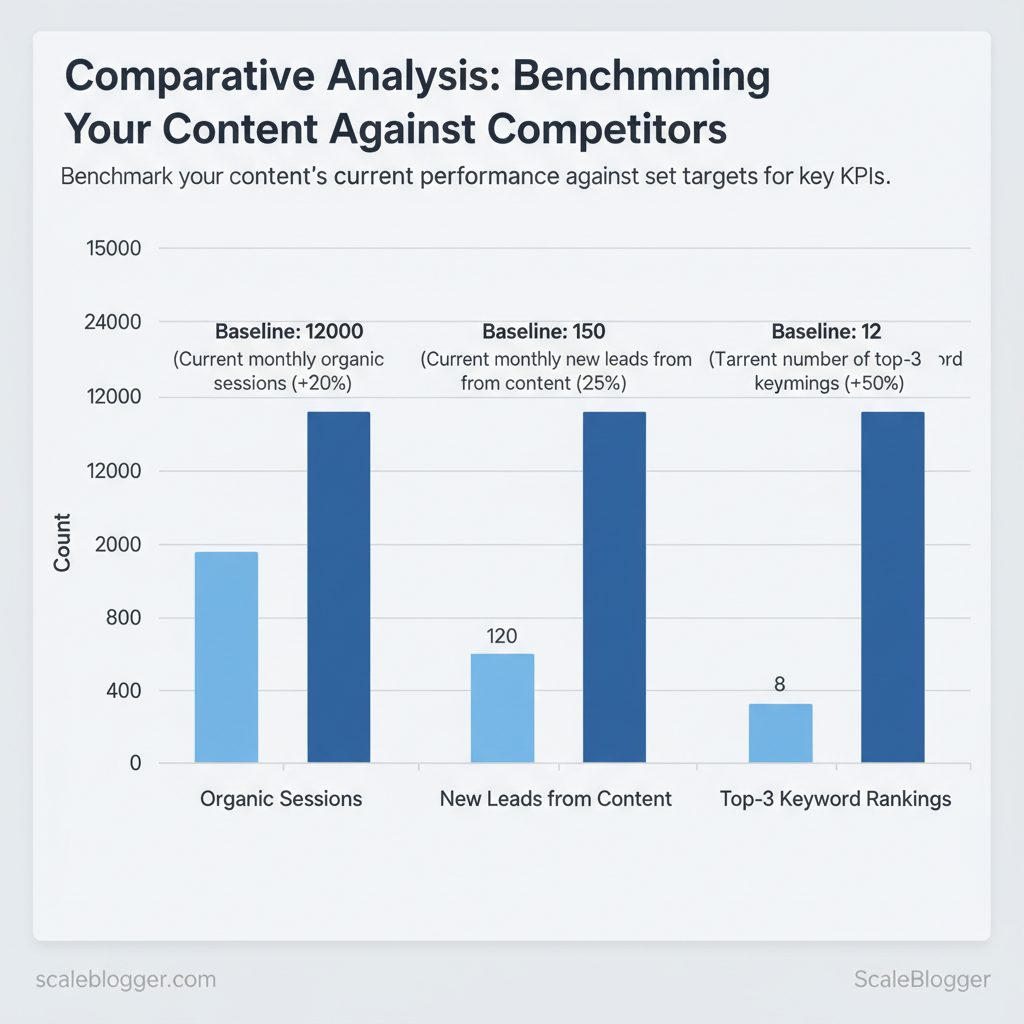
Identify a clear business objective first. Then, link it to measurable KPIs, a timeframe for goals, and the tools you will use to track your progress. That clarity prevents fuzzy benchmarking where teams chase activity instead of impact. For example, if the business goal is to grow marketing-sourced revenue, pick KPIs like organic sessions, top-3 keyword rankings, and new leads from content, set a target based on current baselines, typically within a 90- or 180-day timeframe., and assign Google Analytics, Google Search Console, and your CRM as the truth sources.
How to choose measurable goals and realistic targets
- Define one primary KPI: pick the metric that directly links to revenue (e.g., new leads from content).
- Use baselines from your data: export the last 90 days from Google Analytics and Search Console to set realistic delta targets.
- Set a timebound horizon: 90 days for tactical gains, 180–360 days for structural SEO improvements.
- Identify the business objective and map it to at least one KPI.
- Pull baseline numbers (90 days preferred) from GA4, GSC, and CRM.
- Create stretch vs realistic targets and assign owners for measurement.
How to define the scope: topics, competitors, time range
- Topics (3–5 clusters): pick clusters closest to purchase intent and one aspirational thought-leadership cluster.
- Competitor set (3–6): include 2 direct competitors, 1–2 aspirational leaders, and 1 niche peer for contrast.
- Time range: benchmark short-term (90 days) and mid-term (180–360 days) to capture both promotion lifts and organic ranking changes.
Practical example: target cluster “AI content automation” — track 5 pillar posts + 10 long-form variations, benchmark against Competitor A (direct), Competitor B (aspirational), Competitor C (niche), and set 90-day uplift targets for sessions and leads while monitoring 6-month ranking shifts.
KPI templates with baseline and target columns to help readers copy realistic goals
| KPI | Baseline | Target (90 days) | Measurement tool |
|---|---|---|---|
| Organic sessions | 12,000/mo | +20% → 14,400/mo | Google Analytics (GA4) |
| New leads from content | 120/mo (CRM) | +25% → 150/mo | Internal CRM |
| Top-3 keyword rankings | 8 keywords | +50% → 12 keywords | Google Search Console |
| Average time on page | 2:10 | +15% → 2:30 | Google Analytics (GA4) |
| Backlinks to targeted content | 35 linking domains | +30% → 45 linking domains | Ahrefs / Moz / Google Search Console |
If you want faster setup, consider an AI-powered content pipeline like the one Scaleblogger provides to automate baseline pulls, generate target-based briefs, and schedule tests—this saves time and keeps benchmarks consistent across teams. When you define clear goals and realistic scope from the start, benchmarking becomes a tool for better decisions rather than busywork. Understanding and documenting these choices helps teams move faster without sacrificing quality.
> Key Takeaway:
H2 – Collect Competitor Data Efficiently
Efficiently collecting competitor data involves focusing on a few important metrics. Automate this process where possible, and adjust results…
H2 – Collect Competitor Data Efficiently
Efficiently collecting competitor data involves focusing on a few important metrics. Automate this process where possible, and adjust results for fair comparisons. Start by tracking traffic trends, keyword rankings, backlink profiles, engagement signals, and content depth; these five dimensions together reveal what’s working and where gaps exist. Use a mix of free sources (Google Analytics, Search Console) and paid platforms (Ahrefs, SEMrush, Moz) and automate data pulls with APIs or scheduled exports into a single sheet or dashboard so analysis is repeatable and auditable.
When implemented well, teams spot content opportunities faster and reduce time spent on manual exports.
Essential metrics and how to measure them
- Traffic (sessions): Use GA4 or SimilarWeb for trend signals; prefer GA4 for site-level accuracy and SimilarWeb for competitor estimates. Normalize by per-article and per-month to compare differently sized sites.
- Keyword rankings: Use Search Console for owned keywords, and Ahrefs/SEMrush for competitor keyword discovery. Track ranking movement and search volume.
- Backlinks: Use Ahrefs, Majestic, or Moz to measure referring domains and link velocity; export anchor-text distributions.
- Engagement (time on page, bounce): GA4 offers engagement metrics; normalize by content type (long-form vs short).
- Content depth / word count: Crawl competitor pages with Screaming Frog or a simple
wget/curl+ parser to capture word counts and headings.
Quick automation & scraping best practices
- Prefer APIs when available — they’re stable and within TOS.
- Use manual exports for ad-hoc checks — faster for one-off deep dives.
- Respect rate limits and robots.txt — throttle requests and cache results.
- Normalize data early — convert to per-article and monthly rates before analysis.
> Some industry analysis suggests that teams which centralize competitor metrics may reduce decision latency and avoid duplicated effort.
Sample automation flow:
bash example: fetch keyword CSV from Ahrefs API, append to Google Sheet
python fetch_ahrefs.py > keywords.csv gsutil cp keywords.csv gs://my-bucket/ use Google Sheets import or Zapier to push into dashboard
Tools for each metric showing trade-offs (cost, accuracy, export options) so readers can choose quickly
| Metric | Recommended Tool | Cost level | Best for |
|---|---|---|---|
| Traffic (sessions) | Google Analytics (free), SimilarWeb (Free limited / Paid ~ $199+/mo) | Free / Paid | Site-accurate owned analysis, market-level estimates |
| Keyword rankings | Google Search Console (free), Ahrefs ($99+/mo), SEMrush ($119.95/mo) | Free / $ / $$ | Keyword visibility, competitor keyword gaps |
| Backlinks | Ahrefs ($99+/mo), Majestic ($49.99+/mo), Moz Pro ($99+/mo) | $ / $ / $ | Referring domains, link velocity |
| Engagement | GA4 (free), Hotjar (heatmaps $39+/mo) | Free / $ | User behavior, session-level engagement |
| Content depth / word count | Screaming Frog (¥149/yr), Sitebulb (starts $13/mo) | Low / Low | Page-level content analysis |
| Competitor traffic estimates | SimilarWeb (paid), SEMrush (estimates) | $$ | High-level market share |
| SERP features tracking | SEMrush, Ahrefs | $$ | Featured snippets, people-also-ask |
| Site crawling | Screaming Frog (desktop), wget/curl scripts |
Low / Free | Technical + content scraping |
| Quick keyword discovery | Ubersuggest (starts ~$12/mo) | Low | Budget keyword discovery |
| Automated dashboards | Google Data Studio (free), Power BI (starts $9.99/mo) | Free / $ | Centralized reporting |
If you want, I can convert this into a reusable Google Sheets template and API script that pulls Ahrefs/Search Console into a single benchmarking dashboard—Scaleblogger offers turnkey pipelines if you’d prefer to skip the setup. Understanding these principles helps teams move faster without sacrificing quality.
H2 – Analyze Content Performance and Gaps
First, measure two aspects of each content asset: the potential traffic it could bring (volume) and how well it performs or converts right now (quality). Plotting pages on a volume vs. quality quadrant immediately surfaces quick wins (high volume, low quality) and retention plays (high quality, low volume).
Use a composite gap score to rank items inside quadrants so prioritization is quantitative, repeatable, and defensible.
How to build the quadrant and compute gap scores
High-level method you can run weekly with your analytics and keyword tool data (Scaleblogger’s benchmarking service fits neatly here if you want automated reports).- Calculate the axes:
- Volume axis (0–100): normalize keyword search volume + organic clicks + impressions into a 0–100 scale.
- Quality axis (0–100): combine conversion rate, average time on page, and user engagement (scroll depth, comments) and normalize to 0–100.
- Compute a gap score:
- Gap score = (Volume weight × (100 − Quality)) + (Strategic weight × PriorityFactor)
- Suggested weighting: Volume weight = 0.6, Strategic weight = 0.4 (PriorityFactor = 0–100 based on business goals).
- Example: A page with Volume=80, Quality=30, PriorityFactor=70 → Gap = 0.6(70) + 0.4(70) = 42 + 28 = 70.
- Interpret quadrant positions:
- Upper-left (High Quality, Low Volume): Consider topic expansion and internal linking.
- Upper-right (High Quality, High Volume): Defend with content refresh and conversion optimization.
- Lower-right (Low Quality, High Volume): Highest immediate priority — rewrite, reformat, or replace.
- Lower-left (Low Quality, Low Volume): Archive, merge, or deprioritize.
What to do next is straightforward: fix the lower-right cluster first, expand upper-left into clusters, and defend upper-right with paid or distribution pushes.
Topic overlap matrix and content cluster gap table
Provide a content cluster matrix template that maps topic coverage across competitors to reveal gaps
| Topic/Subtopic | Your Coverage (Y/N & depth) | Competitor A Coverage | Competitor B Coverage | Gap Score |
|---|---|---|---|---|
| Core Topic 1 | Y — long-form guide (3,200 words) | Competitor A — long-form + FAQs ✓ | Competitor B — short overview ✗ | 25 |
| Subtopic A | Y — brief section (800 words) | Competitor A — deep tutorial ✓ | Competitor B — no coverage ✗ | 62 |
| Subtopic B | N — no content ✗ | Competitor A — pillar + case studies ✓ | Competitor B — medium depth ✓ | 85 |
| Core Topic 2 | Y — long-form + checklist ✓ | Competitor A — short guide ✗ | Competitor B — long-form ✓ | 40 |
| Subtopic C | Y — FAQ (500 words) | Competitor A — FAQ + video ✓ | Competitor B — FAQ ✗ | 55 |
From matrix to prioritized opportunities
- Step 1: Filter rows by Gap Score ≥50.
- Step 2: Cross-check search volume and business priority.
- Step 3: Produce a prioritized list (5–10 items) with format and CTA plan.
Prioritized list of opportunities :
- Subtopic B — build a 2,500–3,500 word pillar with case studies and templates. 2.
Subtopic A — convert brief section into an interactive tutorial + video. 3. Subtopic C — expand FAQ into troubleshooting guide with structured data.
- Core Topic 2 — add downloadable checklist and AMP page for speed. 5.
Core Topic 1 — add competitor comparison table and internal hub linking. 6. Additional opportunity — combine two low-performing pages into one authoritative resource.
- Long-tail series — create 6 micro-posts targeting long-tail keywords found in Search Console. 8.
Replication play — adapt competitor case study formats with your own data.
This analysis gives teams a clear, prioritized roadmap for edits, new assets, and experiments; using a repeatable gap score keeps decisions aligned with both traffic opportunity and business priority. Understanding where to invest reduces wasted effort and speeds up measurable improvements.
H2 – Craft a Competitive Content Plan
A competitive content plan guides decisions based on measurable triggers. These include whether to update current content, create new detailed articles, make short social media posts, or invest in promotions. Start by scoring content on two axes: current traffic/value and ranking velocity. High traffic but slipping rankings usually warrant an update; low traffic with high strategic intent points to create; and evergreen assets that already convert deserve periodic promotion.
com/blog/insights/seo-llm-growth-systems/” class=”internal-link”>for example, ScaleBlogger’s AI-powered content pipeline can surface update candidates and automate scheduling so teams act on the right opportunities faster.
Table: Section Content — Action, Typical Effort, Time to Impact & more
| Action | Typical Effort | Time to Impact | Best Tactics |
|---|---|---|---|
| Update existing post | Low–Medium (2–8 hrs) | Weeks | Refresh intent, add sections, internal links, schema |
| Create new long-form article | High (20–60 hrs) | Months | Deep research, original data, comprehensive SEO, outreach |
| Create short-form / social asset | Low (1–4 hrs) | Days | Repurposed snippets, CTAs, native platform optimization |
| Promotion / PR push | Medium–High (10–40 hrs) | Weeks–Months | Targeted outreach, paid amplification, journalist pitches |
| Repurpose into other formats | Medium (5–15 hrs) | Days–Weeks | Convert to video, slide deck, newsletter series |
Practical editorial brief (fields every editor must fill)
- Bold title: One-line working headline with primary keyword. One-sentence intent: Informational / Transactional / Navigational. Target audience & funnel stage: Who and where they are in the journey.
- Primary + 3 secondary keywords: Include search intent notes. Top 5 competitor URLs: Gaps to exploit and what to out-cover. Required assets: internal data, images, charts, quotes.
- CTA & conversion ask: ebook, demo, signup, etc. Publish date & promotion window: Scheduling for organic + paid. KPI targets (sample): Views 8–12k in 90 days; Leads 40–70; Backlinks 5–10.
How to set KPI targets per piece
- Use historical averages from similar pieces as baselines. 2.
Adjust for intent: Transactional targets higher conversion rate; Informational optimizes for traffic and backlinks. 3. Factor distribution: planned promotion increases short-term views; organic relies on backlinks and time.
Integrate technical SEO tasks into briefs — canonical checks, schema, hreflang if needed — and assign 1–2 internal links to authority pages per draft. Tools like ScaleBlogger’s automated scheduling and performance benchmarking make these steps reproducible and measurable for teams. Understanding these principles helps teams act decisively and scale content without bottlenecks.
H2 – Measure, Report, and Iterate
Begin by treating measurement as a core part of your content program. Set a clear schedule for reporting, create action-triggering dashboards, and run brief, structured experiments that improve strategies. Weekly checks catch execution issues; monthly and quarterly reviews reveal strategic shifts. Use automation to pull metrics into one place so teams spend time diagnosing instead of exporting.
What to monitor and when
- Weekly — execution signals: publishing status, page health (404s), indexing queue, social shares, and short-term click-through rates.
- Monthly — performance signals: organic sessions, keyword rankings, engagement (time on page, bounce), conversion events, and pages needing refresh.
- Quarterly — strategic signals: content funnel contribution, topical authority growth, cost per lead, and competitor content moves.
Dashboard widgets that matter
- Traffic by cohort: organic, referral, paid — spot shifts quickly. Top pages by conversions: prioritize updates that move business metrics. Keyword momentum: visualize groups gaining or losing impressions.
- Content freshness heatmap: age of top-100 pages vs. performance. Experiment tracker: live status, winner/loser, and next steps.
How dashboards trigger action
- If a page’s clicks fall >15% week-over-week, add a
Priority Updatetag and schedule an update within 7 days. 2.
If a new test shows +20% CTR and +10% sessions after 4 weeks, roll into a playbook and A/B the template. 3. Use automated alerts to assign owners — dashboards should create work, not just charts.
Iterative improvement: tests, learnings, and playbooks Create short, measurable experiments with clear windows and decision rules. Example experiment templates work best as hypothesis → change → metric → window → decision. Capture outcomes in a living playbook and update content briefs so wins scale.
Provide a 90-day experiment timeline template showing when to test, measure, and iterate
content experiment timeline
| Week | Activity | Metric to Measure | Decision Point |
|---|---|---|---|
| Weeks 1-2 | Launch variant A (title/meta) | CTR, impressions | If CTR +15% → keep; else revert |
| Weeks 3-4 | Monitor indexing + UX signals | Sessions, bounce rate | If sessions +10% and bounce down → continue test |
| Weeks 5-8 | Scale change to top 10 similar pages | Avg sessions per page | If median lift ≥8% → create playbook |
| Weeks 9-12 | A/B test template or schema update | Conversions, dwell time | If conversions +5% → roll out; else iterate |
| Review & Plan | Document learnings, update briefs | All above aggregated | Decide scale / archive / pivot |
Practical templates and capture methods
- Experiment note (one-liner):
Hypothesis — Change — Metric — Window - Playbook record: outcome, steps to reproduce, required assets, owner, rollback criteria
- Brief update: replace stale KPI targets, include sample copy and before/after screenshots
Industry analysis shows automation reduces reporting friction; consider tools that centralize metrics and automate alerts. Scaleblogger’s AI-powered content pipeline and automated scheduling can feed dashboards and convert experiment wins into publishable playbooks faster. When measurement is baked into the workflow, teams move quicker and decisions are grounded in repeatable evidence.
📥 Download: Content Benchmarking Checklist (PDF)
H2 – Scale Benchmarking with Automation and Teams
Successful benchmarking happens when teams use clear management and light automation together. This approach consistently measures output quality, reach, and speed. Start by assigning a single Benchmark Owner who translates business goals into measurable KPIs, then give data and ops teams the automated feeds and SLAs they need to keep benchmarks current. Automation removes manual polling and frees editors to iterate on creative improvements rather than wrangling spreadsheets.
Roles, responsibilities, and governance
- Benchmark Owner: Owns the benchmark definition and prioritization across teams. Data Analyst: Maintains datasets, validates signals, and produces weekly insights. Content Editor: Executes content experiments and reports qualitative outcomes.
- Growth/Performance Lead: Translates benchmarks into paid/organic activation plans. Agency/Contractor: Delivers supplemental content or data processing under explicit SLAs.
How to set SLAs and handoffs
- Define freshness SLAs:
SLA:24hfor traffic/engagement,SLA:72hfor conversion events, monthly for thematic benchmarking. 2.
csv` to a shared repo; Content Editor acknowledges and schedules work within 48 hours. 3. Use error budgets: Allow a small percentage of delayed or failed runs before manual escalation to avoid alert fatigue.
- Document acceptance criteria: Every benchmark includes expected sample size, confidence threshold, and required metadata fields.
Automation playbook and toolchain
- Minimum viable automation: data ingestion (scheduled pulls), metric compute layer, alerting, dashboarding, and content task creation.
- Practical alert triggers: sudden >20% drop in organic sessions, CTR change >15% on top pages, new content topic surge in search queries.
- Cost vs ROI guidance: start with configurable off-the-shelf tools for ingestion and dashboards, add custom transforms only when monthly ROI exceeds tooling cost by 3x.
Example alert config
yaml alert_name: OrganicSessionsDrop threshold: -20% lookback: 7d actions: - notify: #channel-performance
- create_task: ContentEditor, priority:high
Operational tips and examples
- Bold delegation: give the Data Analyst authority to pause unreliable feeds.
- Tight cadence: run lightweight weekly snapshots and deeper monthly reviews.
- Iterate tooling: prototype with existing platforms; only build custom ETL when repeatable transformation needs exist.
Table: Section Content — Role, Primary Responsibility, Deliverables & more
| Role | Primary Responsibility | Deliverables | Cadence |
|---|---|---|---|
| Benchmark Owner | Define KPIs, prioritization | Benchmark brief, roadmap | Weekly |
| Data Analyst | Data pipelines, validation | Clean datasets, dashboard metrics | Daily |
| Content Editor | Experiment execution, quality control | Content tests, editorial notes | Weekly |
| Growth/Performance Lead | Activation and traffic strategy | Campaign briefs, KPI targets | Bi-weekly |
| Agency/Contractor | Supplemental production/analysis | Content batches, model runs | Per sprint |
Understanding these principles helps teams move faster without sacrificing quality. When implemented correctly, this approach reduces overhead by making decisions at the team level and letting automation handle routine measurement.
Conclusion
You’ve discovered how benchmarking against competitors turns vague assumptions into clear decisions. Measure your shortcomings, focus on pages with the largest traffic and conversion gaps, and try new formats or topics where competitors excel. Teams that reallocated effort based on these signals typically recover lost visibility within months, and smaller publishers have doubled organic engagement after targeting a handful of underperforming topics. If you’re wondering whether to start with keyword gaps or content quality, begin with the gap that maps most closely to your business goals; if you’re asking whether this pays off quickly, evidence suggests focused moves produce measurable gains within a single quarter.
If you want to move from insight to action, audit your top 50 pages, map competitor performance, and run one A/B content change this month. For an easier, automated path to collect competitor data and generate benchmarking reports, try Automate your content benchmarking with Scaleblogger — it speeds up data collection, highlights the highest- opportunities, and creates shareable reports your team can act on. Take that next step: gather the numbers, pick one target to, and iterate — the pattern of small, evidence-driven changes consistently outperforms big, unfocused bets.
