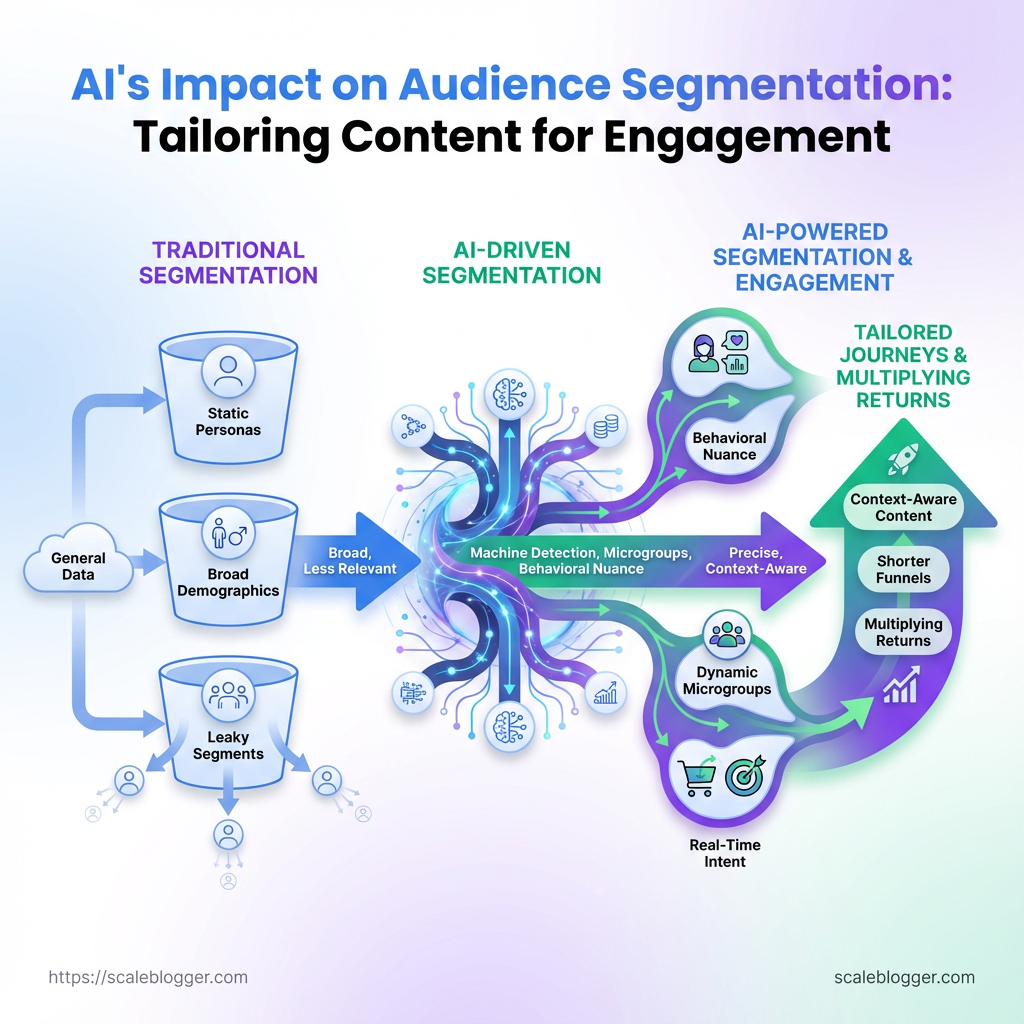
Most content teams still treat audiences like neat buckets: demographics on a spreadsheet, personas that never change. The problem is those buckets leak—behavior shifts by hour, intent morphs with search queries, and simple rules miss the nuance that drives clicks and loyalty. Machine-driven pattern detection flips that math: AI audience segmentation finds microgroups defined by behavior, not labels, and surfaces signals humans rarely spot.
That shift forces a rethink of how content is planned and measured. A personalized content strategy built on real-time segments turns one-size-fits-all posts into targeted journeys that respect context and intent. When segmentation is precise, engagement strategies stop guessing and start multiplying returns—shorter funnels, higher relevance, and content that feels chosen for the reader rather than thrown at them.
Prerequisites & What You’ll Need
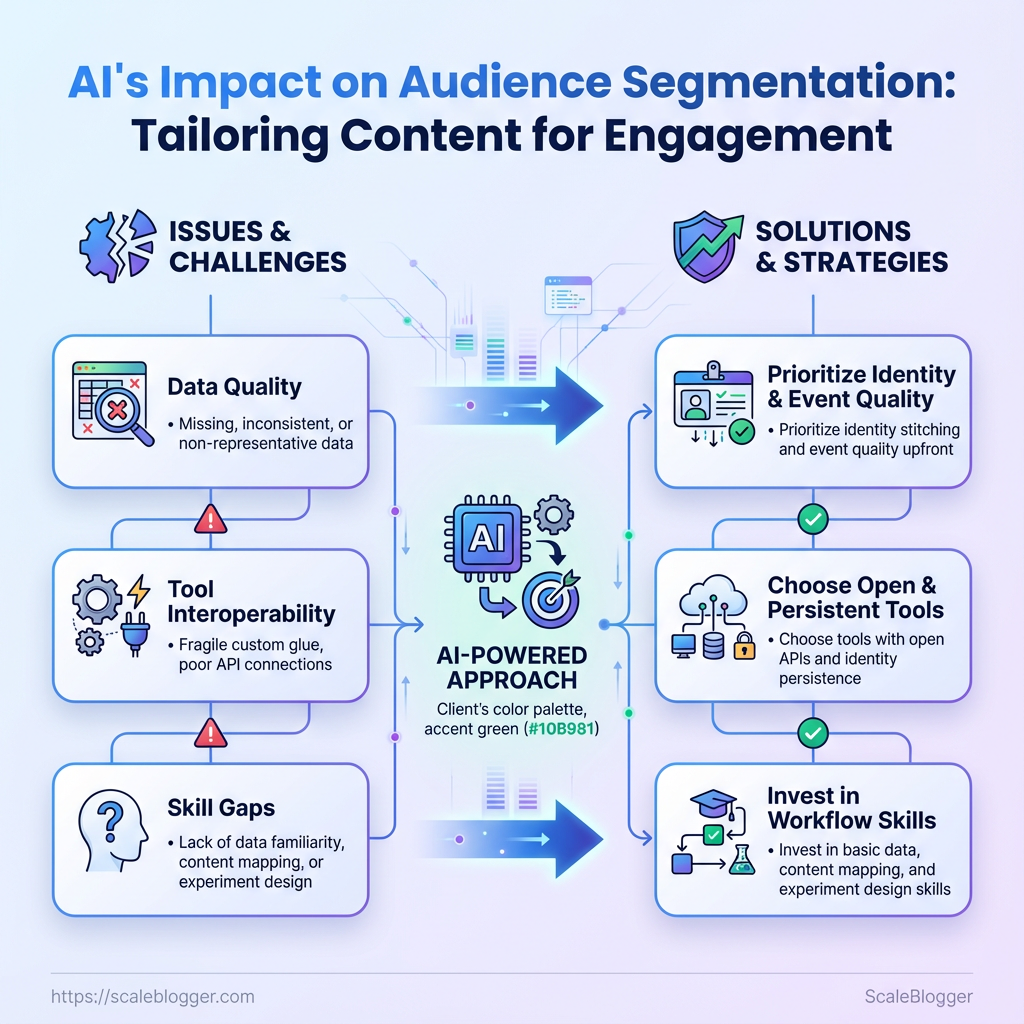
Start with clean inputs and the right toolkit: AI audience segmentation and a personalized content strategy depend on representative data, interoperable tools, and a few practical skills. Without behavioral, demographic, and transactional signals fed into an AI segmentation platform, recommendations will be shallow; with them, personalization becomes precise and scalable.
Data sources: Behavioral data (page views, session paths, click events) must be captured at the user or session level. Demographic data: Age, location, industry, company size, role—helpful for segment labeling and content targeting. Transactional data: Purchase history, subscriptions, trial activity, ARR—critical for intent and monetization segments.
Tools & materials
Segmentation/AI platform: A platform that supports clustering, propensity models, and raw export (e.g., Optimove, Amperity, Amplitude). Analytics platform: Google Analytics 4, Mixpanel or Adobe Analytics to capture event-level behavior. CMS: WordPress, Contentful, HubSpot CMS for content activation and templated personalization. Customer Data Platform (CDP): Segment, mParticle, Treasure Data to unify identity across touchpoints. Visualization/reporting: Looker, Tableau, Power BI, or Google Data Studio for monitoring segment performance and editorial ROI.
Skills
Basic data familiarity: Comfort with event schemas, CSVs, and common KPIs (CTR, conversion rate, LTV). Content mapping: Ability to map segments to content intent and funnel stage. Experiment design: Simple A/B or multi-variant testing knowledge to validate personalization.
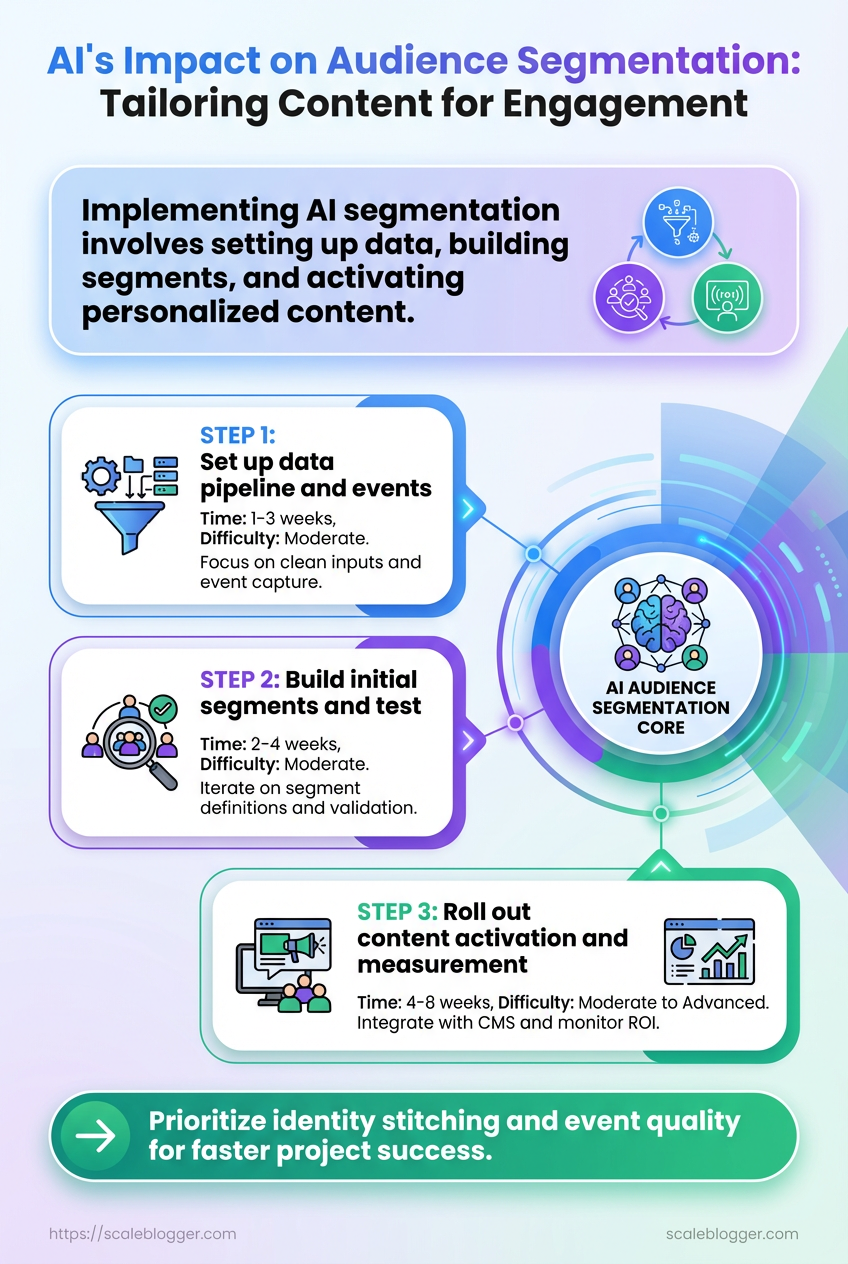
Time estimate and difficulty
- Set up data pipeline and events: 1–3 weeks (moderate difficulty).
- Build initial segments and test: 2–4 weeks (moderate).
- Roll out content activation and measurement: 4–8 weeks (moderate to advanced).
Required tools and the role they play in the workflow (which tool handles segmentation, which handles content activation, which captures analytics)
| Tool Type | Example Tools | Primary Function | Minimum Requirement |
|---|---|---|---|
| Segmentation / AI Platform | Optimove, Amperity, Amplitude | Behavioral clustering, propensity modeling | Raw event import, API export, model explainability |
| Analytics Platform | Google Analytics 4, Mixpanel, Adobe Analytics | Event collection, funnel analysis | Event-level tracking, user-scoped IDs |
| Content Management System (CMS) | WordPress, Contentful, HubSpot CMS | Content activation, templating, personalization | API or plugin-based personalization, multi-variant support |
| Customer Data Platform (CDP) | Segment, mParticle, Treasure Data | Identity stitching, unified profile | Cross-device identity, streaming ingestion |
| Visualization / Reporting | Looker, Tableau, Power BI, Data Studio | Dashboards, cohort analysis | Scheduled reports, cohort filtering |
| Email/Activation | Braze, Mailchimp, Iterable | Segment-based messaging, cadence control | API triggers, dynamic templates |
| Experimentation | Optimizely, VWO, Google Optimize (legacy) | A/B testing, feature flags | Client-side/server-side tests, audience targeting |
| Search/Recommendation | Algolia, Elasticsearch, Coveo | Content recommendations, search personalization | Real-time indexing, query personalization |
This table shows which system owns segmentation versus activation versus analytics; aim for open APIs and identity persistence across them so segments are actionable.
Industry practice shows that projects succeed fastest when identity stitching and event quality are prioritized up front. Pick tools that let data flow between segments, CMS, and your activation layer without fragile custom glue. If speed to value matters, consider a managed pipeline or Scaleblogger.com to automate parts of content activation and measurement.
Getting these prerequisites right cuts wasted effort later—spend the setup time now and personalization becomes a repeatable growth lever.
Step-by-Step: Prepare Your Data
Start by treating data prep like plumbing: if the pipes are wrong, nothing downstream behaves. The objective is a clean, trustworthy event dataset spanning a representative window, with engineered features that map to real user behaviors you can act on for AI audience segmentation and a personalized content strategy.
- Audit and Export Relevant Data
- Identify the event types and attributes you need (pageviews, clicks, conversions, video_plays, scroll_depth).
- Export a full historical range — aim for 6–12 months to capture seasonality and lifecycle stages.
- Include core identifiers:
user_id,session_id,timestamp, and any content identifiers (article_id, category_id). - Validate exports by reconciling totals with your analytics platform (compare exported event counts to dashboard totals and sampling rates).
What to check during the audit
- Event coverage: confirm critical events exist for all key flows.
- Attribute completeness: ensure fields like
page_urlandreferrerare populated. - Sampling or retention limits: know if your analytics provider truncates older data.
- Clean and Normalize Data
- Deduplicate using
user_id+timestamp(keep the most complete record when duplicates differ). - Normalize timestamps: convert all times to UTC and store
timestampas ISO 8601YYYY-MM-DDTHH:MM:SSZ. - Standardize categorical variables (map variants like “Healthcare”, “health care”, “health-care” to a single label).
- Log every transformation in a changelog or
data_transforms.mdto keep the pipeline auditable.
Practical tips for cleaning
- Timezone handling: convert client-side local times to server UTC before sessionization.
- Missing values: impute conservatively or flag rows for exclusion rather than guessing behavior.
- Feature Engineering for Segmentation
- Compute RFM features: Recency (days since last event), Frequency (events in period), Monetary (if applicable, revenue).
- Create engagement metrics: time-on-site (session_end – session_start), pages/session, average session duration.
- Build affinity features: counts of clicks by topic, category views, tag interactions.
- Document each feature definition clearly.
Recency: Days since the user’s most recent tracked event.
Frequency: Count of meaningful events in the chosen window.
Monetary: Revenue attributed to the user in that window.
Affinity score: Weighted count of interactions with a topic or category.
- Pro tip: store both raw counts and normalized ratios (e.g., clicks_per_session) for model flexibility.
If automation is the goal, integrate this cleaned dataset into an automated pipeline or tools that support AI-driven segmentation—Scaleblogger.com is one option that fits into content workflows for bringing these features into personalized content pipelines. Preparing data this way makes segmentation reliable and repeatable, so downstream models and targeting actually move the needle.
Step-by-Step: Build AI Segments
Start by picking a method that fits your data and business question. When customer behavior is noisy and you want discovery, use clustering. When you have labeled outcomes (e.g., conversion/no-conversion) and want predictable groups, use supervised models. Practical choices: k-means, DBSCAN, or hierarchical for clustering; logistic_regression, random_forest, or gradient-boosted trees for supervised classification.
- Step 4: Choose a Segmentation Method
- Choose clustering when you need exploratory groups and don’t have target labels.
- Choose supervised models when you can define a target (e.g., high-value reader) and want repeatable classification.
- Prepare features: scale numeric features with
StandardScalerorMinMaxScalerand encode categorical fields with one-hot or target encoding depending on sparsity. - Select number of clusters: run an elbow plot for within-cluster sum of squares and compute silhouette scores to validate separation. If elbow is ambiguous, try a stability approach: bootstrap clustering and measure cluster consistency.
- Record everything: dataset version, feature list, preprocessing pipeline, algorithm, and hyperparameters (e.g.,
k=5,init='k-means++',random_state=42). Store model artifacts and a short README so experiments are reproducible.
What to watch for: Imbalanced features: scale before clustering or dominant variables will skew results. High cardinality categories: consider hashing or target encoding to avoid explosion. * Interpretability tradeoffs: simpler clustering + feature importance projections are easier to explain to stakeholders.
Step 5: Label and Describe Each Segment
Create names that people actually use. Avoid code-like labels such as cluster_3.
Segment naming: Use descriptive, human-readable phrases like High-frequency readers, Budget-conscious browsers, Research-first prospects.
Document size and priority: For each segment, record segment size (absolute and % of audience) and a business priority rating (1–3).
Top 3 engagement drivers: List the three strongest signals that define the segment — e.g., short session length, prefers listicles, opens emails within 24 hours.
Content mapping: Assign content types to each segment. High-frequency readers: deep-dive guides, weekly newsletters. Budget-conscious browsers: product comparison pages, discount offers. * Research-first prospects: data-driven long-form, case studies.
Include an example entry for each segment in your documentation, save it with the model artifact, and link content templates back to segments. If using automation, tools that offer AI content automation and content scoring frameworks can push personalized drafts directly into your workflow, accelerating repeatable personalization.
A clear segmentation process plus readable labels turns model output into action: content teams know what to create, product teams know who to target, and stakeholders see measurable next steps.
Step-by-Step: Activate Personalized Content
Start by mapping each content piece to the audience segment it best serves, then launch controlled personalization tests. Aligning intent, format, CTA, and metrics keeps personalization from becoming noisy and makes results actionable.
Audience segments: A clear list (e.g., High-Value Engagers, New Subscribers, Churn Risk). Content inventory: Inventory with topic, format, and baseline performance. Analytics access: Event-level tracking and goal funnels in your analytics tool. Testing platform: Ability to run variants (A/B tool, feature flags, or CMS personalization module).
Tools & materials
- Experiment platform: Optimizely, Google Optimize alternatives, or your CMS personalization engine.
- Analytics: GA4, a product analytics tool, or server-side event capture.
- Content assets: Variants ready (headline/video/image/CTA).
- Template: Mapping spreadsheet or content mapping table (see below).
Map content to segments: practical steps
- Identify segment intent and match content goals.
- Choose formats that match consumption patterns.
High-Value Engagers want deeper education or product value; New Subscribers need orientation and trust-building.
- Short-form email: for New Subscribers.
- Long-form guide / video: for High-Value Engagers and Topic Enthusiasts.
- Define a primary CTA per content piece.
- Set measurable engagement metrics.
Primary CTA: one clear action (subscribe, trial, read next, request demo).
- Engagement KPI: time on page, percent scroll, CTA clicks, conversion rate.
- Quality KPI: content-scoring or lead quality where applicable.
Deploy and A/B test personalization: how to run it
- Design single-variable tests.
- Estimate sample size and duration.
- Define success metrics and thresholds.
- Plan iterative changes after results.
Change only one element per test (headline, hero image, CTA text, or recommended next article).
Use a sample-size calculator or rule of thumb: smaller expected lifts need larger samples. Many teams run tests for a minimum of two full business cycles (typically 2–4 weeks) to cover traffic variance.
Primary metric: the KPI tied to the CTA (click-through or conversion). Secondary metrics: engagement depth and retention. Predefine a minimum detectable effect (e.g., 5–10% lift) before calling a winner.
If a variant wins, roll it out and design a follow-up test that tweaks another single variable. If inconclusive, increase sample size or test a different variable.
Quick tips: keep control groups stable, monitor for novelty effects, and segment results by device and traffic source to avoid misleading averages.
Provide a ready-to-use content mapping template (segment, content type, CTA, KPI) for writers and marketers
| Segment | Content Type | Primary CTA | KPI to Track |
|---|---|---|---|
| High-Value Engagers | Long-form guide / Webinar | Request demo | Demo requests / Time on page |
| New Subscribers | Onboarding email series | Confirm subscription | Welcome click-through rate |
| Churn Risk | Win-back offer / Exit survey | Re-engage (offer) | Re-engagement rate |
| Topic Enthusiasts | Deep-dive article / Video | Read next article | Scroll depth / Repeat visits |
| Low-Frequency Visitors | Short social-driven content | Subscribe | New subscriber rate |
Key insight: Mapping content to segments makes CTAs and KPIs explicit, which simplifies testing and prioritization. Use this template to hand off clear, testable briefs to writers and engineers.
Personalized content performs when it’s deliberate: map smartly, change one thing at a time, and treat every winner as a step toward a scalable personalization playbook. If automating the pipeline matters, consider integrating an AI content automation layer to speed iterations, such as AI content automation.
Step-by-Step: Measure and Optimize
Start by measuring what actually moves the business, then iterate on the audience segments and content that produce it. Define clear KPIs, build dashboards that make anomalies obvious, and create a repeatable review cadence so decisions are evidence-driven rather than opinion-driven.
Primary KPI: Conversion metrics directly tied to business goals (e.g., trial signups, lead form completions, revenue per visitor).
Secondary KPI: Engagement and discovery signals (e.g., CTR, time_on_page, pages per session) that predict primary KPI movement.
- Define KPIs and build dashboards
- Map 3–5 Primary KPIs and 3–5 Secondary KPIs to each content funnel stage.
- Set baselines and targets
- Calculate a 90-day baseline for each KPI, then set realistic targets: a conservative 10–20% improvement for initial experiments, stretch goals later.
- Establish monitoring cadence and alerts
- Monitor dashboards daily for traffic/alerts, weekly for experiment performance, and monthly for strategic trends. Configure automated alerts for threshold breaches (e.g., ≥25% drop in conversion rate or sudden traffic spikes).
- Iterate on segments and content
- Schedule quarterly retraining of audience segments and content models, plus ad-hoc retraining when triggers fire.
- Expand and prune features
- Add features when they measurably improve prediction or personalization (e.g., event-based recency, user intent score). Prune features that add complexity without lift.
- Content performance review process
- Run a monthly review: pull top/worst performers, annotate reasons (topic mismatch, CTA friction, SEO visibility), and assign actions — rewrite, promote, or retire.
- Document changes and outcomes
- Log every experiment with hypothesis, changes made, dates, and observed impact on KPIs. Use a simple changelog table or an experiment tracker so future teams can reproduce what worked.
1. Create dashboard widgets such as: Traffic trend: daily/weekly sessions by channel Conversion funnel: page → CTA view → form submit Engagement heatmap: top content by time_on_page and scroll depth Segment comparison: behavior across audiences (new vs returning, persona A vs B) * Alert widget: percentage drop or spike thresholds
1. Define ad-hoc triggers: Performance trigger: content falling below 50% of baseline conversions for two weeks Opportunity trigger: a new high-value keyword or audience signal emerges * Product trigger: new feature launch that requires content alignment
Practical tools to consider include analytics platforms, A/B testing frameworks, and an AI content pipeline for automating segment retraining—Scaleblogger.com fits naturally when scaling those workflows. Measure steadily, iterate pragmatically, and soon the system will surface the content and segments that reliably drive results.
Troubleshooting Common Issues
When personalized content underperforms or behaves unexpectedly, start by treating symptoms like a debugging ticket: observe the visible effect, check the simplest cause, then escalate to data and system checks. Fast detection and short remediation loops keep audience trust intact and prevent wasted spend on amplification.
Common problems and how to detect them
- Low engagement despite high impressions: CTR and time-on-page drop while impressions rise.
- Wrong segment receiving content: Feedback or analytic funnels show mismatched behavior signals.
- Privacy/consent failures: Consent metrics or CMP logs show missing
consent=truefor targeted flows. - Content quality drift: Rising bounce rates paired with lower conversions on personalized variants.
Root-cause checks and quick remediation
- Review targeting rules in your segmentation engine.
- Audit the recent content changes (title, hero image, CTA) that map to the affected segment.
- Check the data pipeline health for user attributes feeding personalization (
last_active,purchase_intent,geo). - Validate the feature flags and A/B test allocations to ensure variants are routed correctly.
- Re-run sample users through the personalization logic locally or in a staging environment using
user_idand attribute snapshots.
If a quick fix is needed, swap the personalized experience back to the baseline version or pause the campaign while investigating.
When to roll back personalization
- Performance drop exceeds expected variance: If conversion or engagement is worse by your predefined threshold for two consecutive reporting windows, roll back.
- Data source integrity issues: Missing or stale attributes that drive personalization should trigger rollback.
- Privacy non-compliance: Any evidence of consent misalignment requires immediate rollback of targeted experiences.
Privacy checks and consent compliance
Consent audit: Export recent consent logs and confirm matching consent_version for targeted segments.
Data minimization: Ensure only required attributes are used for targeting, and that retention rules are enforced.
Logging: Keep an immutable event log for segment evaluations for audits and debugging.
Practical example: if a promo intended for active buyers hits inactive users, run the segment query for a random sample of n=100 users, inspect last_purchase_date, and patch the segment rule from last_purchase < 365 to last_purchase < 90 as needed.
Using an automated content pipeline can accelerate detection and rollback. Tools like Scaleblogger.com help automate content routing and provide rollback controls when personalization misfires. Keep iteration tight: small experiments, clear guardrails, and auditable consent are the fastest route back to stable, high-performing personalization.
📥 Download: AI Audience Segmentation Checklist (PDF)
Tips for Success & Pro Tips
Start by focusing on the few changes that move the needle. Prioritize audience segments by potential impact, use modular content components to speed production, track feature importance so recommendations remain transparent, and keep privacy and ethics front and center as the strategy scales.
Prioritize segments by potential impact: Audience segments with the largest reach or conversion uplift deserve top attention. Rank segments by estimated traffic potential, conversion rate, and ease of personalization. Then invest where the expected ROI is highest.
Use modular content components: Break every article into reusable parts — intro hooks, data-driven insight blocks, CTAs, and FAQ modules. Modular pieces mean faster A/B tests and consistent tone across formats.
Track feature importance for transparency: When models suggest headlines, topics, or personalization rules, keep a lightweight log that records which input features influenced a decision. This improves auditability and makes it easier to explain why a piece of content targeted a segment.
Maintain privacy and ethical standards: Always minimize PII, default to aggregated signals, and document consent flows. Privacy-first design reduces risk and builds reader trust, which improves long-term engagement.
Practical steps to implement these ideas:
- Build a prioritized segment list: score by traffic potential, conversion probability, and personalization effort.
- Create a component library: store intros, data blocks, and CTAs in a CMS with tags for quick assembly.
- Add a simple
feature_importance.csvthat logs model inputs, predicted lift, and human reviewer notes. - Audit data sources quarterly for PII exposure and consent alignment.
Quick pro tips that save time and guard quality:
- Bold testing cadence: Run headline and CTA tests weekly for high-traffic segments.
- Lean governance: Require one human review for model-suggested personalization before publish.
- Metric alignment: Tie content experiments to one primary metric (e.g., engagement time) to avoid chasing vanity signals.
- Version control for components: Tag component versions so past creative can be restored quickly.
Modular component: A reusable FAQ block that can be dropped into any article and updated centrally.
Using tools to automate parts of this workflow makes sense; for teams looking to scale, Scale your content workflow works well for automating pipelines and tracking content performance. Apply these practices and the production process gets faster without sacrificing clarity or trust. Keep the focus on high-impact segments, reuse everything you can, and treat transparency and privacy as product features—those are the things that sustain growth.
Conclusion
Treating audiences as living systems instead of static buckets shifts how content gets created, targeted, and measured. After prepping clean data, building AI-driven segments, and activating personalized flows, teams usually notice three things: more relevant opens and clicks, faster experimentation cycles, and clearer signals for what content actually moves customers. Teams that automated segmentation and tied those audiences to real-time content paths reported a noticeable lift in engagement, and the troubleshooting steps in this guide help avoid the common traps that slow rollout.
If questions are still lingering—how long until results appear, what metrics matter, which tools to start with—expect initial signals in a few weeks, prioritize engagement and conversion rates, and begin with platforms that support both segmentation and multivariate testing. For a practical next step, prepare a prioritized data checklist, run one pilot segment with a controlled audience, and measure engagement before and after. To streamline that process, platforms like Explore Scaleblogger's services to scale AI-driven content strategies can help teams automate segmentation, deploy personalized content, and scale measurement without rebuilding workflows from scratch.
