

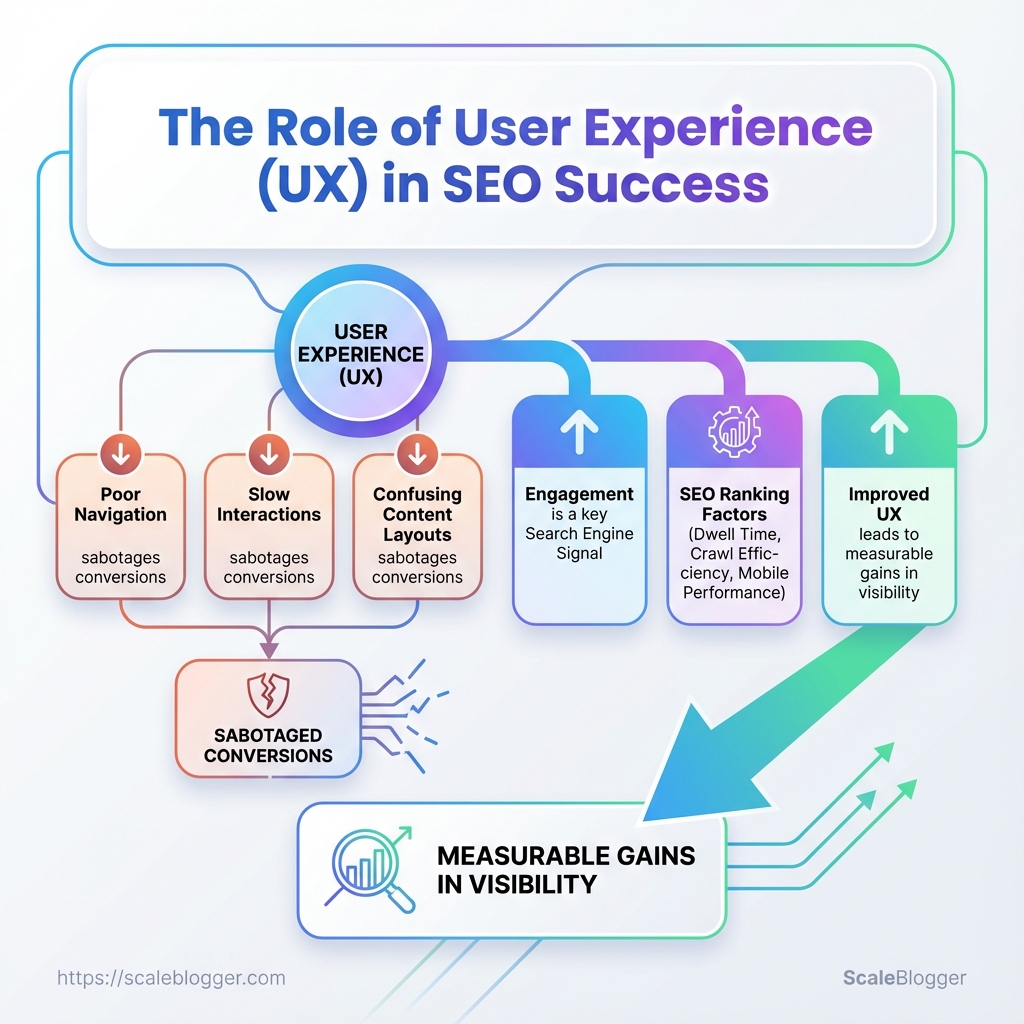
The role of user experience in SEO becomes clear when a well-optimized page attracts visitors but fails to keep them engaged. Rankings may bring the click, but the experience determines what happens next.
Slow pages, confusing navigation, poor mobile usability, and difficult-to-read content can create friction even when the SEO fundamentals are strong.
A better user experience and SEO strategy focuses on making pages fast, accessible, easy to navigate, and aligned with search intent.
When UX optimization removes these barriers, visitors can find what they need faster, engage with the content, and move naturally toward the next step.
What You’ll Need (Prerequisites)
Start with access. To run a useful UX and SEO audit, you need analytics, search visibility data, permission to change the site, and some diagnostic tools. Without these resources, observations remain theoretical, and you cannot validate improvements. Below are the practical prerequisites and the core tools that let an audit move from theory to measurable wins.
Analytics access: GA4 or equivalent account with at least 90 days of data and permissions to view events and engagement metrics.
Search visibility: Access to Google Search Console (or Bing Webmaster Tools) for query, impressions, and indexing insights.
CMS/editor access: Ability to edit content and push changes (WordPress editor, headless CMS, or developer workflow with deploy permissions).
Deployment path: A testing/staging environment plus a clear process to deploy updates to production.
Technical familiarity: Basic proficiency in HTML/CSS and comfort inspecting elements in the browser devtools.
SEO basics: Understanding of on-page SEO concepts—meta titles, headings, canonical tags, structured data, and crawlability.
Stakeholder alignment: Contact for product/marketing and engineering to approve experiments and deployments.
Tools & materials
- Google Analytics 4: traffic, engagement, conversion funnels.
- Google Search Console: queries, indexing issues, sitemap status.
- Performance tools: Lighthouse / PageSpeed Insights for real-world lab metrics.
- Session recording: Hotjar or FullStory to watch user behaviour.
- A/B testing: Optimizely, VWO, or Google for experiments.
- Accessibility checker: axe DevTools or WAVE for WCAG issues.
- Editor/IDE access: admin account or git workflow to push fixes.
- Optional automation: content pipelines or automation tools such as Scaleblogger.com to speed editorial changes and experiment rollout.
Quick reference of required tools and why each is needed
Table: What You’ll Need (Prerequisites) — Tool, Purpose, Cost/Access & more
| Tool | Purpose | Cost/Access | Notes |
|---|---|---|---|
| Google Analytics 4 | Traffic & engagement analysis | Free | Event tracking, conversion paths |
| Google Search Console | Search queries & indexing | Free | Coverage reports, URL inspection |
| Lighthouse / PageSpeed Insights | Lab & field performance metrics | Free | Core Web Vitals diagnostics |
| Hotjar / FullStory | Session replay, heatmaps | Free tier / paid | Behaviour insights, friction points |
| Optimizely / VWO / Google | A/B testing and experimentation | Free () / paid | Feature flags, rollout control |
| axe DevTools | Automated accessibility checks | Free / paid | WCAG checks, issue export |
| WordPress / CMS Editor | Content editing & publishing | Varies | Direct edit or PR-based workflow |
| Browser devtools (Chrome/Edge) | Inspecting DOM, network, CSS | Free | Debugging, measuring paint/compute |
Key insight: These tools together cover measurement (GA4, Search Console), diagnosis (Lighthouse, recordings, accessibility), and action (CMS access, A/B platforms). Having both observation (session recordings) and validation (experiments) in place turns fixes into measurable gains in user experience and SEO ranking factors.
Plan to get accounts and permissions sorted before running the audit. With those pieces in place, fixes can be targeted, tested, and shown to move the needle—rather than guessed at.
Step-by-step UX Audit to Improve SEO
View UX issues as challenges that directly affect your search signals. Slow pages, unstable layouts, and confusing navigation reduce crawl efficiency, engagement, and rankings. A targeted audit can find important fixes that you can implement quickly and A/B test for potential gains.
Access to analytics: GA4 or server logs with at least 30 days of traffic. Staging environment: For safe testing and rollouts. Stakeholders: Product, dev, content, and marketing aligned on goals.
Tools & materials
- Performance tools: Lighthouse, WebPageTest,
Chrome DevTools - Session tools: Hotjar, FullStory, or similar for recordings
- Crawling: Screaming Frog, Sitebulb, or a headless crawler
- A/B testing: Optimizely, Google alternative, or server-side flags
- Gather baseline analytics and search performance: Collect organic landing pages, bounce/engagement metrics, and top queries. Identify pages with high impressions but low CTR and short dwell time.
- Crawl site to find UX/technical issues: Crawl the entire site to identify broken links, duplicate titles, missing meta descriptions, and orphaned pages. Flag pages with heavy DOM sizes or many synchronous scripts.
- Run Core Web Vitals and performance tests: Measure
Largest Contentful Paint,First Input Delay, andCumulative Layout Shiftacross device types. Catalog pages failing thresholds and note contributing resources. - Perform qualitative research (session recordings, user testing): Watch representative sessions, run short 5–7 task usability tests, and collect user pain points around findability and conversion flows.
- Audit content structure and on-page UX: Check headings, scannability, CTA clarity, and image alt text. Ensure content matches search intent and provides clear next steps.
- Prioritize issues with impact vs. effort: Map each finding to expected SEO signal improvements and engineering effort. Use the prioritization matrix below to decide what to fix first.
- Create an implementation and A/B testing plan: Define hypotheses, metrics, test durations, and rollout criteria. Use staged rollouts and measure both SEO signals and engagement KPIs.
Prioritization matrix comparing impact vs. effort for common UX fixes
Table: Step-by-step UX Audit to Improve SEO — Issue, SEO Signal Impact, Effort (Low/Medium/High) & more
| Issue | SEO Signal Impact | Effort (Low/Medium/High) | Estimated Time to Fix |
|---|---|---|---|
| Improve LCP ( images / server) | Improves Largest Contentful Paint, ranking risk reduced | Medium | 1-3 days |
| Reduce CLS (stabilize layout/ads) | Cuts Cumulative Layout Shift, better UX signals | Low | 1-2 days |
| Fix mobile navigation/UX | Higher mobile engagement, lower bounce | Medium | 3-7 days |
| Improve content scannability (headings, bullets) | Better dwell time and CTR | Low | 1-4 days |
| Reduce intrusive interstitials | Removes search penalties, improves CTR | Low | 1-2 days |
Key insight: Focus first on fixes that move Core Web Vitals and mobile usability because they directly affect both user engagement and search signals. Tackle low-effort, high-impact items immediately and bundle bigger engineering changes into prioritized sprints. Consider automating content workflow and experiment scheduling with tools like Scaleblogger.com to speed implementation and measure SEO lift.
A pragmatic audit that pairs quantitative signals with quick qualitative checks produces fixes you can validate fast and iterate on. That’s how UX work turns into measurable SEO wins.
Implement UX Changes That Move the SEO Needle
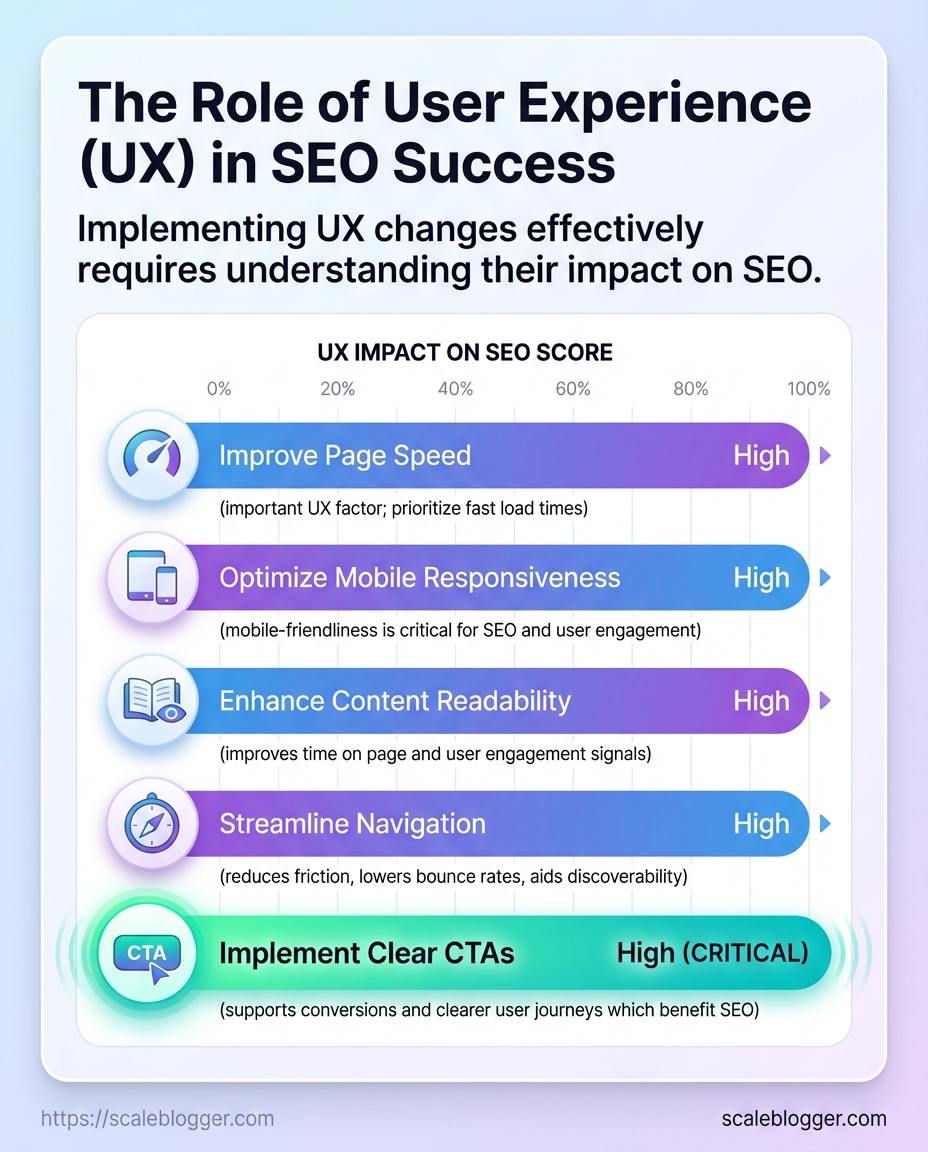
Start by focusing on a few surgical UX improvements that directly affect crawlability, engagement, and page performance. Faster pages keep users on the site longer, reduce bounce, and give search engines clearer signals that your content satisfies intent. Practical wins sit at the intersection of frontend tweaks and content structure: image optimization, smart loading, CSS strategy, clearer mobile navigation, and stronger internal linking.
Site audit: Run a performance and UX audit with Lighthouse, WebPageTest, or your preferred tools to capture baseline metrics (LCP, FID/INP, CLS).
Access: Ability to edit HTML templates, CDN settings, and server headers.
Tools & materials
Image tools: sharp, ImageMagick, or web-based compressors. Build tooling: Webpack, Vite, or your static site generator. CDN & caching: Cloudflare, Fastly, or your hosting provider.
Content tooling: An internal linking map or content inventory.
Practical fixes and deployment steps
- images — run a bulk conversion and compression pipeline.
- Export master images as WebP/AVIF where supported and keep
JPEG/PNGfallbacks. - Generate responsive
srcsetsizes for each image and include width descriptors. - Automate compression in CI so images are optimized before deploy.
- Implement lazy loading and proper caching headers.
- Add
loading="lazy"for non-critical images andfetchpriority="high"for hero images. - Set
Cache-Controlwith long max-age for static assets and usestale-while-revalidatefor smooth updates. - Push immutable assets through a CDN and version filenames for cache busting.
- Inline critical CSS and defer non-critical CSS.
- Extract above-the-fold styles into a small inline
Key Takeaway: Begin with a clear, testable hypothesis related to an SEO signal: changing title tag length can improve organic click-through rate (CTR) for mid-funnel pages. Design the experiment to isolate that variable, measure search-specific metrics…
Measure, Test, and Iterate (A/B and Observational Testing)
Begin with a clear, testable hypothesis related to an SEO signal: changing title tag length can improve organic click-through rate (CTR) for mid-funnel pages. Design the experiment to isolate that variable, measure search-specific metrics separately, and give the test enough time and sample to reach statistical confidence.
Testable hypothesis: A short, action-oriented title will increase organic_click_through_rate by X% versus control.
Measurement plan: Define primary metric (e.g., organic CTR), secondary metrics (ranking movement, impressions, dwell time), and which pages are in-scope.
Sampling rule: Only include pages with steady traffic (minimum weekly sessions threshold) and similar intent.
Step-by-step process for an SEO A/B test
- Pick treatment and control pages and ensure parity in intent and historical traffic.
- Implement treatment on a subset using server-side experiments, tag management, or
canonical/noindex safeguards for variant pages.
- Warm up traffic for 1–2 weeks so Google sees the change before measurement.
- Collect data for the agreed duration (see timeline table below).
- Analyze search landing page metrics separately from site-wide analytics.
- Roll out, rollback, or iterate based on Go/No-Go criteria.
Key signals to track during tests:
- Organic CTR: Primary conversion proxy for SERP appeal.
- Search impressions & queries: Shows exposure and query shifts.
- Ranking positions: Detect short-term volatility vs sustained lift.
- Engagement metrics: Bounce/dwell time for quality checks.
- Conversion rate on landing pages: Ensures CTR lifts are valuable.
Observational testing techniques
Use log analysis, SERP-snapshot monitoring, and session recordings to interpret user behavior when A/B tests aren’t feasible. Observational data helps form hypotheses and identify micro-experiments (e.g., tweak H1s, structured data, or meta descriptions).
Recommended experiment timeline and checkpoints
Table: Measure, Test, and Iterate (A/B and Observational Testing) — Phase, Duration, Activities & more
| Phase | Duration | Activities | Go/No-Go Criteria |
|---|---|---|---|
| Setup | 1 week | Select pages, define metrics, implement tracking | Tracking verified; baseline metrics recorded |
| Traffic warm-up | 1–2 weeks | Serve treatment to segment; verify indexing behavior | SERP shows variant; no crawl errors |
| Data collection | 4–8 weeks | Aggregate organic metrics, collect query data | Minimum sample size reached; stable traffic patterns |
| Analysis and roll-out | 1 week | Statistical test, inspect secondary metrics | Stat sig on primary metric and no negative secondary impact |
| Monitoring post-rollout | 4 weeks | Watch for ranking drift and downstream effects | Sustained improvement or rollback flagged |
Key insight: Running SEO A/B tests requires patience and focus on search-specific metrics; short experiments can mislead because rankings and crawl cycles introduce lag. Use observational methods to broaden hypotheses and tools like AI-powered SEO tools to automate measurement and content scoring.
Running disciplined experiments separates guesswork from growth — treat each test as a learning loop and iterate until the signal is clear.
Key Takeaway: If your Core Web Vitals, traffic, or accessibility metrics won’t budge, the issue often lies in a hidden bottleneck—not the main fix you just tried. Start by isolating symptoms, reproduce them on a clean environment, and then iterate fixes in small,…
Troubleshooting Common Issues
If your Core Web Vitals, traffic, or accessibility metrics won’t budge, the issue often lies in a hidden bottleneck—not the main fix you just tried. Start by isolating symptoms, reproduce them on a clean environment, and then iterate fixes in small, measurable steps. Below are focused diagnostics and fixes for the problems that most commonly linger after an optimization push.
Diagnosing slow Core Web Vitals after apparent fixes
- First check: Run Lighthouse and WebPageTest to compare raw render timelines.
- Likely cause: Largest Contentful Paint (LCP) still blocked by render‑blocking CSS/JS or slow server response.
- Fixes to try:
- Identify the LCP element in the waterfall, then defer or inline only the critical CSS that affects that element.
- Move noncritical scripts to
deferorasync; where possible, split bundles and use dynamic imports. - Audit server response time; enable CDN caching, and implement
cache-controlheaders.
Recovering organic traffic after a UX rollout
- First check: Compare pages with traffic drops to control pages using Google Search Console and analytics.
- Likely cause: Changed headings/URL structure, removed semantic content, or slower load times hurting rankings.
- Fixes to try:
- Reintroduce lost semantic headings or content blocks that contained keyword context.
- Restore URLs or add precise 301s; update internal links and sitemap.
- If UX changes added client-side rendering, ensure server-side rendered crawlable content or pre-render critical HTML.
Key Takeaway: Integrate monitoring and documentation into your regular content process; optimization needs to be ongoing, not just a one-time effort. Automate performance and UX checks, reduce layout shifts with reusable UI components, and prioritize attention to…
Tips for Success and Pro Tips
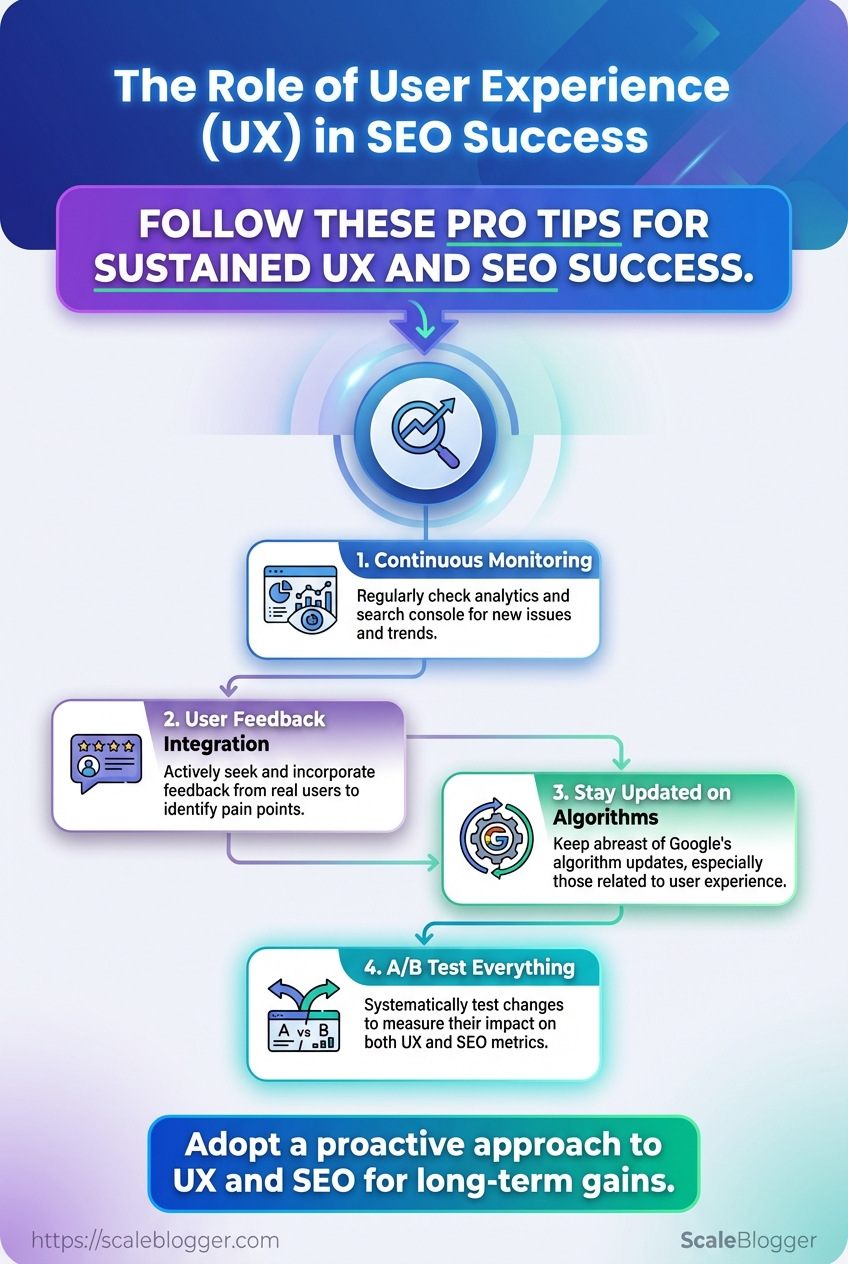
Integrate monitoring and documentation into your regular content process; optimization needs to be ongoing, not just a one-time effort. Automate performance and UX checks, reduce layout shifts with reusable UI components, and prioritize attention to pages that move the needle for organic traffic and conversions. Document every UX change alongside an SEO hypothesis so experiments produce learnable signals instead of noise.
Use automation to keep the signal steady
- Automate Lighthouse audits: Schedule
Lighthouseruns on CI for critical pages and fail builds on regressions. - Set up real-user monitoring: Capture field
Core Web Vitalsvia RUM and alert on sustained regressions. - Integrate session replay sampling: Use session replays selectively for high-value funnels to diagnose UX problems quickly.
Reduce CLS with component libraries
- Standardize visual components: A shared component library enforces fixed image dimensions and reserved space for ads/embeds.
- Lazy-load responsibly: Use attribute
loading="lazy"but reserve dimensions to prevent layout jumps. - Preload critical assets: Preload fonts and hero images to avoid layout reflows.
Prioritize pages by impact
- Identify the top pages by organic sessions and conversion rate.
- Rank them by combined traffic × conversion potential. 3. Apply performance and UX changes first to the top 10% of pages, measure lift, then roll out patterns.
Make documentation and hypotheses non-negotiable
- Change log: Record the change, date, and owners for each UX tweak.
- SEO hypothesis: Link expected ranking or CTR outcome to the change and define the measurement window.
- Result snapshot: Store before/after Lighthouse and traffic screenshots for audits.
Practical monitoring checklist
Checklist of ongoing monitoring tasks and which tools support them
Table: Tips for Success and Pro Tips — Monitoring Task, Recommended Tool, Frequency & more
| Monitoring Task | Recommended Tool | Frequency | Owner |
|---|---|---|---|
| Core Web Vitals monitoring | Google PageSpeed Insights / Lighthouse CI | Daily automated checks | Frontend Engineer |
| Session replay sampling | FullStory (Free tier available / paid plans) | Weekly sampling for funnels | Product Designer |
| Content freshness checks | Semrush / Ahrefs (content audit tools) | Monthly | Content Strategist |
| Accessibility audits | Axe-core (CI) + Lighthouse | On every release | QA / Accessibility Lead |
| A/B test tracking | Optimizely / Google | Continuous during experiments | Growth/Product Manager |
Key insight: Automate baseline checks with Lighthouse and RUM, pair session replays with prioritized pages, and keep content freshness and accessibility on a monthly cadence so SEO ranking factors and UX improvements stay aligned.
For teams ready to scale, plug these workflows into an automated content pipeline — tools like Scaleblogger.com can help orchestrate content scheduling and performance benchmarking so optimizations become repeatable rather than ad hoc. Keep the focus on measurable wins and let the documentation build institutional memory that speeds future improvements.
Measuring Success: Metrics and Reporting
Start by tracking a small set of reliable KPIs and building a repeatable report that answers: is content driving discoverability, engagement, and business outcomes? Use page-level baselines, then measure change over time and by experiment. Visualize trends and test attribution at the landing-page level so answers don’t hide behind aggregate noise.
Primary KPIs: Organic traffic, CTR, ranking improvements, Core Web Vitals
Secondary KPIs: Session duration, pages per session, conversion rate
Reporting template (what to include)
- Executive snapshot — one-line verdict and the three metrics that matter this month.
- Traffic trend — 90-day time-series for organic sessions and
new users. - Ranking movement — top 50 target keywords showing delta in positions.
- Page-level performance — table of landing pages with organic clicks, CTR, avg. position,
LCPandCLS. - Engagement & conversions — sessions, pages/session, goal completions, micro-conversions.
- Experiment log — A/B tests or content experiments with hypothesis, variant, and outcome.
- Action items — prioritized list: what to repeat, what to fix, and resourcing needs.
- Clear metric focus: Keep the dashboard to 6–8 widgets so attention doesn’t scatter.
- Page-first approach: Evaluate each landing page as its own experiment, not just site-level aggregates.
- Automate reporting: Export CSVs or use an automation pipeline to refresh the report weekly.
Visualization suggestions
- Time-series comparisons: plot organic sessions, CTR, and avg. position on aligned axes to show cause-effect over time.
- Scatterplots: page-level CTR vs. avg. position to find high-impression pages with low CTR.
- Heatmaps: quickly surface Core Web Vitals outliers across URLs.
Attribution guidance (practical steps)
- Segment traffic by landing page before applying channel-level attributions.
- Run lightweight landing-page experiments (headline, meta, internal links) and track lift in organic clicks and conversions.
- Use cohort windows (30/60/90 days) to separate seasonal shifts from experiment impact.
Practical tools can automate the heavy lifting — for example, integrate query and page data into a reporting pipeline or adopt Conclusion This site-redesign story—where pages rose in search results but clicks vanished—highlights why focusing on user experience is as crucial as traditional SEO ranking factors. Improve navigation, speed up interactions, and simplify content layout, and you stop pretending traffic equals success. Measure with task completion, bounce by intent, and conversion funnels; run small A/B tests so you learn which UI changes actually move metrics. If you’re wondering how quickly to implement changes, kick off short experiments (2–4 weeks) on high-traffic pages. To measure effectively, combine quantitative data with brief observational sessions to uncover surprises that users might not communicate. Focus on three practical moves: fix slow micro-interactions first, clarify top-of-page content so intent matches query, and use iterative testing to validate SEO-focused UX changes. According to recent research, one team reportedly regained approximately 30% engaged sessions after simplifying headers and reducing CTAs; another caught a navigation drop-off through a heatmap before it harmed rankings. com) can automate audits, prioritize fixes, and free the team to run smarter experiments. Take one page, apply these steps, and test — that single win will make the rest of the work feel less hypothetical and a lot more worth it.
