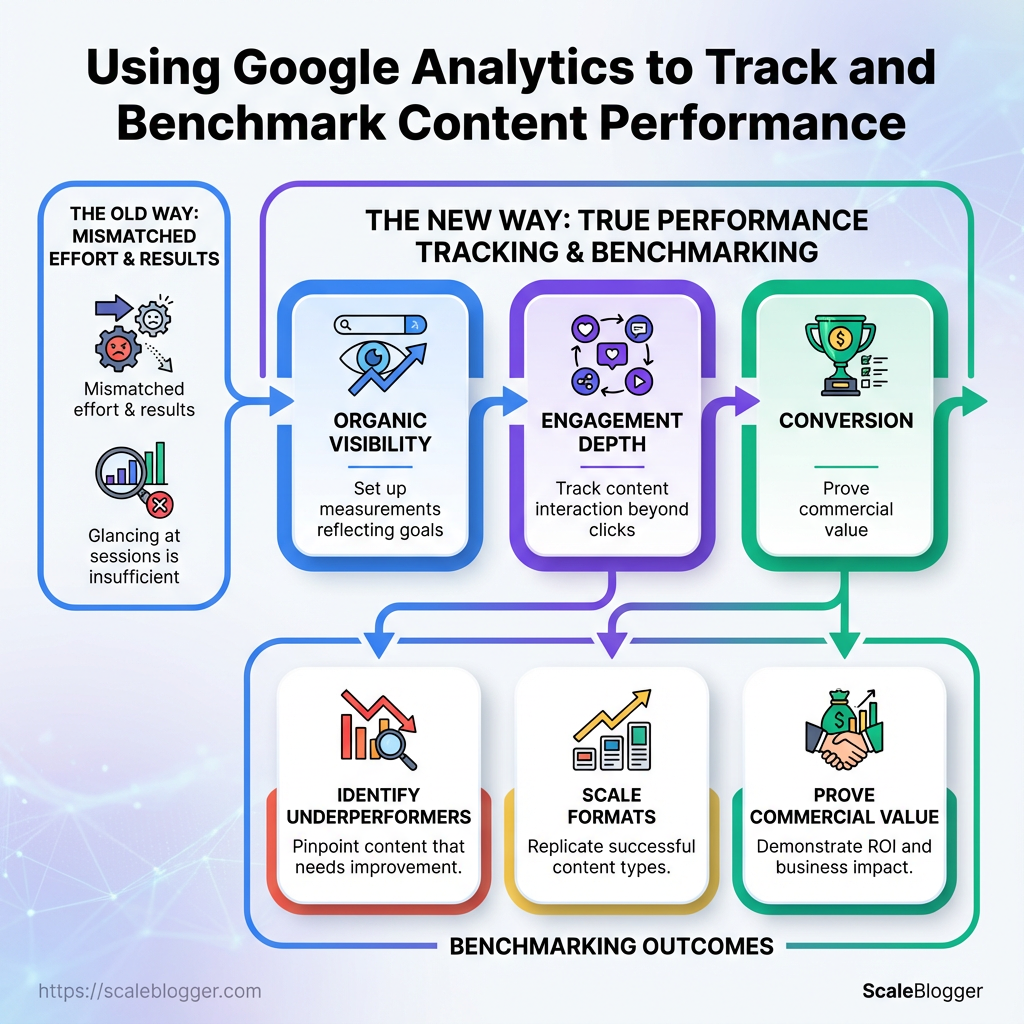
Your content calendar looks healthy on paper, but some posts never escape page two of search results and others bring traffic that bounces within seconds. That mismatch between effort and results is maddening, and it usually comes down to not measuring the right signals with the right lens.
Using Google Analytics the way many teams do—glancing at sessions and hoping—won’t show which topics actually move business metrics or how pieces compare against each other over time. True performance tracking ties organic visibility, engagement depth, and conversion behavior into a single story, so content decisions become evidence-driven instead of opinion-driven.
Benchmarking content with the right tools turns guesswork into repeatable wins: spot underperformers that deserve rewrites, identify formats that scale, and prove which keywords deliver commercial value. The trick is setting up measurements that reflect your goals and comparing apples to apples across articles, channels, and time.
What You’ll Need (Prerequisites)
Start here: make sure measurement and content are already aligned before you touch automation. If Google Analytics isn’t collecting reliable page-level data, any downstream AI-driven content decisions will be guesses. The practical baseline is simple — a GA4 property with Editor rights, verified tagging on the site, a current content inventory, and a baseline for performance so you can judge lift. Optional competitive tools help, but they’re not required to get meaningful wins.
Google Analytics 4 property: You need an active GA4 property with Editor access so you can create audiences, link to Search Console, and configure conversions.
Website tagging verification: Confirm that the site has consistent page-level tagging (either gtag.js, Google Tag Manager, or server-side tagging). A working G- or GA4 measurement ID visible on relevant pages is the minimum sanity check.
Content inventory: List of live pages, primary keyword/topic, publish date, last update, and current monthly traffic or impressions.
Internal KPI baseline: Clear, measurable KPIs (e.g., organic sessions, conversions per page, average time on page) captured over the last 90 days to compare before/after impact.
Benchmarking tools (optional): Tools like Ahrefs or SEMrush accelerate idea discovery and competitive gap analysis but aren’t mandatory. Use them if you want faster keyword surface area and backlink context.
Quick verification steps to run before any automation:
- Log into GA4 and confirm property ID and user role.
- Load a representative page, view source, and check for the tag (look for
G-ormeasurementId). - Pull a 90-day performance export for your content list (pages → sessions → conversions).
Practical tips while assembling prerequisites: run a single page through the whole stack first — tagging check, GA4 event firing, and content metadata completeness — to surface edge cases like tag duplicates or redirect chains. If internal bandwidth is tight, outsourcing the tagging verification or using a SaaS QA tool saves days of troubleshooting.
For teams using automated content pipelines, Scale your content workflow can plug into this stack to jumpstart publishing and benchmarking. Get these pieces in place and the rest — topic modelling, automation, measurement — becomes a lot more deterministic.
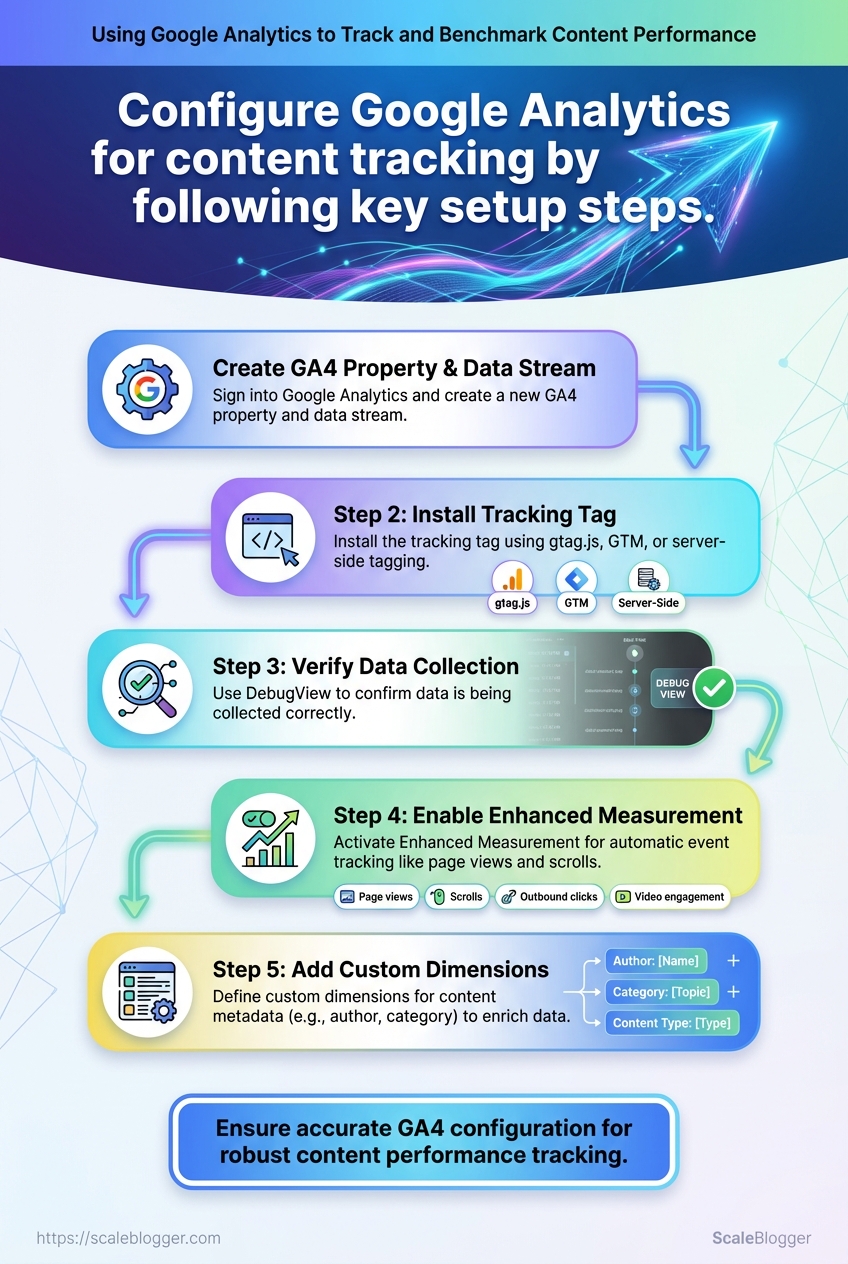
Step-by-Step Setup: Configure Google Analytics for Content Tracking
Start by creating a GA4 property and a data stream, then install the tracking tag in the method that fits your stack. Verifying data collection with DebugView, enabling Enhanced Measurement, and adding custom dimensions for content metadata unlock content-level insights. Optional integrations (Search Console, Tag Manager, server-side tagging) make benchmarking and attribution far more reliable.
Google account: Needed to create properties and link services.
Editor access to site: Ability to edit site header, install plugins, or modify server tagging.
Tools & materials
Browser: Chrome with Tag Assistant and GA Debugger.
Optional: Google Tag Manager account, CMS plugin credentials.
- Create a GA4 property and data stream
- Sign into Google Analytics, create a new GA4 property, and add a Web data stream for your site URL.
- Copy the
Measurement ID(looks likeG-XXXXXXXXXX). - Install the tag
- Choose an installation method (see table below) and add either the
gtag.jssnippet or install via Google Tag Manager / CMS plugin. - If using GTM, create a GA4 Configuration tag, paste the
Measurement ID, and publish the container. - Verify collection with DebugView
- Open GA4 > Configure > DebugView and enable debug mode in your browser (using GA Debugger or GTM preview).
- Trigger page views and content events; confirm events appear within seconds in DebugView.
- Enable Enhanced Measurement and set content events
- In the Web data stream settings, toggle Enhanced Measurement to capture page views, scrolls, outbound clicks, and file downloads.
- For content tracking, ensure automatic
page_viewis active and customize event parameters if necessary. - Create custom dimensions
- In GA4 Admin under Property > Custom definitions, add custom dimensions like
Content Type,Author,Topic Clusterwith scope set toEvent. - Push these values via
gtag('event', ...)or through GTM by mapping metadata from the page. - Optional integrations for richer benchmarking
- Link Search Console for query-level insights, connect BigQuery for raw export, and consider server-side tagging for better data control.
Tagging installation options (GTM vs gtag.js vs CMS plugin)
| Installation Method | Difficulty | Pros | Cons |
|---|---|---|---|
| Google Tag Manager | Medium | Flexible, central control, easy event updates | Extra layer, learning curve |
| gtag.js | Low | Simple, direct, minimal dependencies | Harder to manage many events |
| CMS Plugin (WordPress GA plugin) | Low | Quick setup, UI for config | Plugin limits, less flexible |
| Server-side Tagging | High | Improved data control, privacy-friendly | Requires server infra, cost |
| Tagging via CDN snippet | Low | Fast deployment, no plugin | Caching issues, less control |
Key insight: GTM is the most flexible for scaling event schemas; gtag.js suits simple sites; server-side tagging helps when you need privacy/compliance control.
Linking GA4 to Search Console and exporting to BigQuery pays dividends for content benchmarking. If automating content pipelines, integrating these data feeds with tools like Scaleblogger.com speeds up performance-driven publishing and measurement. Getting the tagging right now saves a lot of messy data work later.
Identify and Define Key Content Metrics
Start by choosing a small set of metrics that directly map to what the content must accomplish. Pick metrics that are measurable in your analytics stack (Google Analytics or your preferred performance tracking tool), meaningful to stakeholders, and repeatable across campaigns. Keep the list tight: five or fewer primary metrics, three to five secondary signals.
Engaged sessions: Sessions where a user spent meaningful time or interacted (scroll, video play, multiple page views) — useful for judging content resonance.
Engagement rate: Percentage of sessions that meet your engagement threshold (time on page, scroll depth, events) — helps normalize performance across traffic sources.
Conversions: Specific goal completions tied to content (email signups, demo requests, purchases) — maps content directly to business impact.
Organic visibility: Share of organic sessions or keyword rankings that content contributes to — shows SEO lift and discoverability.
Retention / return visits: Rate of users returning within X days — indicates whether content builds ongoing audience value.
Map metrics to goals before launching anything.
Mapping example: Awareness goal: Primary metric — organic visibility. Secondary — engaged sessions. Lead-gen goal: Primary metric — conversions. Secondary — engagement rate. * Retention goal: Primary metric — return visits. Secondary — time on site.
Derive baselines with a short, repeatable process.
- Pull the last 90 days of data for comparable content types from your analytics platform.
- Calculate the median and 75th-percentile performance for each metric to avoid outliers skewing expectations.
- Normalize by traffic source (organic, paid, social) so benchmarks reflect realistic acquisition mixes.
- Set rolling benchmarks (e.g., 90-day moving baseline) rather than static numbers.
When documenting benchmarks, make them actionable and versioned.
Document format: Keep a single spreadsheet or dashboard row per content type with metrics, baseline, source, and date. Versioning: Add a baseline_date and notes field so teams know when to re-evaluate. Acceptance criteria: Attach a pass/fail rule like conversion_rate >= baseline 1.2 for experiments.
Practical example: For a how-to blog post, the baseline shows median engaged sessions = 420 and conversion rate = 0.8%. The experiment sets a 25% uplift target for engaged sessions and a 0.1% absolute lift for conversions.
Tools and next steps: use Google Analytics for raw data, a BI dashboard for visualization, and consider automating benchmarks with an AI pipeline. For teams ready to scale measurement, Scaleblogger.com can help automate benchmarking and content scoring.
Picking clear, mapped metrics and documenting baselines turns vague goals into measurable experiments that actually move the business needle.
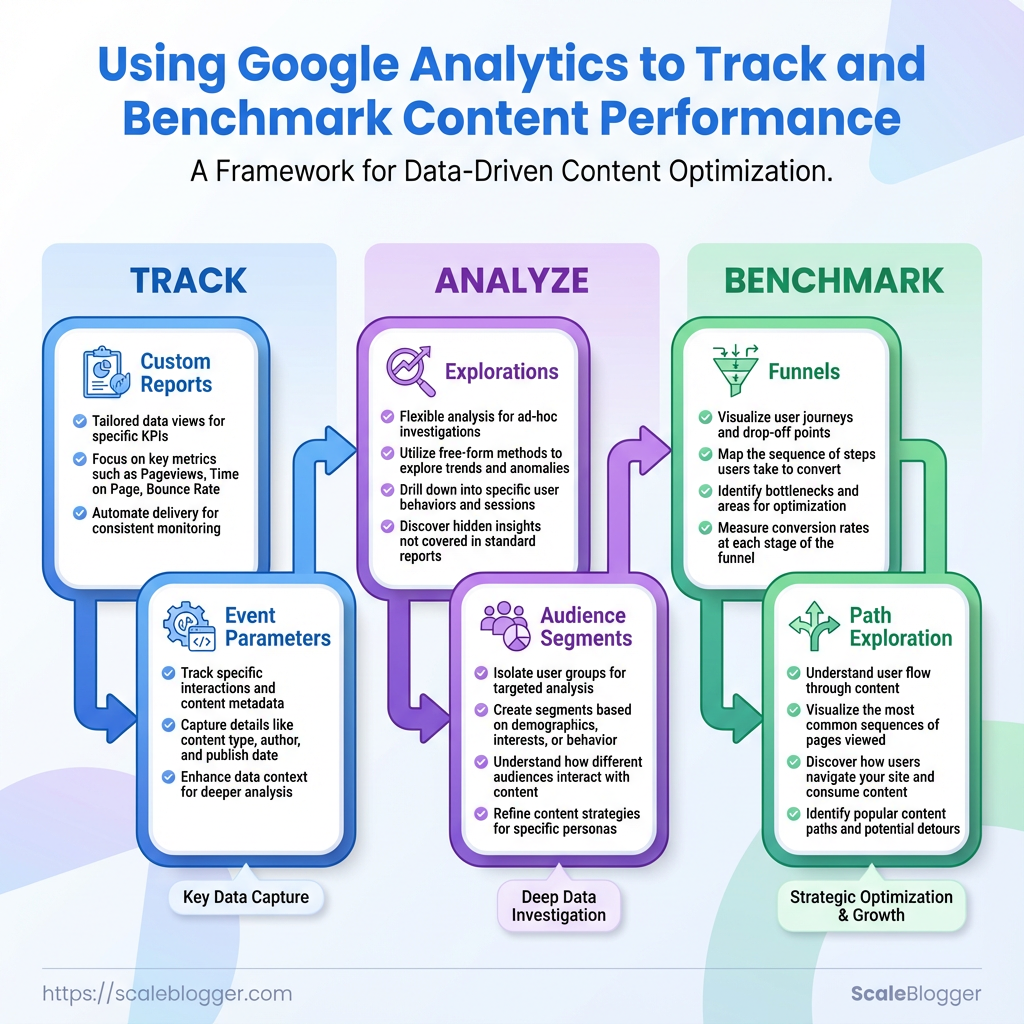
Create Custom Reports and Explorations for Content Benchmarking
Start by designing explorations that answer the question you actually need: how does a piece of content perform versus expected benchmarks and competitors? Build dashboards that let you slice by content type, intent, and acquisition channel so comparisons are immediate — not something you cobble together from spreadsheets.
Prerequisites
Google Analytics: Properly configured GA4 properties with events and conversions mapped.
Content taxonomy: Consistent content types, topic tags, and target intent stored in your CMS.
Baseline benchmarks: Internal historical averages or industry benchmarks for metrics like Pageviews, Avg. Engaged Time, and Conversion Rate.
Tools & materials
- Metric store: GA4 or your BI tool (Looker Studio, BigQuery).
- Connector: Automated export from CMS to analytics (or
CSVpipeline). - Dashboard tool: Looker Studio, Data Studio, or your BI of choice.
- Optional service: Scaleblogger.com for automated content pipelines and performance scoring.
What to include in an Exploration
* Dimensions: Content ID: unique page slug. Publish Date: when content went live. Topic Cluster: assigned pillar/topic. Acquisition Channel: organic, social, email.
* Metrics: Sessions / Pageviews: traffic volume. Avg. Engaged Time: meaningful engagement. Scroll Depth %: content consumption proxy. Conversion Rate: goal completions per session. Clicks from SERP / CTR: search effectiveness.
Step-by-step: build a comparative exploration
- Create a new exploration and add the content ID and topic cluster dimensions.
- Add metrics:
Pageviews,Avg. Engaged Time,CTR,Conversions. - Apply filters for channel and publish date range.
- Add a calculated field: benchmark variance = (
Metric–Benchmark) /Benchmark. - Visualize as a table with sparklines and a bar chart for variance by topic cluster.
- Save as a dashboard card and add a date-range selector for on-the-fly comparisons.
Exporting and sharing
* Export strategies: PDF snapshots: for leadership reports. CSV exports: for analysts who want row-level data. Live links: share dashboard URLs with viewer permissions.
Naming convention: Use YYYYMMDD_Project_ExplorationName_v1 for versioning and clarity.
Sharing settings: Give team members view access; restrict edit to owners to prevent accidental changes.
Creating repeatable explorations turns benchmarking from ad-hoc guesswork into a system: pick the right dimensions, automate exports, and name things predictably so insights scale across teams.
Benchmarking: Compare Performance Over Time and Against Competitors
Start by aligning internal trends with external context so performance signals become actionable instead of noisy. Normalizing historical data, choosing the right external benchmarks, and translating deviations into specific actions separate guesses from high-confidence decisions.
Normalize historical data before benchmarking
Normalization: Adjust historical metrics for traffic growth, seasonality, and changes in measurement (for example, GA4 event changes) so each period is comparable.
Baseline period: Use at least 90 days for steady-state topics and 12 months when seasonality matters.
Internal and external benchmarking steps
- Collect clean internal data from GA4 and your CMS.
- Normalize for traffic volume: divide metric by sessions or pageviews to get per-session/per-article rates.
- Adjust for seasonality: compare like-for-like (e.g., Q4 → last Q4) or use rolling 90-day averages.
- Pull industry benchmarks from tools (Ahrefs, SEMrush, SimilarWeb) for your category and content type.
- Compare normalized internal metrics to industry ranges and calculate deviation.
- Prioritize actions based on deviation magnitude and business impact.
When an external benchmark is meaningful
- Use external benchmarks when market context matters (adoption, search demand, category growth).
- Avoid direct comparisons when your audience, intent, or distribution channel differs substantially from the benchmark cohort.
Interpreting deviation from benchmark
- Small positive deviation (<10%) — monitor and replicate what’s working.
- Moderate negative deviation (10–30%) — diagnose content quality, on-page SEO, and traffic sources.
- Large negative deviation (>30%) — treat as high-priority: run content audits, A/B test titles/meta, and re-optimize targeting.
Actions based on benchmarking insights
- If CTR lags: refresh titles and meta descriptions, test schema, and review SERP features.
- If engagement time falls: add scannable structure, multimedia, and clearer next steps.
- If conversions underperform: tighten intent match, simplify form friction, and test stronger CTAs.
Internal content performance vs. industry benchmarks for quick triage
| Metric | Internal Baseline | Industry Benchmark | % Difference | Recommended Action |
|---|---|---|---|---|
| Sessions per article | 1,200 | 1,800 | -33% | Refresh top pages; update promotion cadence |
| Engagement time (sec) | 95s | 140s | -32% | Improve headings, add visuals, restructure content |
| Conversion rate (lead form) | 0.9% | 1.8% | -50% | Shorten form, add intent-aligned CTAs, heatmap test |
| Organic CTR | 2.8% | 4.5% | -38% | Rework title tags/meta, test schema snippets |
| Bounce/Exit rate | 62% | 45% | +38% | Improve internal linking, add related content widgets |
Key insight: These comparisons quickly highlight where content fixes will likely move the needle—CTR and conversions show biggest relative gaps, so prioritize title/meta tests and funnel simplification first.
Using automation and a repeatable pipeline makes this work scalable. Tools can surface the biggest deviations each week and feed prioritized tasks into an editorial workflow—Scaleblogger.com is one example of an AI-powered approach that automates benchmarking and content triage. Benchmarks are only useful when they lead to experiments and measurable improvements, so tie each insight to a clear test and timeline.
Run Experiments and Optimization Based on Analytics
Start experiments where data shows the largest opportunity. Prioritize pages that drive meaningful traffic or conversions, design small, measurable tests, and treat every test as a learning step toward a predictable content engine.
Traffic threshold: At least 500 monthly sessions per page (lower if conversion-rate impact is high). Baseline metrics: Current conversion rate, bounce rate, average time on page, and organic impressions. Tools & materials: Google Analytics for performance tracking, a/B testing platform (or CMS split tests), and a simple experiment log (spreadsheet or tracking tool).
How to prioritize pages for testing High-impact pages: Pages with high impressions but low CTR. Conversion bottlenecks: Pages with decent traffic but poor goal completions. * Content decay pages: Previously high-rank pages losing clicks or rankings.
Experiment design basics and metrics 1. Define a single hypothesis per test. 2. Choose one primary metric (e.g., click-through rate or form submissions) and one guardrail metric (e.g., organic sessions). 3. Create variant(s) that change only the element tied to the hypothesis — headline, meta description, intro paragraph, CTA, or internal links. 4. Run the experiment for a minimum duration that covers traffic seasonality (commonly 2–4 weeks) and reaches statistical significance.
Measurement and statistical considerations Minimum sample size: Ensure each variant has enough visitors and events to be trustworthy; small changes need larger samples. Statistical significance: Use a/b test calculators or the testing tool’s built-in stats; consider practical significance, not just p-values. Segment analysis: Check results by channel, device, and landing query to avoid mistaken generalizations. Avoid peeking bias: Don’t stop tests early because an early winner appears; let them run to the planned sample size.
Documentation and rollout process 1. Record experiment details: hypothesis, variants, start/end dates, sample sizes, and metrics. 2. Validate results with a secondary check (double-check GA events and raw logs). 3. If positive, roll out incrementally and monitor for downstream effects. 4. If negative, capture learnings and archive the test with why it failed.
Example: Change a headline on a product guide that has 2,000 monthly sessions and 0.8% CTR, run two headline variants for 3 weeks, measure organic CTR and engagement, then roll out the winner site-wide.
For automating and scaling these tests, consider using an AI content pipeline to generate variant copy and a content benchmarking tool to track uplift. Scale your content workflow integrates automation and performance tracking to keep experiments moving without manual bottlenecks.
Running disciplined, data-driven experiments turns guesswork into repeatable gains and helps prioritize the next wave of optimizations.
Troubleshooting Common Issues
Start by looking where data first appears: the tag layer and network calls. When metrics look wrong, the problem is almost always one of four things — missing collection, broken tagging, UTM confusion, or duplicated/misaligned content IDs. Confirming the collection path quickly narrows the fix and saves hours chasing downstream reports.
Verify data collection (quick checks and step-by-step)
- Open the page and enable your browser devtools (Network tab) and the
Preserve logoption. - Reload the page and filter requests for
collect,gtm.js,g/collect, or your analytics endpoint. - Confirm the payload contains the expected
page_title,page_location, orclient_id. - Use tag debugger tools (GTM Preview, GA4 DebugView) to validate event firing.
If no network call appears, check for blocked scripts (ad-blockers, CSP) or missing snippet placement. If the call exists but fields are empty, the tagging layer or dataLayer variable mapping is the usual culprit.
Common tagging and UTM mistakes
- Misplaced snippet: Analytics script placed after heavy async scripts delays or drops pageview events.
- Conflicting tags: Multiple tracking IDs on the same page overwrite
client_idand fragment session attribution. - Broken UTM use: Using internal campaign links with
utm_params creates self-referrals; prefergclidor internal query flags for internal campaigns. - Case inconsistency:
utm_Source=Emailvsutm_source=emailfragments reports and multiplies channels.
Fixes for duplicate or missing content data
- Duplicate pageviews: Ensure only one pageview trigger runs; remove automatic pageview when firing manual virtual pageviews.
- Missing content metrics: For SPA (single-page apps), push a
page_viewevent on route change and pass the correctpage_pathandpage_title. - Duplicate content IDs: Normalize content IDs server-side so
content_idis consistent across canonical and parameterized URLs.
GTM: Google Tag Manager, the tag deployment layer.
UTM parameters: Query-string tags used for campaign attribution.
GA4: Google Analytics 4 property and event model.
When to escalate
- If network calls are correct but data is still wrong, escalate to engineering.
- If tag templates behave inconsistently across environments, get GTM support to inspect workspaces and versions.
- If attribution logic spans back-end redirects or server-side tracking, coordinate with backend engineers to sync
client_idoruser_id.
Practical tools to recommend: GTM Preview, GA4 DebugView, browser devtools, and server logs. For larger teams, automating checks with a content monitoring script saves repeated fixes.
Getting the collection path right stops the noise in reports and makes content benchmarking actually useful — fix the tags first, then trust the numbers.
📥 Download: Google Analytics Content Performance Tracking Checklist (PDF)
Tips for Success and Pro Tips
Start with a reliable data foundation: consistent naming, disciplined UTM usage, and an automated reporting cadence. Clean inputs make every downstream decision faster and less risky — messy source data creates misattribution, wasted promotion spend, and stakeholder confusion. Practically, enforce a single UTM scheme, standardize content taxonomy (topic → pillar → format), and push raw event exports into a central warehouse so analysts can rerun queries instead of patching dashboards. That upfront discipline saves hours each quarter and makes A/B testing and content benchmarking predictable. Use lightweight automations to push daily health checks (missing UTMs, duplicate content IDs) and weekly performance snapshots to stakeholders so attention lands where it moves metrics.
Data hygiene and naming conventions
Naming convention: Use a short, repeatable pattern: topic_pillar_format_date for internal IDs.
UTM discipline: Lock utm_campaign, utm_medium, and utm_source values in a shared spreadsheet and enforce them at publish time.
- Regular audits: Run a weekly check for untagged landing pages and correct immediately.
- Canonical mapping: Map legacy slugs to canonical content IDs to avoid split metrics.
- Version control: Store content metadata in a CSV/BigQuery table, not a dozen Google Docs.
Reporting cadence and automation
- Define reporting frequencies: daily health, weekly highlights, monthly deep-dive.
- Automate exports: push raw analytics to BigQuery or a similar warehouse nightly.
- Generate stakeholder-ready PDFs or slide decks from templated Looker Studio or Tableau reports.
- Daily health: top 10 pages by traffic, failed events, and UTM anomalies.
- Weekly highlights: pages gaining traction, conversion lift, and experiments running.
- Monthly deep-dive: cohort retention, content benchmarking, and ROI by promotion channel.
Stakeholder-ready visualizations
- Bold labels: Use clear, action-focused titles (e.g., “Top 5 pages to double down on this week”).
- Use annotations: Explain spikes and dips directly on charts.
- One-chart ask: Every dashboard should answer one question for a non-analyst.
Advanced pro tips
- BigQuery workflows: Store raw hits and compute derived metrics there; then surface aggregated tables to dashboards for fast querying.
- Server-side tagging: Reduce data loss and policy issues by moving critical event capture to server-side collection.
- Content scoring framework: Combine traffic, engagement, and conversion into a single score for prioritization.
For teams ready to scale, adopt an AI-powered content pipeline to automate tagging, scheduling, and performance alerts — it reduces operational overhead and keeps your content strategy move-fast-safe. Small discipline up front means decisions become faster and less political down the road.
Appendix: Templates, Checklists, and Example Reports
This appendix contains ready-to-use templates and checklists that make setting up a repeatable content process fast. Each resource is built so content teams can import, customize, share, and start measuring performance with minimal friction. Below are what each file contains and how to use it effectively for Google Analytics-driven performance tracking and cross-channel content benchmarking.
What each template contains
- Editorial Calendar: Publication date, author, topic cluster, target keywords, distribution channels, and
statusfield for workflow. - Content Brief: Objective, target persona, required headings, internal links, content scoring criteria, and CTAs.
- Performance Dashboard: Canonical URL, UTM parameters, pageviews, sessions, conversions, and a column for qualitative notes.
- A/B Test Log: Variant details, hypothesis, sample size, KPI, statistical significance, outcome.
- Benchmarking Worksheet: Competitor URL, ranking keywords, estimated traffic, and gap analysis fields.
How to import and customize
- Export or download the template as
CSVorXLSXdepending on your CMS and spreadsheet preference. - Open the file in Google Sheets or Excel and use
File > Make a copyto preserve the master. - Replace placeholder keywords and personas with real targets; connect the Performance Dashboard to
Google Analyticsvia exported reports orGA4API connectors. - Add conditional formatting to the Editorial Calendar
statuscolumn for quick visual cues.
Sharing and version control recommendations
- Use a canonical master: Keep one read-only master file and create team copies for editing.
- Track changes: Enable version history (Google Sheets) or use Git for CSVs to log edits.
- Assign ownership: Every row or template should have an accountable owner and review cadence.
- Use tags for releases: Tag versions like
v1.0-launchso rollback is trivial.
Example report snippets (how to read them)
- Traffic snapshot: Pageviews + sessions + bounce rate on top; compare against prior period.
- Engagement: Average time on page + scroll depth notes; flag content below expected thresholds.
- Conversion map: UTM-driven conversions tied back to the content piece and distribution channel.
For teams that want automation built around these artifacts, Scaleblogger.com provides AI-powered content pipelines and performance benchmarking that can ingest these templates directly into an automated workflow. Use the templates as the operational backbone and iterate them after two publication cycles to match real-world patterns and improve your performance tracking and content benchmarking tools. These assets are the practical bridge between planning and measurable outcomes — get them set up once and they compound value every week.
Conclusion
You’ve now got a practical path from configuring Google Analytics to running experiments that actually move the needle. The workflows here show how to translate raw metrics into decisions: set up the right events and custom reports, focus on engagement and conversion signals rather than vanity metrics, and compare pages using simple content benchmarking tools so underperformers surface fast. If you’re wondering how often to benchmark, monthly cadence with a quarterly deep-dive works well; if you’re asking what to track first, start with session quality (time, scroll, goal completions) and a small set of experiment KPIs.
- Instrument analytics correctly: events, UTM hygiene, and custom reports.
- Benchmark regularly: compare cohorts and competitor slices.
- Iterate with experiments: test hypotheses, measure lift, and scale winners.
For teams looking to automate this workflow, platforms like Explore Scaleblogger’s content automation solutions can speed up report generation, content benchmarking, and experiment rollouts so insights turn into content that ranks and retains. If a report still looks confusing, check the event definitions and sampling settings in Google Analytics; if experiments show no lift, revisit the hypothesis and traffic split. Ready to move from guesswork to measurable improvement? Start by fixing your tracking gaps, schedule the first benchmarking run, and consider a demo to see automation in action.
