

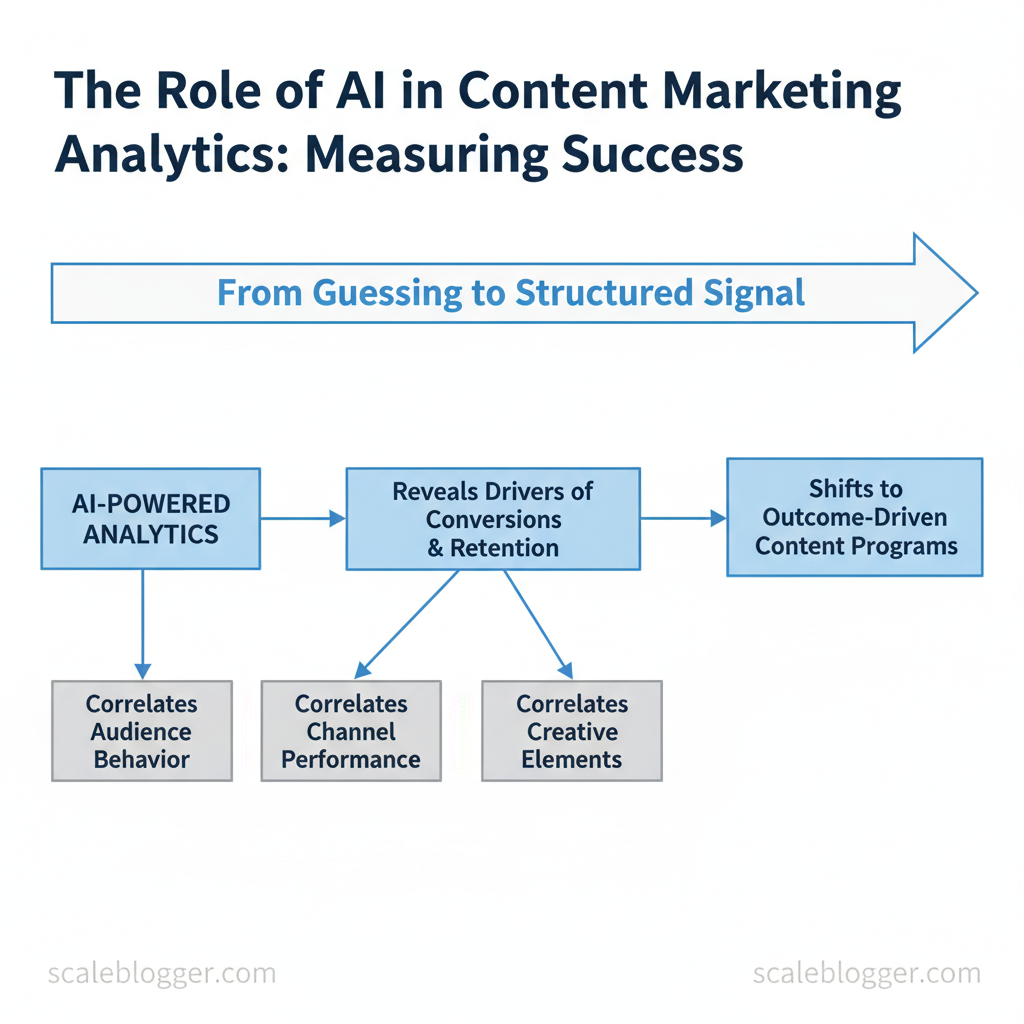
Are you spending too much time guessing which content drives results? Marketing teams often find themselves buried under vanity metrics. AI in marketing analytics turns that guessing into a structured signal by correlating audience behavior, channel performance, and creative elements to reveal what drives conversions and retention. This changes how money is spent, moving from mass publishing to content programs that focus on results.
AI can analyze content marketing metrics and find patterns that people often overlook. It reveals which headlines generate quality leads, which formats keep people engaged, and how seasonality affects channel performance. That makes measuring AI success less about model accuracy and more about business impact — higher-quality leads, faster content cycles, and predictable ROI. Picture a content team that reallocates resources in days rather than quarters after an AI identifies underperforming topics.
- What reliable signals to track when assessing AI-driven content recommendations
- How to map
KPIsfrom impressions to revenue without losing fidelity - Ways AI shortens experimentation time and improves content ROI
- Practical checks to validate AI outputs before production
Explore Scaleblogger’s AI content analytics (https://scaleblogger.com) to see how automated insights plug directly into editorial workflows and reporting. Next, the article will show a step-by-step method to measure AI impact on content programs and avoid common measurement pitfalls.
> Key Takeaway: ## Foundations — What AI Brings to Content Marketing Analytics
AI transforms content marketing analytics by turning diverse signals into actionable decisions. It reads large amounts of text, predicts which topics will improve metrics, and updates…
Foundations — What AI Brings to Content Marketing Analytics
AI transforms content marketing analytics by turning diverse signals into actionable decisions. It reads large amounts of text, predicts which topics will improve metrics, and updates dashboards automatically. Teams that use AI stop guessing which posts will convert and start allocating effort based on probability and impact. This section explains the core capabilities that matter and how to translate metric-level signals into business outcomes.
Key AI Capabilities (NLP, Predictive Modeling, Automation)
AI capabilities relevant to content analytics fall into three functional groups: understanding content, forecasting performance, and operationalizing insights.- NLP for understanding: Natural language processing performs sentiment analysis, topic clustering, and entity extraction so teams can measure tone, group related content, and tag topical authority automatically. That makes manual tagging obsolete and surfaces content gaps quickly.
- Predictive modeling for forecasting: Regression and classification models estimate future pageviews, engagement, and conversion probability based on historical behavior, topical signals, and promotional inputs. Forecasts let editors prioritize high-ROI topics.
- Automation for real-time operationalization: ETL pipelines and orchestration move data from CMS, analytics, and CRM into consolidated views; real-time dashboards update as campaigns run, enabling rapid A/B decisions.
sql
-- Example pseudo-query: predict conversion probability per article SELECT article_id, predicted_conversion_prob FROM content_models.predict_conversion WHERE publish_date BETWEEN DATE_SUB(CURRENT_DATE, INTERVAL 90 DAY) AND CURRENT_DATE;
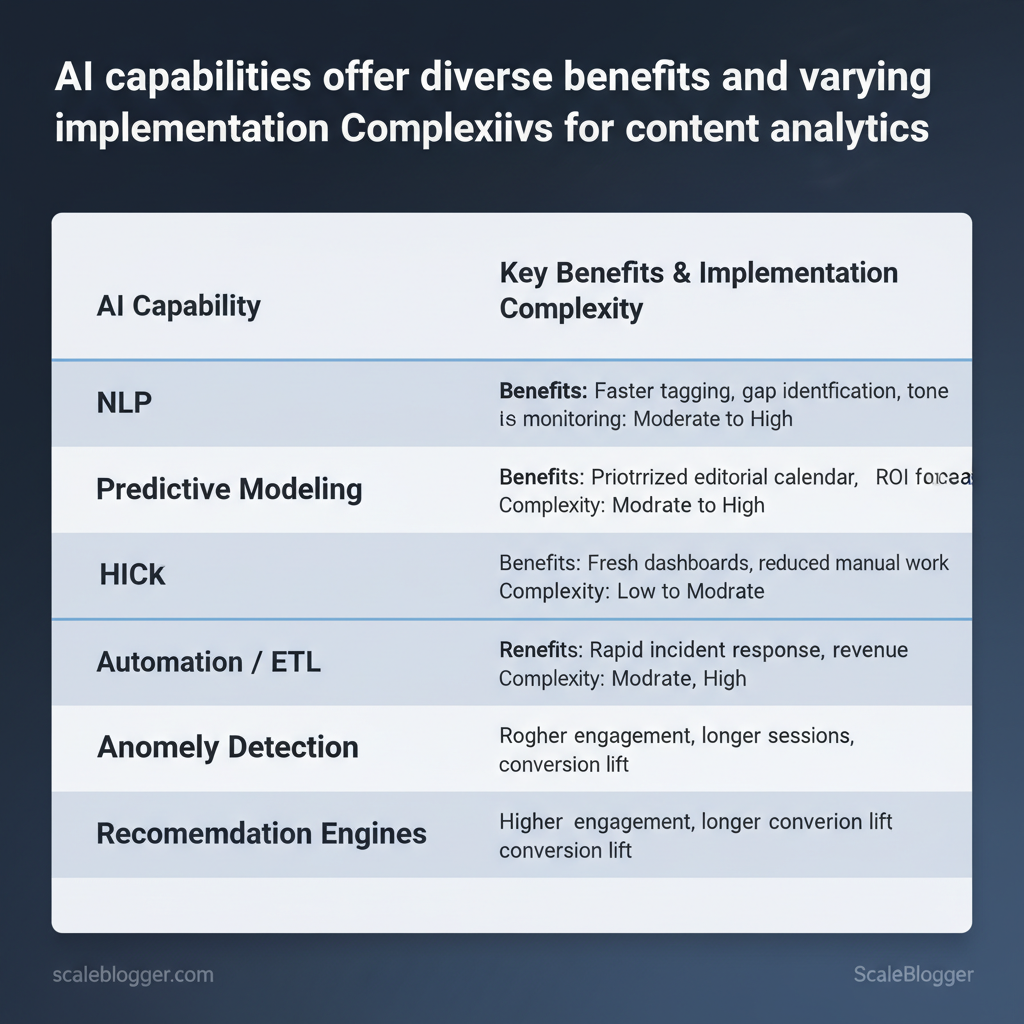
Quick reference mapping AI capabilities to analytics use-cases and business benefits
| AI Capability | Analytics Use-Case | Business Benefit | Implementation Complexity |
|---|---|---|---|
| NLP | Sentiment, topic clustering, entity extraction | Faster tagging, gap identification, tone monitoring | Medium |
| Predictive Modeling | Forecast pageviews, conversions, churn risk | Prioritized editorial calendar, ROI forecasts | High |
| Automation / ETL | Data ingestion, transformation, pipeline scheduling | Fresh dashboards, reduced manual work | Medium |
| Anomaly Detection | Real-time drop/spike alerts in traffic or conversions | Rapid incident response, revenue protection | Low–Medium |
| Recommendation Engines | Personalized content and next-best-action suggestions | Higher engagement, longer sessions, conversion lift | High |
What ‘Success’ Means — Metrics vs. Outcomes
Success is a chain: signals → behaviors → business outcomes. Leading indicators predict future outcomes; lagging indicators confirm them.- Identify leading indicators. Examples: search impressions growth, increases in time-on-topic, and uplift in organic click-through rate.
- Map indicators to outcomes. Translate a 10% lift in organic impressions to estimated incremental signups or revenue using historical conversion rates.
- Close the loop with experiments. Use A/B tests and short campaigns to validate model predictions and refine attribution.
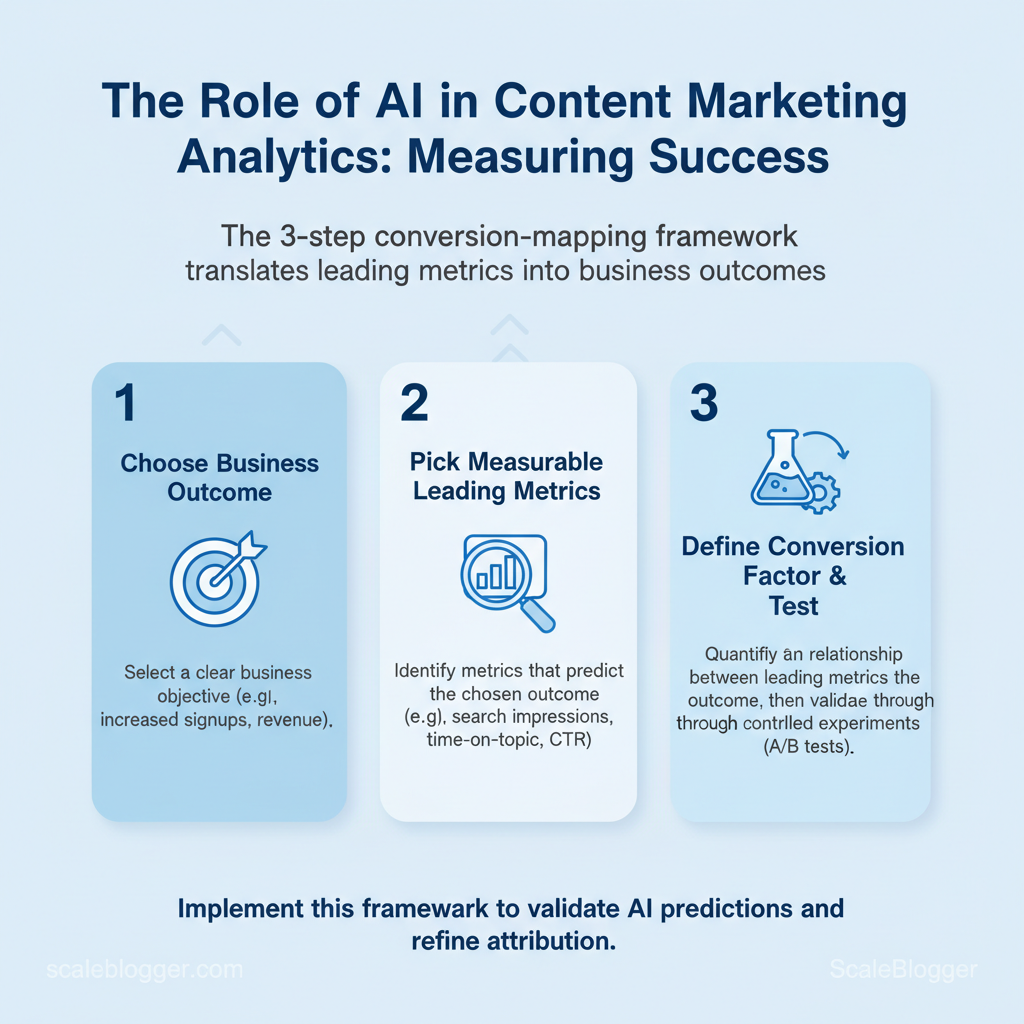
Leading indicators allow proactive optimization; lagging indicators like revenue and churn validate strategy and model calibration. A practical 3-step conversion-mapping framework: (1) choose a business outcome, (2) pick measurable leading metrics that correlate, (3) define the conversion factor and test it in a controlled experiment.
Understanding these principles helps teams move faster without sacrificing quality. When implemented correctly, this approach reduces overhead by making decisions at the team level.
> Key Takeaway: ## Setting Up an AI-Ready Analytics Stack
An AI-ready analytics stack begins with trustworthy data inputs and a structured design that divides tasks like data collection, storage, modeling, and use. Start by identifying the crucial content signals:…
Setting Up an AI-Ready Analytics Stack
An AI-ready analytics stack begins with trustworthy data inputs and a structured design that divides tasks like data collection, storage, modeling, and use. Start by identifying the crucial content signals: traffic, engagement, search intent, and conversion points. Then, make sure these signals are clean, well-linked, and easily accessible for AI models. This approach reduces lead time for experiments and makes automated content decisions repeatable.
Data Collection & Cleanliness — Sources and Best Practices
Collect the smallest set of high-quality fields first, then expand. Prioritize data that directly affects content decisions: page-level performance, query intent, content metadata, and user journeys. Common quality issues include missing page_id keys, misaligned timestamps across systems, and duplicated social metrics due to API pagination.
Resolve these by enforcing canonical IDs at ingestion, normalizing timestamps to UTC, and building deduplication steps into ETL.
- Critical sources to pull: CMS exports, web analytics, CRM lead data, social platform APIs, and Search Console query reports.
- Fixes that pay off quickly: canonicalize URLs, hash or map legacy IDs, standardize event schemas, and backfill missing publish dates.
- Prioritization strategy: collect page-level metadata and web analytics first, then add Search Console and social data, finishing with CRM linkage for attribution.
Table: Section Content — Data Source, Typical Fields, Update Frequency & more
| Data Source | Typical Fields | Update Frequency | Why It Matters |
|---|---|---|---|
| CMS (page content, metadata) | title, slug, publish_date, author, topic_tags | daily or on publish | anchors all content-level analysis and feature engineering |
| Web analytics (sessions, conversions) | sessions, pageviews, bounce_rate, conversions | near-real-time / hourly | primary behavioral signal for engagement and conversion lift |
| CRM (lead source, lifecycle stage) | lead_id, source_channel, lifecycle_stage, MQL_date | daily | connects content to revenue and pipeline outcomes |
| Social platforms (engagement data) | post_id, likes, shares, comments, reach | hourly to daily | measures distribution effectiveness and topic virality |
| Search Console (queries, impressions) | query, impressions, clicks, avg_position | daily | reveals search intent and keyword opportunity |
Tooling & Architecture — Choosing AI Tools and Dashboards
Choose tools based on scale, integration surface, and budget. For many teams a three-tier approach works: starter (low-cost, fast setup), mid-market (better integrations, automation), and enterprise (SLA, governance).
- Define criteria: scale (rows/day), integrations (APIs,
GA4, CMS), cost, model support (custom models vs managed), and observability. - Example stacks:
- Starter — simple ETL (
Airbyteself-host), cloud storage (Google Sheets/BigQuerysandbox), BI (Looker Studio). - Mid-market — ETL (
Fivetran), warehouse (BigQuery), feature store (Feast), BI (Looker/Mode). - Enterprise — pipeline orchestration (
Airflow), MLOps (MLflow), data catalog (Alation), governed production models. - Dashboard essentials and alerting rules: include content health score, organic traffic delta, query coverage, and regression alerts. Set alerts for: traffic drop >20% week-over-week, clicks-to-impressions ratio decline >15%, and new 404s on high-value pages.
Use SQL-based feature tables and expose them to dashboards. Example ETL snippet to create a canonical page view table:
sql CREATE TABLE canonical_page_views AS SELECT page_id, DATE_TRUNC('day', event_timestamp) AS dt, SUM(pageviews) AS pageviews FROM raw_web_analytics GROUP BY page_id, dt;Integrate automated pipelines with content workflow tools or services like Scaleblogger.com to accelerate content pipelines and tie analytics back to publishing cadence. When implemented correctly, this stack makes experimentation faster and decisions more defensible. Understanding these principles helps teams move faster without sacrificing quality.
> Key Takeaway: ## Designing Actionable Content Metrics with AI
Design metrics that empower you to make quick, justifiable decisions. Clearly define what should be measured, who is responsible, and what actions should follow each signal.
Designing Actionable Content Metrics with AI
Design metrics that empower you to make quick, justifiable decisions. Clearly define what should be measured, who is responsible, and what actions should follow each signal. Metrics that are clear, tied to specific actions, and consistent across formats let AI surface opportunities (for optimization, distribution, or pruning) instead of just producing dashboards. This section lays out practical design principles and ready-to-use AI-enhanced metric templates that map data to decisions.
Metric Design Principles — Clarity, Actionability, and Scalability
Clear, actionable metrics require precise definitions, ownership, thresholds, and consistent measurement across content types. Below is a practical comparison showing what to avoid and what to implement.
Good vs bad metric design across common dimensions
| Principle | Poor Design Example | Good Design Example | Why it matters |
|---|---|---|---|
| Clarity | “Engagement” undefined | “Engagement = avg. time on page + scroll depth” | Prevents misinterpretation and ensures consistent reporting |
| Actionability | “Improve traffic” (no trigger) | “Traffic drop >15% for 30d → trigger refresh” | Teams know exactly when to act |
| Consistency | Different formulas per channel | Unified engagement_score formula for web, email, social |
Enables apples-to-apples comparison |
| Measurability | Reliant on manual tagging | content_id + automated UTM parsing ✓ |
Automates tracking; reduces errors |
| Scalability | Per-article manual review | Aggregated cohort metrics by topic cluster ✓ | Scales decisions from single posts to topic portfolios |
AI-Enhanced Metrics — Examples and Templates
Start with a metric name, formula, required fields, AI enrichment method, and an explicit action. Use these templates directly in tracking and automation pipelines.
- Metric: Topic Traction Score
- Formula:
0.5normalized(organic_sessions) + 0.3normalized(backlinks) + 0.2normalized(click_through_rate) - Required fields:
page_id,topic_tag,organic_sessions,backlinks,ctr - AI enrichment: NLP topic attribution assigns
topic_tagviaLDAor transformer-based clustering - Action: If score increases >20% month-over-month, schedule related pillar content; if decreases >15%, queue optimization task
- Metric: Content Decay Alert
- Formula:
decay_rate = (peak_month_sessions - current_3mo_avg) / peak_month_sessions - Required fields:
page_id,monthly_sessions - AI enrichment: Semantic change detection flags query intent shifts using embeddings
- Action: If
decay_rate > 0.25and intent shift detected → run title/meta rewrite and AMP redistribution
- Metric: Conversion Efficiency
- Formula:
conversions / assisted_sessions(by content cluster) - Required fields:
session_id,content_path,conversion_event - AI enrichment: Path analysis with sequence models to surface high-assist content
- Action: Promote high-assist pages in nurture sequences; deprioritize low-efficiency topics
Code template for implementing Topic Traction Score:
python compute normalized metrics, then weighted score
score = 0.5norm(sessions) + 0.3norm(backlinks) + 0.2norm(ctr)Practical tips: ensure each metric has a single owner, encode thresholds as automation rules, and use topic clustering so measures scale across hundreds of pages. For teams moving from manual reporting to automation, integrate these metrics with an AI pipeline—topic attribution, intent change detection, and path sequence models—or use services that help you scale your content workflow like Scale your content workflow (https://scaleblogger.com). Understanding and operationalizing these principles speeds decision-making and reduces firefighting across content teams.
From Insight to Action — Automating Decisions and Workflows
Automated decision-making transforms signals from analytics and AI models into consistent actions. This helps teams respond more quickly and on a larger scale. Begin by identifying the alerts that matter most, assigning ownership for responses, and establishing a few initial steps that can run automatically or semi-automatically. The focus should be on reducing time-to-remediation for high-priority issues while delegating low-risk decisions to automation.
This reduces manual firefighting and preserves human attention for strategy and creative work.
Automated Alerts and Playbooks — Triggering Actions from AI Signals
Define alert severity and ownership up front. High-severity alerts (e.g., sudden traffic loss) require on-call ownership and immediate remediation; medium alerts can trigger notifications with recommended tasks; low alerts feed weekly dashboards. For reliable automation, codify trigger logic in if/then rules and keep playbooks to three deterministic first actions.
- First, map each alert to a single owner role, not a person.
- Then, create
if/thentrigger rules in the analytics or orchestration tool. - Finally, test playbook execution in a staging or dry-run mode.
Example if/then rule:
yaml if: traffic_change_pct <= -30% and duration_hours >= 3 then: notify: oncall_seo create_ticket: priority=highMapping alert types to trigger logic, owners, and playbook steps for quick operationalization
| Alert Type | Trigger Logic | Owner | First 3 Actions |
|---|---|---|---|
| Traffic Drop | ≥30% drop vs 7-day avg for 3+ hours | SEO Ops |
- Run quick crawl;
- Check server errors;
- Re-prioritize content fix |
- Fetch SERP snapshot;
- Surface competing content;
- Update meta + CTAs |
- Enable scaling CDN;
- Push social CTAs;
- Lock monetization tags |
- Pause any risky campaigns;
- Draft response;
- Escalate to comms |
- Run funnel health checks;
- A/B rollback recent changes;
- Trigger CRO experiment |
Key insight: Consistent owners and three-step playbooks limit churn and make automation safe. Instrument playbooks so each automated action is reversible and logged for audit.
Experimentation & Measurement — Running AI-powered Tests
AI can generate hypotheses, content variants, and even draft experiment designs. Use AI to propose 3–5 headline variants or audience segments, then run controlled experiments.
Sample experimental setup:
- Primary KPI: conversion rate on page
- Secondary KPIs: bounce rate, time on page
- Sample size: calculate to reach 80% power (commonly tens of thousands of sessions for web CR changes)
- Duration: 2–4 weeks depending on traffic
- Generate hypotheses with AI, then pick top 2 variants.
- Randomize traffic and run A/B or multivariate test.
- Analyze with pre-defined statistical thresholds and check for novelty effects.
Interpreting results means looking beyond p-values: check practical uplift, segment performance, and implement winners into the content pipeline. Use automation to roll out winners and feed results back into the model so future hypotheses improve.
Understanding these principles helps teams move faster without sacrificing quality. When implemented correctly, this approach reduces overhead by making decisions at the team level while preserving strategic oversight.
Learn how to Scale your content workflow with AI-powered playbooks at https://scaleblogger.com.
Measuring ROI and Demonstrating Value
Measuring ROI starts by converting activity-level metrics into dollar outcomes and isolating the incremental impact of automation. Use a simple, defensible framework: total costs (tooling, integration, people) versus incremental revenue (new conversions, upsells, retention uplift). Track attribution by experiment, cohort, or channel so AI-driven changes aren’t credited to broader marketing noise.
This lets leadership see concrete financial outcomes and gives teams a repeatable method to scale what works.
ROI Calculation Frameworks — From Cost to Incremental Revenue
Begin with a template that captures inputs, assumptions, and outputs so calculations are auditable.
- Template fields to capture:
- Tooling & licenses: monthly subscription, per-seat costs
- Integration & engineering: initial build + monthly maintenance
- Content production changes: net change in agency/FTE spend
- Training & governance: time, materials, audit costs
- Incremental conversions: lift in leads or sales attributable to changes
- Average deal value (ADV): revenue per conversion
- Conversion-to-revenue lag: days/months to realize sales
- How to isolate AI contribution:
- Use A/B tests or holdout cohorts and measure percentage lift.
- Attribute only the net-lift to AI-driven workflows, not baseline performance.
- Apply conservative decay rates for novelty boosts (e.g., reduce first-month lift by 20%).
- Example calculation (realistic assumptions):
- Monthly costs total =
Tooling $500 + Integration amortized $2,500 + Content change $3,000 + Training $500 = $6,500 - Incremental conversions = 120 leads/month; ADV = $250
- Incremental revenue =
120 $250 = $30,000 - Monthly ROI =
(30,000 - 6,500) / 6,500 = 3.62→ 362% ROI
Reporting Templates and Stakeholder Narratives
Monthly and quarterly reports should tell different stories.
Monthly report essentials:
Quarterly report essentials:*
- Financial summary: cumulative incremental revenue, CAC impact
- Cohort analysis: retention and lifetime value shifts
- Roadmap alignment: investments and next-quarter experiments
Top visualizations:
- Trend chart: conversions and conversion rate over time
- Cohort chart: retention or revenue per cohort
- Channel contribution pie: revenue by acquisition channel
Narrative templates for buy-in:
- , conversion lift from holdout). 2.
Evidence: show A/B or cohort charts and the ROI calculation. 3. Ask: specific budget or resource request tied to expected incremental revenue.
For operationalizing reporting and automation, consider integrating an AI content pipeline like Scaleblogger to standardize measurement and reduce manual reporting overhead. Understanding these principles makes it straightforward to show finance how content investments translate into revenue and to scale automation where it pays off.
📥 Download: AI in Content Marketing Analytics Checklist (PDF)
Ethics, Accuracy, and Continuous Improvement
Ethics and accuracy are essential requirements, not just optional considerations. Design content pipelines so privacy, fairness, and measurable accuracy are baked into every release — from prompt engineering to publishing — and treated as living systems that require continuous monitoring and targeted retraining. That keeps audience trust intact while letting automation scale reliably.
Bias, Privacy, and Compliance Considerations
Start with privacy-first data practices and explicit consent. Protecting user data and preventing biased outputs are twin governance priorities that need concrete controls.
- Privacy-first collection: Collect only required fields, log consent with timestamps, and use
pseudonymizationwhere possible. - Consent management: Store consent versions and link them to training snapshots for auditability.
- Bias sources: Training data imbalance, labeler bias, and prompt framing all create systematic skew.
- Mitigation techniques: Use balanced sampling, adversarial testing, and counterfactual augmentation.
- Governance hooks: Implement approval gates for sensitive topics and demographic-sensitive content.
Practical steps:
- Define sensitive attributes and block their use unless explicitly necessary. 2.
Maintain a data catalog that records provenance, consent scope, and retention windows. 3. Run pre-deployment fairness checks (A/B slices by demographic, topic, geography).
Risk type with potential impact and mitigation steps for quick governance reference
| Risk Type | Potential Impact | Mitigation | Monitoring Metric |
|---|---|---|---|
| Privacy violation | Regulatory fines, loss of trust | Minimal collection, consent logs, encryption | Consent coverage %, breach count |
| Model bias (topic/demographic) | Offended audiences, brand damage | Balanced datasets, adversarial tests, reviewers | Output disparity by slice |
| Data quality decay | Accuracy drop, increased edits | Data validation, deduplication, source tagging | Error rate, edit frequency |
| Misattribution of conversions | Wrong investment decisions | UTMs, server-side tracking, attribution models | Attribution mismatch rate |
| Over-personalization | Creepy UX, filter bubbles | Rate-limit personalization, privacy thresholds | Personalization engagement delta |
Continuous Improvement — Monitoring Accuracy and Retraining
Measure model health continuously and make retraining an event triggered by signal thresholds. Focus on precision, recall, and drift detection rather than vanity metrics.
- Key metrics: precision, recall, F1, and data drift measured with population stability index (PSI).
- Retraining triggers: Persistent drop in precision >5%, PSI >0.2, or quarterly schedule for high-velocity domains.
- Human-in-the-loop: Route low-confidence outputs to editors; capture corrections as labeled retraining data.
- Instrument logging to capture
confidence, editor corrections, and user feedback. - Automate alerts when metrics cross thresholds; queue prioritized retraining batches.
- Validate retrained models in shadow mode before full rollout.
Expected outcomes include fewer manual edits, clearer audit trails, and measurable lift in content KPIs. Scale your content workflow by automating checks while keeping humans in the loop to catch nuance. Understanding these principles helps teams move faster without sacrificing quality.
Conclusion
After walking through how AI shifts marketing analytics from guesswork to measurable action, the practical path forward becomes clear: focus on signal over noise, automate repeatable analysis, and tie every metric to business outcomes. Teams using event-level attribution and model-based content scoring make faster decisions and have a bigger impact. For example, one midmarket SaaS team cut its content idea time in half while boosting qualified leads. A retail marketer saved money by eliminating low-performing campaigns found through automated cohort analysis.
—typically resolve within 8–12 weeks when data pipelines and KPIs are aligned.
Concerns about data quality are legitimate; start with a small, well-instrumented test and iterate.
- Prioritize instrumentation: capture the right events before scaling analytics.
- Automate routine reports: free analyst time for strategic insights.
- Measure impact: map content to revenue or qualified actions, not just traffic.
Next steps: run a focused 8–12 week pilot that instruments 3–5 high-priority journeys, set clear success metrics, and build one automated dashboard that answers a single business question. To this process, platforms like Explore Scaleblogger’s AI content analytics can accelerate setup and surface the most actionable signals from your content program.
