

Ignoring visual assets can lead to a significant loss in search visibility for marketers. Industry experience shows that visual content—when paired with strategic alt text, responsive formats, and fast delivery—can lift organic rankings and user engagement simultaneously. This affects discoverability, time-on-page, and conversion velocity across content funnels.
Image-heavy pages that skip image optimization often have slow load times and bad mobile experiences. This lowers SEO performance, even if the written content is strong. Picture a product page where compressed, descriptive images reduce load time and increase click-through rates; the reward is improved ranking signals and higher revenue per visit. Scaleblogger helps teams automate those optimizations at scale, turning visual assets into reproducible search gains.
- How to structure image metadata to improve crawlability and relevance
- Techniques for balancing quality and load speed across devices
- Ways to measure visual content impact on organic traffic and conversions
- Practical steps to automate image optimization workflows with Scaleblogger
Next, the article walks through actionable steps to audit,, and scale visuals so they consistently boost search presence and user value. See how Scaleblogger can scale your visual content and SEO: https://scaleblogger.com
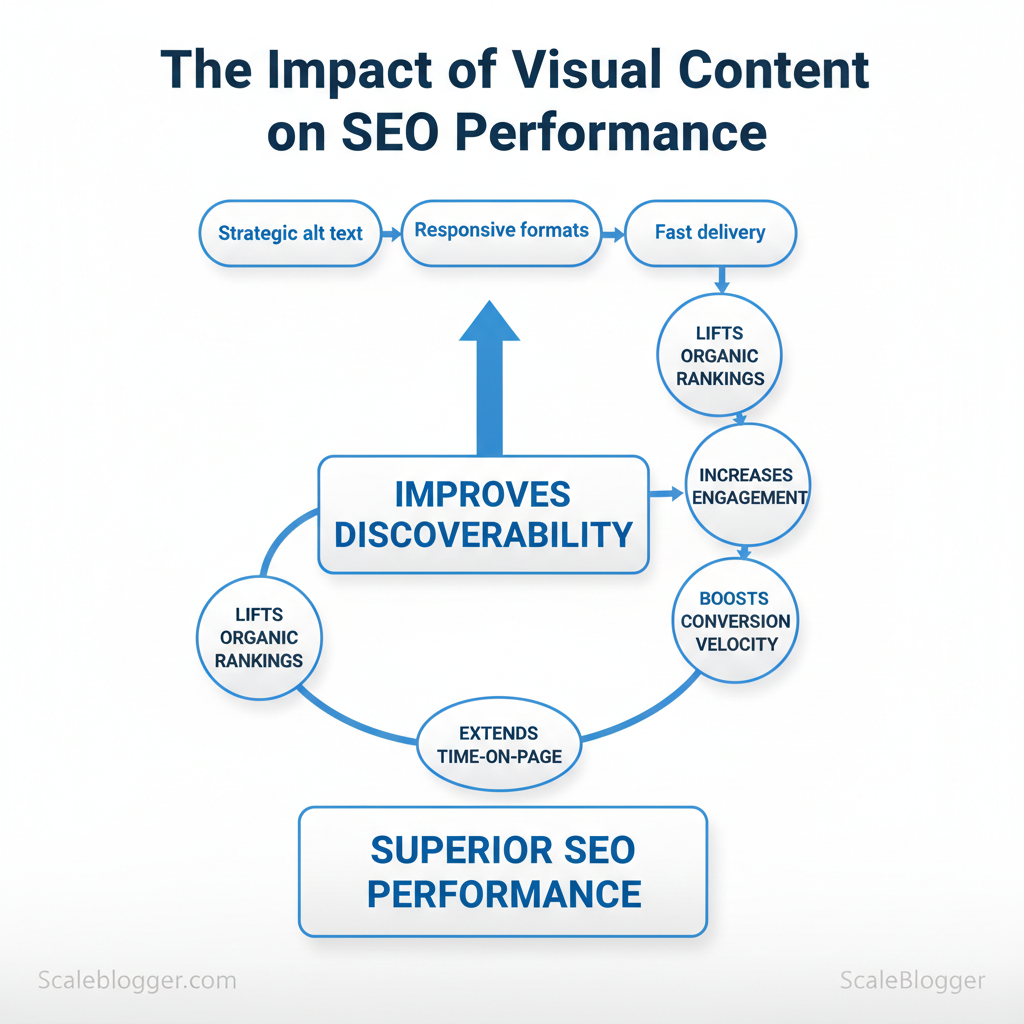
> Key Takeaway: ## Why Visual Content Matters for SEO
Visual content directly improves measurable ranking signals: it raises click-through rates, increases time on page, and expands the organic footprint through image and video search. When visuals match user…
Why Visual Content Matters for SEO
Visual content directly improves measurable ranking signals: it raises click-through rates, increases time on page, and expands the organic footprint through image and video search. When visuals match user intent and are properly optimized with alt attributes, descriptive filenames, and schema.org markup, search engines better understand how to display pages in visual-rich search results like image packs and video carousels. The practical result is more entry points, longer sessions, and better engagement metrics that feed back into organic visibility.
How visuals change user behavior and indexing
- Engagement lift: Use relevant images and short videos to enhance snippets, boosting CTR from search results. – Time-on-page extension: Tutorial screenshots, embedded videos, and interactive diagrams slow bounce rates and increase dwell time. – Discoverability: Well-optimized images can rank in Google Images and drive incremental traffic; videos indexed on YouTube widen reach across platforms.
- Structured data impact: Using
ImageObject,VideoObject, and contentschemasurfaces thumbnails and playback controls directly in SERPs.
Types of optimization that matter
- First, choose formats that match intent — users researching a process want an infographic or screenshots; shoppers want product photos and 360˚ views. 2.
Then, load performance by serving WebP, lazy-loading below-the-fold media, and using responsive srcset. 3. Finally, add alt text, captions, and structured markup so search engines and assistive tech understand context.
Practical examples
- Infographics condense complex topics into shareable assets that attract backlinks. – Screenshots validate step-by-step tutorials and increase conversions on how-to pages. – Product photos directly correlate with purchase intent and drive discovery in shopping results.
- Video extends session duration but requires careful hosting and transcoding to avoid load penalties.
This section benefits content teams that need to match format to intent while maintaining speed and crawlability. Implementing these tactics consistently reduces friction between creative execution and measurable SEO outcomes.
Visual formats by SEO benefit and common implementation pitfalls to help writers choose the right format
| Format | Primary SEO Benefit | Best Use Case | Common Pitfall |
|---|---|---|---|
| Photograph | Improves product discovery and CTR | Product detail pages, e‑commerce galleries | Large files slowing pages |
| Illustration | Brand differentiation and social share potential | Concept explanation, hero images | Low discoverability without good alt |
| Infographic | Earns backlinks and social traction | Guides, data-driven content | Poor accessibility, large file size |
| Chart/Graph | Supports authority and skimmable data | Research reports, comparison pages | Raster images unreadable on mobile |
| Video | Increases time on page and cross-platform reach | Tutorials, demos, product teasers | Hosting/encoding causing slow load |
alt text, and appropriate schema — they turn creative assets into persistent SEO. com.
This approach frees creators to focus on clarity and relevance, which ultimately drives more organic traffic.
> Key Takeaway: ## Image Optimization Basics
Start by treating images as first-class content: they must load fast, scale crisply, and be discoverable by search engines and assistive tech. Good image optimization balances three factors: format choice, file…
Image Optimization Basics
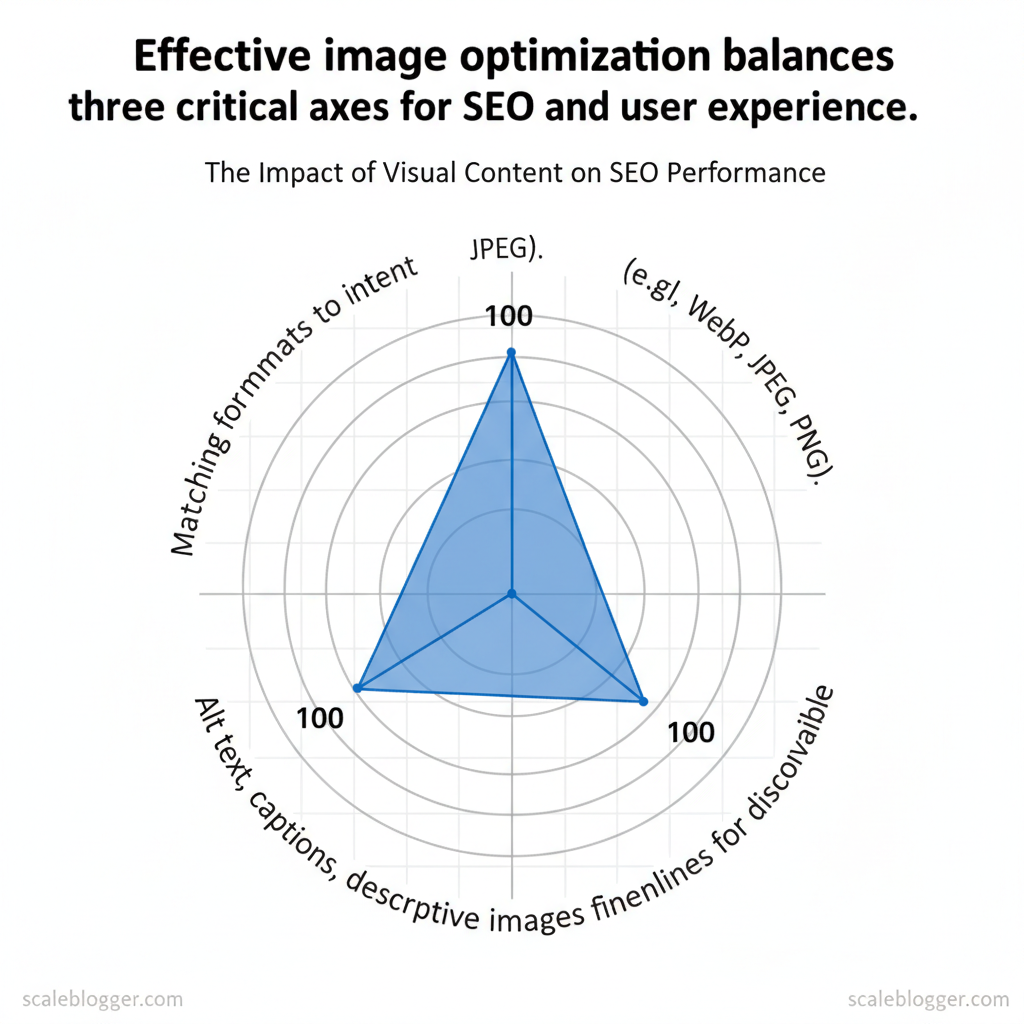
Start by treating images as first-class content: they must load fast, scale crisply, and be discoverable by search engines and assistive tech. Good image optimization balances three factors: format choice, file size, and contextual metadata. This makes pages load quickly and helps images improve SEO and engagement.
Prerequisites and tools (5–10 minutes setup)
- Browser support check: confirm target audience browsers (mobile vs desktop). Image tools: install or access Squoosh, ImageMagick, or an automated pipeline. CMS access: ability to edit HTML attributes and upload multiple image sizes.
com when scaling image metadata.
Technical Optimization: formats, compression, sizing (actionable rules)
- Choose the right format: use AVIF/WebP for photos, SVG for icons/logos, and fallback to JPEG/PNG where needed. 2.
Target sizes: aim for 50–200 KB for most inline images; larger hero images can go higher but compress aggressively. 3. Implement responsive delivery:
- Generate multiple widths (400px, 800px, 1200px).
- Use
srcsetandsizesto serve the right resolution. 4. Use intrinsic sizing (width/height attributes or CSSaspect-ratio) to avoid layout shifts.
- Automate lossy vs lossless decisions: keep transparency in PNG/SVG, use lossy for photos.
Example srcset implementation
html <img src="photo-800.jpg" srcset="photo-400.jpg 400w, photo-800.jpg 800w, photo-1200.jpg 1200w" sizes="(max-width:600px) 100vw, 800px" alt="Coastal trail at sunrise, Oregon">Accessibility & metadata: alt text, titles, captions (practical guidance)
- Alt text — concise: describe function and content in 5–15 words, include the primary keyword only when natural. Title attribute — optional: use for extra context (not a substitute for alt). * Captions — use when useful: captions improve readability and indexing; add them when they add context or attribution.
- Avoid keyword stuffing: write for clarity first; search benefits follow when accessibility is correct.
Quick checklist for implementation (5–20 minutes per image set)
- Format chosen
- Files exported at multiple widths
srcsetandsizespresent- Width/height or
aspect-ratiodefined - Alt text concise and descriptive
- Caption added if helpful
Quick reference comparing image formats by best use case, browser support, compression efficiency, and ideal use
| Format | Best Use Case | Pros | Cons |
|---|---|---|---|
| JPEG | Photographic images | Wide support, small lossy files | No transparency, artifacts at high compression |
| PNG | Graphics with transparency | Lossless, sharp edges, transparency | Larger files for photos |
| WebP | Photos and simple graphics | Better lossy & lossless than JPEG/PNG | Older Safari versions needed fallback |
| SVG | Icons, logos, illustrations | Infinite scalability, tiny file size | Not suitable for photos, potential security if untrusted |
| AVIF | High-quality photos, next-gen | Superior compression to WebP/JPEG | Encoding slower, variable browser support |
Understanding these principles helps teams move faster without sacrificing quality. When implemented consistently, pages load quicker, accessibility improves, and images contribute to organic discoverability.
> Key Takeaway: ## On-Page Visual Content Strategies
Place important visuals where they quickly meet the user’s needs. Hero images, explainer videos, and informative charts should be near the top, so the page clearly shows its purpose right away.
On-Page Visual Content Strategies
Place important visuals where they quickly meet the user’s needs. Hero images, explainer videos, and informative charts should be near the top, so the page clearly shows its purpose right away. Surround each visual with concise, semantically related text and a clear caption so search engines and users read the image in context. For performance, lazy-load non-critical images and prioritize meaningful assets with loading="eager" or preloading for hero media.
This reduces perceived load time while keeping essential copy above the fold.
- Prioritize placement and user flow
- Top-of-page visuals: place hero image or 10–20s video snippet within the first content block so the page intent is immediately clear.
- Contextual anchors: write a short lead paragraph above the visual and a caption below; both should reuse natural keywords and related phrases.
- Avoid hiding critical text: do not push unique value propositions below a large image carousel.
- Visual hierarchy: use size, contrast, and whitespace to direct attention to CTAs and key paragraphs.
- Semantic relevance: include alt text and captions that are descriptive and avoid keyword stuffing.
- Performance optimization: lazy-load secondary images, serve WebP or AVIF, and use responsive
srcsetattributes.
Using structured data for visuals increases the chance that images and videos appear as rich results. Implement ImageObject for key images and VideoObject for embedded video. Include caption, copyrightHolder, and contentUrl fields to clarify ownership and context to crawlers.
Validate structured data with Google’s Rich Results Test before publishing to catch syntax issues and missing recommended properties.
Example ImageObject snippet:
json { "@context": "https://schema.org", "@type": "ImageObject", "contentUrl": "https://example.com/assets/chart-2025.webp", "thumbnailUrl": "https://example.com/assets/chart-2025-thumb.webp", "caption": "Quarterly traffic growth by channel", "copyrightHolder": "Example Media LLC", "uploadDate": "2025-02-10" }Schema properties commonly used for images and short descriptions of why each matters (image schema, image structured data)
| Schema Property | Example Value | SEO Benefit | Validation Tip |
|---|---|---|---|
| contentUrl | https://example.com/images/hero.avif | Points crawlers to canonical image asset for indexing | Confirm URL is accessible and not blocked by robots.txt |
| caption | Hero image: product in use | Improves semantic relevance and user understanding | Keep captions concise and unique per image |
| copyrightHolder | Acme Studios, Inc. | Clarifies ownership — important for licensing filters | Use exact legal entity name |
| thumbnailUrl | https://example.com/images/hero-thumb.webp | Used by SERPs for previews, reduces load on results | Ensure thumbnail is small (<50KB) and matches contentUrl |
| uploadDate | 2025-02-10 | Signals freshness for time-sensitive visuals | Use ISO 8601 format YYYY-MM-DD |
Understanding these placement and schema practices helps teams deliver visuals that load quickly, rank better, and communicate value immediately—freeing writers and designers to iterate on the creative side rather than firefighting technical issues. If automating visual pipelines, consider integrating schema generation into the publishing workflow so every asset ships with valid metadata.
Measuring the SEO Impact of Visual Content
Visuals affect both discoverability and engagement. To measure this impact, you need to combine metrics from search, on-page behavior, and performance signals. Start by tracking image search impressions and clicks directly in Google Search Console, instrumenting image interactions in GA4 as events, and watching Largest Contentful Paint alongside total page weight to avoid sacrificing speed for visuals. These three measurement domains—discovery, engagement, performance—cover the levers that change SEO outcomes.
Key Metrics and Tools to Track
Table: Section Content — Metric, Recommended Tool, Alert Threshold & more
| Metric | Recommended Tool | Alert Threshold | Action on Deviation |
|---|---|---|---|
| Image Search Impressions | Google Search Console (Performance > Search type: Image) | A significant drop in performance may indicate issues. | Audit recent image changes, check robots/x-robots-tag, revert or alt text and structured data |
| Organic CTR | Google Search Console (Performance) | A low CTR may indicate the need for optimization. | Test improved thumbnails, better og:image, rewrite meta/title to match visual intent |
| Time on Page (Engagement) | GA4 (events + session metrics) | A significant drop in engagement may warrant further investigation. | Inspect visual changes, run heatmaps, A/B test visual placement |
| Largest Contentful Paint (LCP) | PageSpeed Insights / Chrome UX Report | A high LCP may indicate performance issues. | Compress images, use loading="lazy", serve next-gen formats (WebP/AVIF) |
| Total Page Size | WebPageTest / Lighthouse | >2.5 MB | Audit asset pipeline, implement responsive srcset, defer non-critical media |
Experimentation: A/B Tests and Controlled Experiments
- Formulate a measurable hypothesis. Example: Adding infographic X to article Y will increase average time on page by 15% and image search impressions by 10% over 30 days.
- Create a holdout. Use duplicate pages or server-side feature flags so 50% of comparable traffic sees the visual and 50% does not.
- Instrument tracking. Configure GA4 events for
image_view,image_click, and scroll depth; tag experiments in URLs or analytics. - Run long enough for significance. Aim for at least two full traffic cycles (usually 2–4 weeks) and ensure minimum sample sizes before declaring a winner.
- Control for confounders. Segment by traffic source, device, and referrer to avoid attributing changes from promotional traffic or seasonality.
- Iterate on learnings. If the visual improves engagement but hurts LCP, test optimized formats or adaptive loading rather than removing the asset.
Example GA4 event snippet for image clicks:
javascript document.querySelectorAll('img.trackable').forEach(img=>{ img.addEventListener('click',()=>{ gtag('event','image_click',{ 'image_name': img.alt || img.src }); }); });Operationalize results by recording outcomes in the editorial roadmap and automating follow-ups: if an image test wins and LCP stays acceptable, roll the change sitewide. For teams using AI pipelines, integrate experiment outputs into content scoring so successful visual patterns scale quickly—Scale your content workflow with automation where appropriate. Understanding these measurement practices allows teams to experiment confidently without sacrificing page speed or search visibility.
Implementing Visuals at Scale
Define a repeatable pipeline to convert a single visual brief into a ready-to-publish asset set. The pipeline must codify intent, output formats, accessibility requirements, and optimization targets so designers, engineers, and CMSs all operate from the same constraints. When those decisions are made up front, teams can automate the repetitive parts and keep creative effort where it matters.
Prerequisites
- Clear content taxonomy: mapping of visual types (hero, thumbnail, infographic). Design tokens and style guide: colors, typography, spacing. CI/CD access: build and deploy hooks for automated optimization.
- Asset storage: CDN or object store with versioning.
Tools and materials
- Design tools: Figma, Sketch files with export presets. js
next/image. CI checks: Axe accessibility linter, image-scan scripts.
com for integrated AI-assisted pipelines).
Workflow: From brief to publish (step-by-step)
- Create the brief: state intent, required formats, target devices, and SEO hooks (title, caption, schema). 2.
Produce assets: designers export layered masters plus @1x/@2x derivatives and a source SVG/PNG. 3. Run optimization: automated compression, format selection (webp/AVIF), and responsive variants generated.
- QA & accessibility: run alt-text templates, color-contrast checks, and semantic markup validation. 5.
Publish + schema: push optimized assets to CDN, attach image schema and og:image, and invalidate cache.
Practical examples
- Template alt text:
Illustration of {concept} showing {primary-element} used for {intent}.Use short, descriptive text; review for context. - Automation snippet (build step):
bash example: compress and upload
imagemin src/images/ --out-dir=build/images && cloudinary-cli upload build/images/Automation and tooling best practices
- Build-time optimization: prefer
next/imageor static transforms during CI to reduce runtime cost. CDN transforms: use Cloudinary/Imgix for on-the-fly responsive images and focal-point crops. Metadata templates: auto-generate title/caption/alt from content fields, then require human review.
- Accessibility in CI: fail builds on missing alt text or low contrast via linters. Performance gating: include image budget checks (
Total image weight < 250KBtypical).
> Market data shows teams that automate image delivery reduce page-load regressions and lower manual handoffs.
Table: Section Content — Step, Responsible Role, Deliverable & more
| Step | Responsible Role | Deliverable | Typical Duration |
|---|---|---|---|
| Creative Brief | Content Strategist | Brief + specs (formats, intent) | 1–2 days |
| Asset Production | Designer | Source files + derivatives | 2–5 days |
| Optimization/Compression | Frontend/Build Engineer | Compressed responsive assets | 1 day (automated) |
| QA & Accessibility Check | QA/Accessibility Lead | Alt text, contrast, semantic checks | 0.5–1 day |
| Publish & Schema Markup | DevOps/Publisher | CDN assets + schema/OG tags | 0.5–1 day |
Troubleshooting tips
- If images look oversharpened after compression, increase quality to
80–85%for photographic content. - If CI flags false positives on alt text, add contextual rules to the linter to allow templated content where appropriate.
- If CDN transforms change focal points, store explicit
cropmetadata in the asset manifest.
Understanding these principles helps teams move faster without sacrificing quality. When implemented correctly, automation shifts effort from repetitive tasks to higher-value visual strategy and storytelling.
📥 Download: Visual Content SEO Optimization Checklist (PDF)
Advanced Visual SEO Tactics
Optimizing images for discovery requires thinking like a search engine that "sees" and like a human who searches visually. Focus first on making visual assets unambiguous and richly described: descriptive filenames, structured product data in feeds, and clean, high-contrast product photography improve algorithmic object recognition and click-through. Treat visual discovery channels—Google Lens, Pinterest, Bing Visual Search, Instagram, TikTok—as distinct platforms with different user intent and ranking signals.
On a large scale, programmatic image generation can create personalized experiences. However, it requires careful handling of canonicalization, unique metadata, and proactive index management to prevent issues like index bloat and duplicate content penalties.
Optimizing for Visual Search and Discovery
- Descriptive filenames: Use
brand_productcolor_size.jpgpatterns to embed useful keywords. - Structured data: Add
ProductandImageObjectschema withimage,sku, andgtinto e-commerce feeds. - Clean composition: Use high-contrast, clutter-free shots for object detection and accurate cropping.
- Channel-aware assets: Create square thumbnails for Pinterest, vertical short-form assets for TikTok, and high-resolution originals for Lens.
- Discovery metadata: Include alt text with intent (e.g., "red leather ankle boots, 3-inch heel, size 8") and distinct captions per channel.
Practical implementation steps:
- Audit current image inventory and identify duplicates by perceptual hash. 2.
Standardize filenames and implement image_sitemap entries. 3. Apply ImageObject schema and ensure product feeds include canonical image URLs.
- Test recognition with Lens and Pinterest visual search tools before bulk publishing.
Expected outcome: improved object detection across channels and higher visual-search click-through rates within 4–8 weeks.
Programmatic Image Generation & Personalization
- Purposeful variants: Generate only meaningful variants tied to user intent (color, angle, localized props).
- Unique metadata per image: Attach distinct titles, alt text, and feed attributes to each generated file.
- Canonicalization strategy: Use a canonical image URL when variants are near-duplicates and a unique URL when intent differs.
- Index control: Monitor index growth; use
noindexorX-Robots-Tagfor low-value or test variants.
Implementation checklist:
- Define personalization rules (region, user-segment, A/B variants). 2.
Generate images programmatically and write accompanying metadata templates. 3. Apply canonical tags or robots rules via server headers or meta tags.
- Monitor indexation and traffic; prune or block low-performing variants.
Example canonical header:
html <link rel="canonical" href="https://example.com/images/product-123-main.jpg"> <meta name="robots" content="noindex, follow">> It is suggested that visual discovery behavior may vary by platform, indicating the need to treat each channel as a separate optimization surface.
Visual discovery channels (Google Images/Lens, Pinterest, Bing Visual Search) by user intent and optimization requirements
| Channel | User Intent | Optimization Focus | Primary Asset Requirements |
|---|---|---|---|
| Google Images / Lens | Research-to-purchase, object identification | High-res images, structured schema, image sitemaps | High-res originals, multiple angles, ImageObject schema |
| Inspiration, product discovery, planning | Aesthetic thumbnails, keyworded descriptions, vertical images | Vertical pins, text overlays, descriptive captions | |
| Bing Visual Search | Quick visual lookup, shopping comparison | Clear product shots, alt text, structured product data | Clean backgrounds, SKU/GTIN in feed, image sitemaps |
| Instagram (search/discovery) | Brand discovery, social proof | Short-form visuals, engagement-focused captions, hashtags | Square/vertical posts, UGC-style images, alt text |
| TikTok (visual discovery) | Entertainment-driven discovery, trend-based shopping | Vertical, motion-first assets, sound + visual hooks | Vertical short video, clear product close-ups, captions |
Understanding these principles helps teams move faster without sacrificing quality. When implemented with deliberate metadata and canonical rules, programmatic visuals scale personalization while protecting search performance.
Conclusion
Treating visual assets as traffic drivers rather than afterthoughts changes how search and users find content. Rework image filenames and alt text, publish an image sitemap, and prioritize responsive formats — these moves improve indexability and load performance. Teams that used structured alt text with descriptive captions and created an image sitemap saw more organic image impressions and click-throughs. Workflows that included image briefs sped up production and kept metadata consistent.
If resources are limited, focus first on high-traffic pages and evergreen assets; if you wonder how to measure impact, track image impressions, page load time, and referral traffic from image search.
- filenames and alt text: concise, descriptive, keyword-aware.
- Publish an image sitemap: makes assets discoverable faster.
- Automate metadata at scale: reduces manual errors and keeps SEO consistent.
If you want to scale visual SEO without increasing your team size, consider platforms like Scaleblogger. They can centralize metadata generation, batch processing, and performance reporting. As a practical next step, audit your top 50 landing pages for image SEO gaps, implement metadata templates, and test before rolling sitewide. See how Scaleblogger can scale your visual content and SEO
