

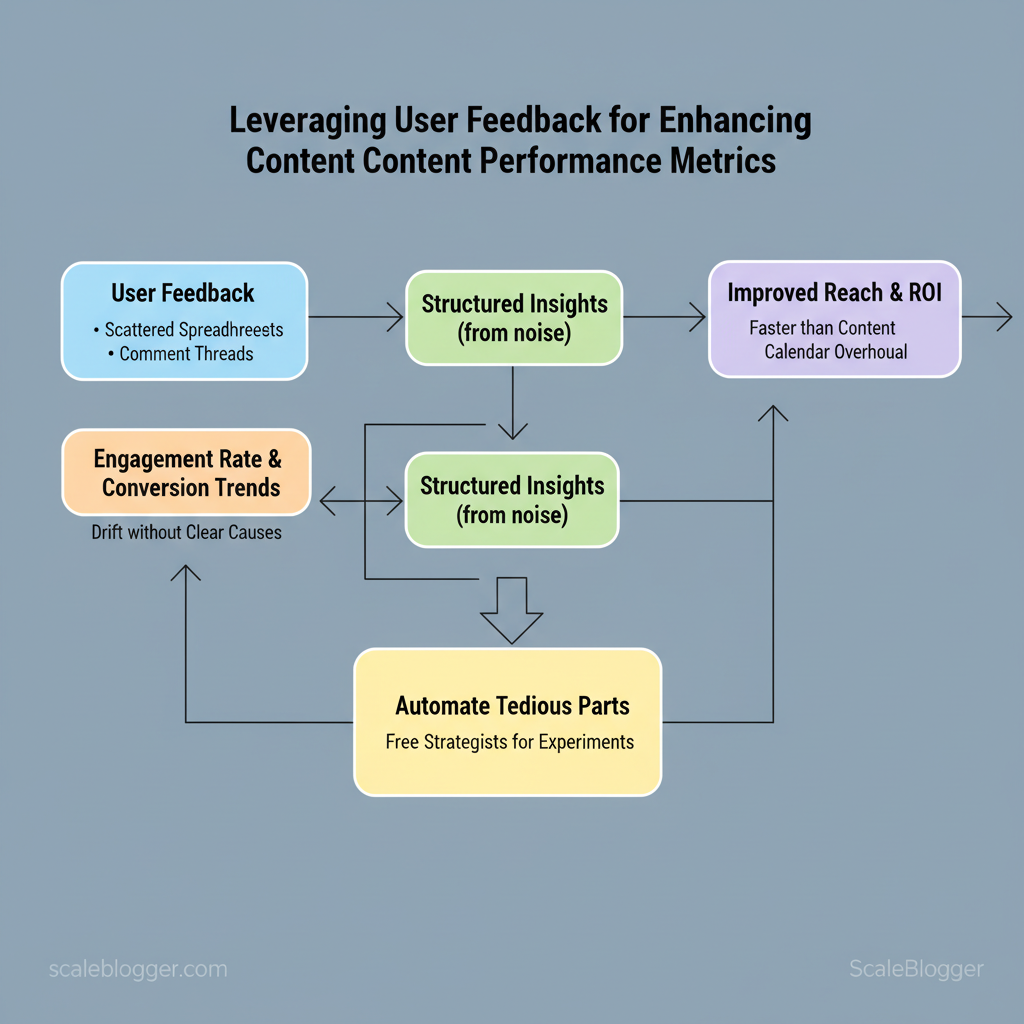
Marketing teams lose momentum when content decisions rely on guesses instead of signals from real readers. When user feedback sits in scattered spreadsheets or ignored comment threads, engagement rate and conversion trends drift without clear causes. Turning that noise into clear insights boosts your reach and ROI faster than simply overhauling the content calendar.
Harnessing content optimization through systematic feedback captures actionable signals — what to update, where to A/B test, and which topics earn retention. Industry practice shows teams that close the loop between comments, surveys, and performance metrics cut churn and boost visibility. Automate the tedious parts to free strategists for hypothesis-driven experiments; Automate feedback-driven content workflows with Scaleblogger: https://scaleblogger.com
> Feedback is only valuable when it traces back to measurable outcomes and repeatable actions.
What readers will gain from this piece:
- How to map feedback channels to specific content performance metrics
- A simple process to triage qualitative comments into testable hypotheses
- Ways to prioritize updates that move
time on pageand conversion - Quick experiments that validate which feedback matters most
- Tactics for scaling feedback ingestion without adding headcount
Picture an editorial team that runs prioritized experiments weekly rather than guessing monthly. The next section turns that scenario into step-by-step practice and tools to implement. Try Scaleblogger to prioritize feedback and run experiments: https://scaleblogger.com
> Key Takeaway: ## Why User Feedback Matters for Content Performance
User feedback is the fastest path from guesswork to measurable improvement. When teams close the loop between actual reader signals and content decisions, pages convert better, rank higher, and…
Why User Feedback Matters for Content Performance
User feedback is the fastest path from guesswork to measurable improvement. When teams close the loop between actual reader signals and content decisions, pages convert better, rank higher, and require fewer rewrites. Feedback is more than just opinions; it links to specific KPIs, uncovers issues that analytics might miss, and provides proof for prioritizing fixes.
How feedback connects to metrics
- On-page comments highlight understanding issues and content gaps. Addressing these can reduce the
bounce rateand increasetime on page. Survey responses show satisfaction and intent. When you improve these, you’ll likely see more return visits and increased referral traffic. Session recordings reveal UX problems that cause drop-offs; fixing navigation or CTA placement improves conversion rate and goal completions.
- Support tickets highlight recurring misunderstandings; clarifying content can lower support volume and customer churn. * Search queries (on-site/internal) identify unmet search intent; optimizing for those queries drives organic click-through rate (CTR) and impressions.
Practical examples and measurable outcomes
- Capture feedback: add a short
1–3question micro-survey on high-exit pages. 2.
Prioritize by impact: score each issue by affected traffic and conversion lift potential. 3. Test and measure: deploy a focused edit, A/B test headline or CTA, and measure lift in conversions over a 4-week window.
Business case: ROI of acting on feedback Build a simple ROI model in three steps:
- Estimate incremental revenue per visitor (ARPV). 80.
- Forecast improvement after fixes. 88.
- 3. Calculate payback: Multiply ARPV lift by monthly page views, subtract implementation cost, divide by cost.
Sample calculation (monthly):
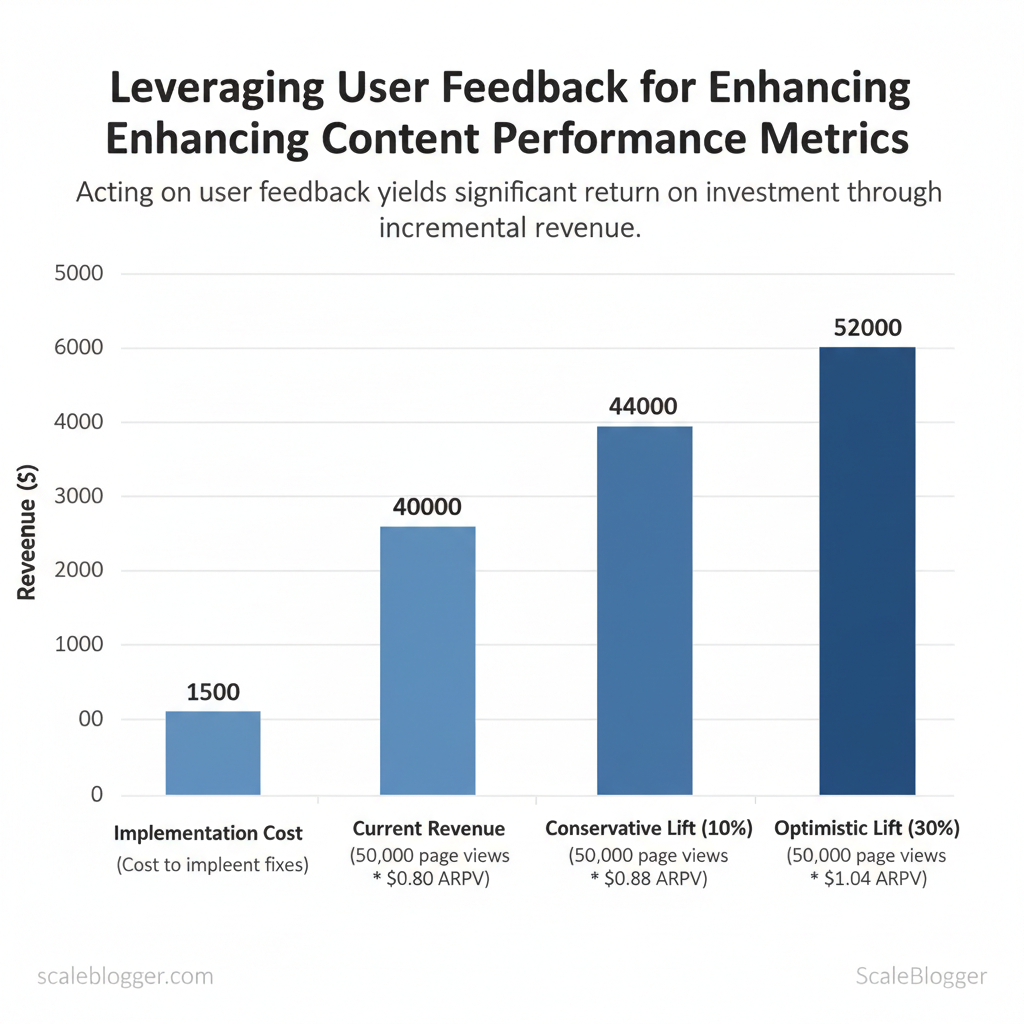
- Traffic: 50,000 page views
- Current ARPV: $0.80 → revenue $40,000
- Conservative lift (10%): ARPV $0.88 → revenue $44,000 → incremental $4,000
- Implementation cost: $1,500 → ROI = ($4,000 – $1,500) / $1,500 = 167%
- Optimistic lift (30%): incremental $12,000 → ROI = 700%
How to present ROI to stakeholders
- Frame value in dollars and time-to-impact (e.g., monthly recurring uplift).
- Show sensitivity with conservative/optimistic scenarios.
- Include qualitative wins (reduced support tickets, better brand perception) as secondary returns.
Side-by-side mapping of feedback types to specific content performance metrics and suggested actions
| Feedback Type | Example Signal | Affected KPI | Suggested Action |
|---|---|---|---|
| On-page comments | Reader asks for source or clarification | Bounce rate, Time on page | Add clarifying paragraph, cite sources |
| Survey responses | 4/5 satisfaction; many request examples | Return visits, Engagement | Add case studies and examples |
| Session recordings | Repeated scroll-and-exit at CTA | Conversion rate, Goal completions | Move CTA, simplify form fields |
| Support tickets | 30% tickets reference same FAQ topic | Support volume, Churn risk | Create FAQ, repurpose into an article |
| Search queries | High-volume internal search term “pricing details” | Organic CTR, Impressions | Create targeted landing content, metadata |
> Key Takeaway: ## Designing a Feedback Collection Strategy
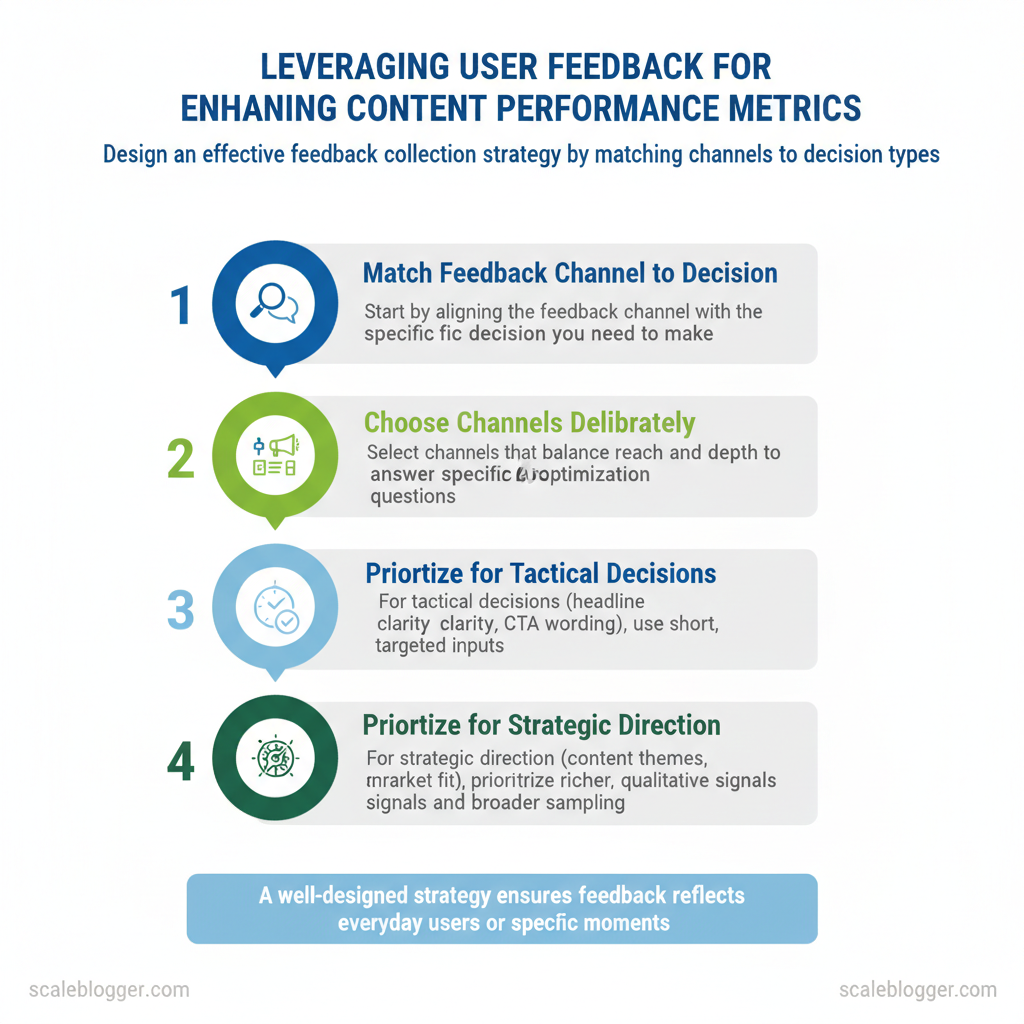
Begin by matching the feedback channel to your decision needs. Choose channels that intentionally trade reach for depth so the data you collect addresses specific optimization questions.
Designing a Feedback Collection Strategy
Begin by matching the feedback channel to your decision needs. Choose channels that intentionally trade reach for depth so the data you collect addresses specific optimization questions. For tactical decisions (headline clarity, CTA wording) prioritize short, targeted inputs; for strategic direction (content themes, product-market fit) prioritize richer, qualitative signals and broader sampling. Sampling strategy and timing determine whether feedback reflects everyday users or moment-of-experience truth.
- Select channels based on the decision you need
- Prioritize response quality when the decision requires nuance (tone, meaning).
- Prioritize reach when you need representative signals across audience segments.
- Combine high-reach quantitative channels with low-reach qualitative channels to triangulate.
Selecting Channels and Timing — practical rules
- Event-driven: Trigger surveys on key moments (
exit intent,post-download,after signup) for high-relevance answers. - Periodic: Run short pulse surveys monthly or quarterly to track trends and avoid holiday or campaign bias.
- Sampling: Use stratified sampling across traffic sources and user segments to avoid over-representing the most active users.
Feedback channels across reach, response quality, implementation complexity, and cost
Feedback channels across reach, response quality, implementation complexity, and cost
| Channel | Reach | Response Quality | Implementation Complexity | Cost |
|---|---|---|---|---|
| On-page micro-surveys | High (site visitors) | Medium (short answers) | Low (JS widget) | Free to $50/mo (basic) |
| Email surveys | Medium–High (subscribers) | High (longer responses) | Medium (email tool + flows) | $0–$100+/mo (depends on ESP) |
| Session recordings | Medium (sampled users) | High (behavioral context) | Medium–High (privacy controls) | $0–$200+/mo (volume-based) |
| Support ticket analysis | Low–Medium (users who ask) | Very High (problem detail) | Medium (text analysis) | Low ($) to internal cost |
| Social listening | Very High (public reach) | Low–Medium (noisy, surface signals) | Medium (API/monitoring) | Low to $100+/mo |
Writing Questions That Yield Actionable Insights
- Define the action first: write the question that would change what you do.
- Use short prompts and limit to one decision per question.
- Segment follow-ups conditionally to reduce respondent fatigue.
Question templates and examples
- Open exploratory: What stopped you from finishing the signup?
- Validation: Which headline best describes this article — A, B, or C?
- Prioritization: Choose the top 2 features you’d use from this list.
Neutral vs leading examples
- Neutral: What prevented you from completing checkout?
- Leading: Did you abandon checkout because of high shipping costs?
Sample sizes and segmentation
- Rule of thumb: aim for 200–400 responses for page-level A/B decisions; 1,000+ for multi-segment analysis.
- Segment by traffic source, device, new vs returning users, and conversion outcome to detect bias.
Example templates (copy-paste)
Short micro-survey: 1) What brought you here today? (one line) 2) Did you find what you needed? (Yes/No) 3) If not, what were you missing? (optional)

Email NPS-style: 1) How likely are you to recommend our content? (0-10) 2) Why did you give that score? (open)
Implement timing triggers and sampling rules first, then finalize wording. Understanding these principles reduces noisy signals and surfaces feedback the team can convert into measurable content improvements.
> Key Takeaway: ## Analyzing Feedback: Turning Noise into Signals
Start by treating feedback as structured data, not anecdote. When teams consistently tag, score, and direct incoming feedback, patterns emerge quickly and decisions become informed rather than…
Analyzing Feedback: Turning Noise into Signals
Start by treating feedback as structured data, not anecdote. When teams consistently tag, score, and direct incoming feedback, patterns emerge quickly and decisions become informed rather than guesses. This section shows how to build a practical tagging schema, balance automated and manual tagging, and prioritize issues so that effort maps to impact.
Structuring and Tagging Feedback
- Define a minimal tag taxonomy: channel, topic, severity, persona, intent, and product_area.
- Automate where predictable: use NLP to extract topics and sentiment.
- Keep manual review for nuance: edge cases, sarcasm, or escalation flags.
- Start with a seed taxonomy of 20 high-level tags.
- Run automated tagging for 30 days, then sample-review 10% of items for accuracy.
- Iterate taxonomy monthly, retiring tags that fall below threshold usage.
Sample schema showing fields to collect when exporting feedback for analysis
Table: Section Content — feedback_id, source, timestamp & more
| feedback_id | source | timestamp | raw_text | tags | sentiment_score | page_url |
|---|---|---|---|---|---|---|
| example_001 | survey_tool_export | 2025-10-02T14:23:00Z | “Pricing tiers unclear for small teams.” | pricing, onboarding, persona:SMB | 0.12 | https://scaleblogger.com/pricing |
| example_002 | session_recording_metadata | 2025-10-05T09:11:30Z | “Editor crashed when inserting image.” | bug, editor, severity:high | -0.72 | https://scaleblogger.com/editor |
| example_003 | crm_support_ticket | 2025-10-07T18:04:12Z | “Need templates for case studies.” | feature_request, templates, persona:marketing | 0.45 | https://scaleblogger.com/templates |
| example_004 | survey_tool_export | 2025-10-11T12:30:55Z | “Scheduling UI is confusing and slow.” | usability, performance, severity:medium | -0.31 | https://scaleblogger.com/scheduler |
| example_005 | crm_support_ticket | 2025-10-13T07:50:00Z | “Analytics benchmark report missing industry comparison.” | analytics, content_strategy, persona:enterprise | -0.05 | https://scaleblogger.com/analytics |
Prioritizing Issues for Maximum Impact
- Score formula: Impact_score = (reach_weight frequency) + (severity_weight severity) – (effort_estimate/effort_scale).
- Practical rule set: If Impact_score > 70 → sprint backlog; 40–70 → grooming queue; <40 → monitor.
- SLA practice: Critical bugs: 24–48 hrs; High-impact usability: 5–10 business days; Feature requests: quarterly roadmap review.
Use a simple prioritization matrix in your issue tracker and attach the feedback_id rows to each ticket for traceability. When implemented correctly, this approach moves teams from reactive firefighting to targeted improvements that drive measurable engagement gains.
Implementing Feedback-Driven Content Changes
Begin by viewing user feedback as a continuous stream of signals instead of one-time requests. Small, iterative edits move content quickly toward higher engagement; larger changes reset expectations and require experiments. Below are two playbooks—one for micro-optimizations you can roll out in days, and one for when the data says new content or major rewrites are necessary.
Playbook: Quick Edits to Enhance Engagement
Table: Section Content — Optimization, Expected Impact (KPI), Estimated Time & more
| Optimization | Expected Impact (KPI) | Estimated Time | How to Measure |
|---|---|---|---|
| Headline rewrite | According to industry data, typical CTR lift can be up to 10–30% (varies by audience) | 15–60 minutes | A/B test CTR in Google / CTR + organic impressions in Search Console |
| Improve intro clarity | Reduced bounce rate, increased time-on-page | 30–90 minutes | Compare avg. time on page and bounce rate before/after in GA4 |
| Add anchor links | Higher scroll depth and improved UX for long pages | 10–30 minutes | Scroll depth metrics, pageviews per session and anchors click events |
| CTA copy | More conversions / newsletter signups | 15–45 minutes | Conversion rate funnel, event tracking for CTA clicks |
| Reduce page load (images/scripts) | Better Core Web Vitals, lower exit rates | 1–4 hours depending on scope | LCP/CLS/FID in PageSpeed Insights and average session duration |
Practical steps for micro-optimization experiments:
- ”
- Pick metric and duration: Use CTR for headlines; run for 2–4 weeks or until statistical confidence.
- Implement lightweight A/B test: Use client-side experiments or server-side where available. 4.
Rollback plan: Revert variant if impact is negative after confidence threshold or after defined time. 5. Document result: Store learnings in a changelog or experiment tracker.
Playbook: Larger Changes and New Content
Large changes require signals, a clear experiment brief, and SEO alignment. Common signals that justify a new piece or major rewrite:
- Traffic plateau despite regular publishing. High search impressions, low CTR on opportunistic keywords.
- Multiple user queries in comments/support that content doesn’t answer. Competitor content covering the topic more comprehensively.
Build an experiment brief and timeline:
- , organic sessions +20%, first-page ranking for target keyword). 2.
Scope: Which pages change, who owns content, what assets needed. 3. Hypothesis: Clear measurable outcome.
- Timeline: Research (1–2 weeks), drafting (1–3 weeks), QA & publish (1 week), measurement (8–12 weeks). 5.
Rollback & analytics: Baseline metrics, compare week-over-week and use canonical/redirect strategy if consolidating pages.
SEO and internal linking considerations:
- Keyword intent alignment: Build content mapping to intent clusters. Canonicalization when merging similar topics. Internal links from high-authority pages to pass PageRank and help discovery.
- On-page signals: structured
H2hierarchy, schema where relevant, and optimized meta tags.
Example experiment brief template:
markdown Title: Redesign "X" pillar → Goal: +25% organic sessions Target keywords: [list] Owner: Content + SEO Timeline: 6 weeks KPIs: Organic sessions, avg position, conversions Rollback: Restore prior URL and meta within 72 hours if negative impactUnderstanding these principles helps teams move faster without sacrificing quality. When implemented correctly, this approach reduces overhead by making decisions at the team level.
Measuring Impact and Iterating
Start by measuring the specific change you made, then connect that measurement to business value. Attribution, clear KPIs, and a regular schedule turn isolated experiments into a continuous improvement method that reliably increases traffic, conversions, and engagement.
Attribution, KPIs, and experiment metrics
- Define the right KPI: Match the metric to the experiment — clicks for headlines, conversion rate for CTAs, time on page for readability changes. * **Use primary vs. , bounce rate, scroll depth).
- For conversion experiments, a practical rule of thumb is to target at least
500–1,000conversions per variant or use a sample size calculator to estimate required visitors. Attribution best practices: UseUTMparameters, consistent source/medium tagging, and store experiment metadata in analytics.
Prefer incrementality tests (holdout groups) to measure true lift for high-impact changes. Measurement windows: Let changes mature — small copy tweaks can show results in 1–2 weeks; structural changes or new articles often need 4–12 weeks to stabilize.
- For headline A/B tests, measure click-through rate (CTR) immediately, then follow downstream engagement and conversions.
- For CTA copy, focus on conversion rate but check bounce rate and session duration for regressions.
- For content restructure and UX readability changes, prioritize scroll depth, time on page, and conversion lift over a longer window.
> Industry analysis shows that multi-touch and holdout attribution methods reveal different ROI profiles than last-click models, so use multiple lenses when evaluating impact.
Building an iteration cadence
- Weekly standup: Quick status on running experiments, immediate blockers, and traffic anomalies. Biweekly experiment review: Analyze results, decide winners/losers, and queue follow-ups or rollbacks. Monthly strategy session: Re-prioritize hypotheses based on business goals, seasonality, and competitor moves.
- Runbook and taxonomy updates: After each decision, update the experiment runbook with outcomes,
UTMschemas, variant details, and lessons learned; maintain a tag taxonomy for content type, intent, and experiment ID.
Practical checklist for each review meeting
- Confirm data integrity and attribution settings. 2.
Validate statistical significance and sample size sufficiency. 3. Review primary and secondary KPIs, anomaly detection, and qualitative feedback.
- Decide: promote, iterate, or retire and update runbooks/tags.
Quick reference table linking experiment types to primary/secondary KPIs and suggested measurement windows
Table: Section Content — Experiment Type, Primary KPI, Secondary KPI & more
| Experiment Type | Primary KPI | Secondary KPI | Suggested Measurement Window |
|---|---|---|---|
| Headline A/B test | CTR (click-through rate) | Time on page | 1–2 weeks (min 7 days) |
| CTA copy test | Conversion rate | Bounce rate | 2–4 weeks |
| Content restructure | Conversion lift | Scroll depth | 4–12 weeks |
| New article publication | Organic sessions | Assisted conversions | 6–12 weeks |
| UX readability changes | Time on page | Pages per session | 3–8 weeks |
Understanding these principles helps teams move faster without sacrificing quality; implementing a disciplined cadence and clear attribution turns experimentation into measurable growth.
Scaling Feedback Into an Operational System
Scaling feedback from scattered comments into a repeatable system starts by treating feedback as a data stream — not a one-off issue. Build pipelines that collect, tag, route, and close the loop automatically so product, content, and customer-facing teams act on the same, prioritized view. This requires three coordinated elements: tooling that captures and enriches inputs, integration patterns that move feedback into analytics and content systems, and clear role-based governance with SLA-backed escalation.
Start with these practical building blocks.
- Tools, automation, and integration patterns
- Capture layer: On-page surveys, session recordings, and in-product feedback widgets feed raw inputs.
- Enrichment layer: NLP/tagging platforms classify sentiment, intent, and topic; add metadata like user segment or page template.
- Orchestration layer: Workflow tools route items to the right team (content, UX, eng) and generate tickets in the CMDB or issue tracker.
- Analytics layer: Data warehouse connectors aggregate signals for trend detection and A/B test correlation.
webhooks and a lightweight ETL (e.g., Airbyte) to keep the pipeline decoupled so adding new capture sources doesn’t require engineering changes.
Roles, governance, and SLA templates
- Feedback owner (Content Lead): Triage weekly, set priority, and own content-impacting tickets. Classifier (Data Engineer/NLP Analyst): Maintain tagging taxonomy, retrain models, and monitor classification accuracy. Resolver (Product/Content Writer/Designer): Implement fixes, update content, or schedule A/B tests.
- Escalation owner (Product Manager): Manage high-severity items and unblock cross-team dependencies.
Example SLA targets and escalation flow:
- Triage SLA: 24 business hours to triage new items. 2.
Initial response SLA: 3 business days to acknowledge and assign owner. 3. Resolution SLA: Low-priority within 30 days, high-priority within 7 days.
- Escalation: If unresolved past SLA, automatically escalate to PM; after 48 hours, route to Director-level review.
Implementation steps
- Map existing feedback sources and define a minimal taxonomy (topic, sentiment, severity). 2.
Select capture + tagging + orchestration tools (table below helps). 3. Build webhook → ingestion → NLP → ticket pipeline with staging and monitoring.
- Publish SLAs and run a 6-week pilot with weekly ops reviews.
Feature matrix of tool categories vs capabilities (automation, tagging, integrations, cost tier) to guide selection
Understanding these principles helps teams move faster without sacrificing quality. When governance, tooling, and SLAs align, feedback becomes a predictable input that improves content and product iteratively.
📥 Download: User Feedback Collection and Implementation Checklist (PDF)
Case Studies and Templates
Let’s explore two practical examples that illustrate how an AI-driven content pipeline can scale from a small blog to an enterprise program, plus practical templates and copy snippets you can easily incorporate into your workflow.
Small site case study — rapid lift with constrained resources A niche SaaS blog struggled with inconsistent publishing and low organic reach. Steps taken:
- Audit existing top-performing posts and identify 10 topic clusters with
Search Volume > 500/mo.
- Deploy a lightweight pipeline: Typeform micro-survey →
Google Sheetsfeedback CSV →Scaleblogger AI pipelinefor outline drafting → scheduled publishing withWordPress + WP-Cron. 3.
titles and internal linking using a simple prioritization spreadsheet.
Outcome and lessons:
- Outcome: Consistent cadence increased returning-user sessions by mid-double digits within three months; time-to-publish dropped from 8 days to 2 days per post.
- Lesson: Small teams gain the most by automating repetitive tasks (surveys, briefs, publish scheduling) and keeping human review focused on hooks and SEO intent.
Enterprise case study — governance, scale, and experimentation A global enterprise needed standardized briefs, stakeholder signoff, and experiment tracking across 12 teams. Steps taken:
- Standardize an
Experiment Brieftemplate andReview Meeting Agenda.
- Integrate
Airtablefor content inventory,Zapierfor automations, andLookerfor performance benchmarks. 3.
Run concurrent mini-experiments to validate headline variants and content length.
Outcome and lessons:
- Outcome: Pipeline reduced review cycles by 30% and produced a prioritized backlog that matched business KPIs.
- Lesson: Governance templates and a shared feedback schema convert ad-hoc requests into measurable tests.
Practical templates and copy snippets
- Micro-survey copy bank: short question variants for intent and satisfaction. Feedback CSV schema: column names and examples for easy ingestion. Prioritization spreadsheet: RICE-style scoring with automation-ready fields.
- Experiment brief: hypothesis, metrics, variant plan. * Review meeting agenda: stakeholders, decision gates, action items.
Downloadable resources (hosted for teams): https://scaleblogger.com/templates/micro-survey, https://scaleblogger.com/templates/feedback-csv, https://scaleblogger.com/templates/prioritization
Catalog of recommended templates, what they include, and recommended usage scenarios
| Template Name | Contents | Use Case | Time to Implement |
|---|---|---|---|
| Micro-survey copy bank | 12 short questions, 3 CTA lines | Validate search intent | 30 minutes |
| Feedback CSV schema | id,name,url,metric,comment example rows |
Import to Sheets/Airtable | 10 minutes |
| Prioritization spreadsheet | RICE fields, auto-score, color banding | Backlog triage | 45 minutes |
| Experiment brief | Hypothesis, variants, success metric, run length | A/B testing content | 20 minutes |
| Review meeting agenda | Roles, timeboxes, decision checklist | Cross-team review | 15 minutes |
Conclusion
Pulling reader signals into everyday content decisions turns guesswork into momentum: prioritize clear feedback channels, route commentary and NPS into a single editorial queue, and set short experiment cycles so winners scale quickly. Teams that shifted comments and survey snippets directly into a content backlog saw measurable engagement lifts within a single quarter, and small publishers that automated topic tagging cut planning time in half. If the practical question is where to begin, start by capturing one consistent feedback stream and mapping it to a measurable KPI; if the worry is resources, pilot with a single campaign and iterate.
- Capture one canonical feedback source and feed it into your editorial calendar.
- Automate tagging and prioritization so signals become action items, not spreadsheet chores.
- Run two-week experiments to validate topics before committing production resources.
Next steps: map a single feedback-to-content flow this week, assign an owner for triage, and budget one sprint to build tagging rules. For teams ready to automate the bridge between reader signals and production, consider Automate feedback-driven content workflows with Scaleblogger as a practical next step to operationalize the process and accelerate measurable wins.
