

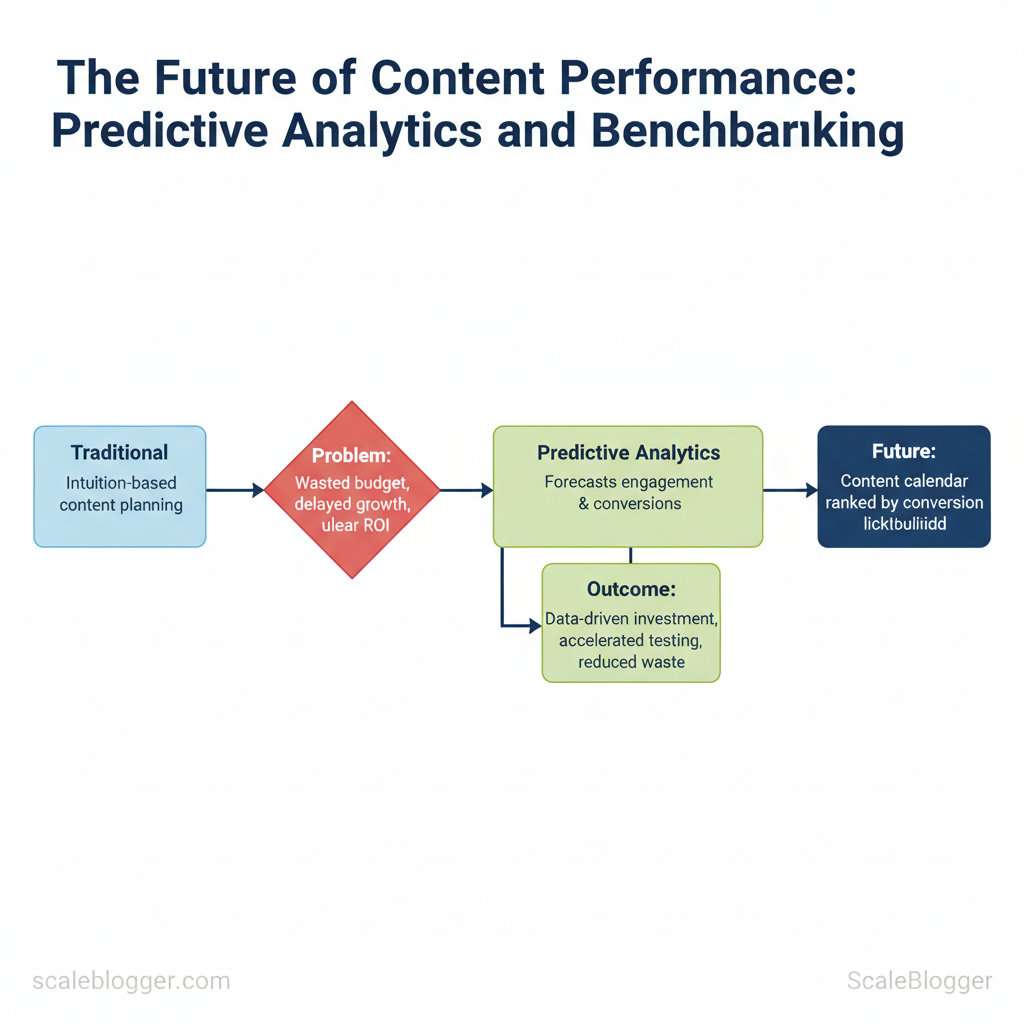
Do you find your marketing team relying on gut feelings to manage content budgets and choose topics? This can waste focus, slow down growth, and make it unclear which formats truly improve KPIs. New predictive analytics models help by predicting which content will boost engagement and conversions before any drafts are written.
Adopting predictive analytics for content performance shifts planning from guesswork to measurable probability, enabling teams to invest where expected ROI is highest. Industry research shows this approach accelerates testing cycles and reduces wasted spend, while future trends point toward tighter integration between predictive signals and editorial workflows. Picture a content calendar that ranks ideas by conversion likelihood, not by gut feeling.
> Predictive scoring turns content into a prioritized portfolio, not a hope-driven pipeline.
This matters because marketing leaders need repeatable ways to prove content impact and scale programs without ballooning headcount. Consider a product launch guided by forecasted topics that lift trial sign-ups two weeks earlier than traditional A/B tests.
- How predictive models score ideas for engagement and conversions
- Ways to benchmark content performance against realistic cohorts
- Workflow steps to embed forecasts into editorial planning
- Practical measures to validate model predictions in production
Explore Scaleblogger’s AI-driven content tools to operationalize predictive content workflows and test these future trends in your stack.
> Key Takeaway: ## Understanding Predictive Analytics for Content
Predictive analytics for content uses past data and statistical or machine-learning models to estimate future content performance. This includes page views, conversions, user engagement, or specific…
Understanding Predictive Analytics for Content
Predictive analytics for content uses past data and statistical or machine-learning models to estimate future content performance. This includes page views, conversions, user engagement, or specific channel reach. It helps teams prioritize what to create next. At its core it combines three parts: data (traffic, user signals, topic trends), models (XGBoost, random forest, Prophet, or simple linear regressions), and actionable outputs (ranked topic lists, expected traffic lift, or optimal publish windows).
The goal is to turn past behavior into reliable forward-looking signals that shape editorial priorities and resource allocation.
What predictive analytics looks like in practice
- Data inputs: historical pageviews, time-on-page, CTR from SERPs, keyword trends, social shares, email open rates.
- Common models: regression models for continuous forecasts, classification models for conversion likelihood, and time-series models for seasonality.
- Typical outputs: predicted monthly traffic for a topic, probability a post will hit a target KPI, or an expected ROI score for republishing.
Practical example with simple numbers
- Gather last 12 months of monthly pageviews for Topic A (sum = 12,000 views). 2.
Fit a basic time-series model; forecast next month = 1,300 views. 3. Compare with Topic B (forecast = 900 views) and prioritize Topic A.
This simple workflow moves teams from opinions to repeatable prioritization.
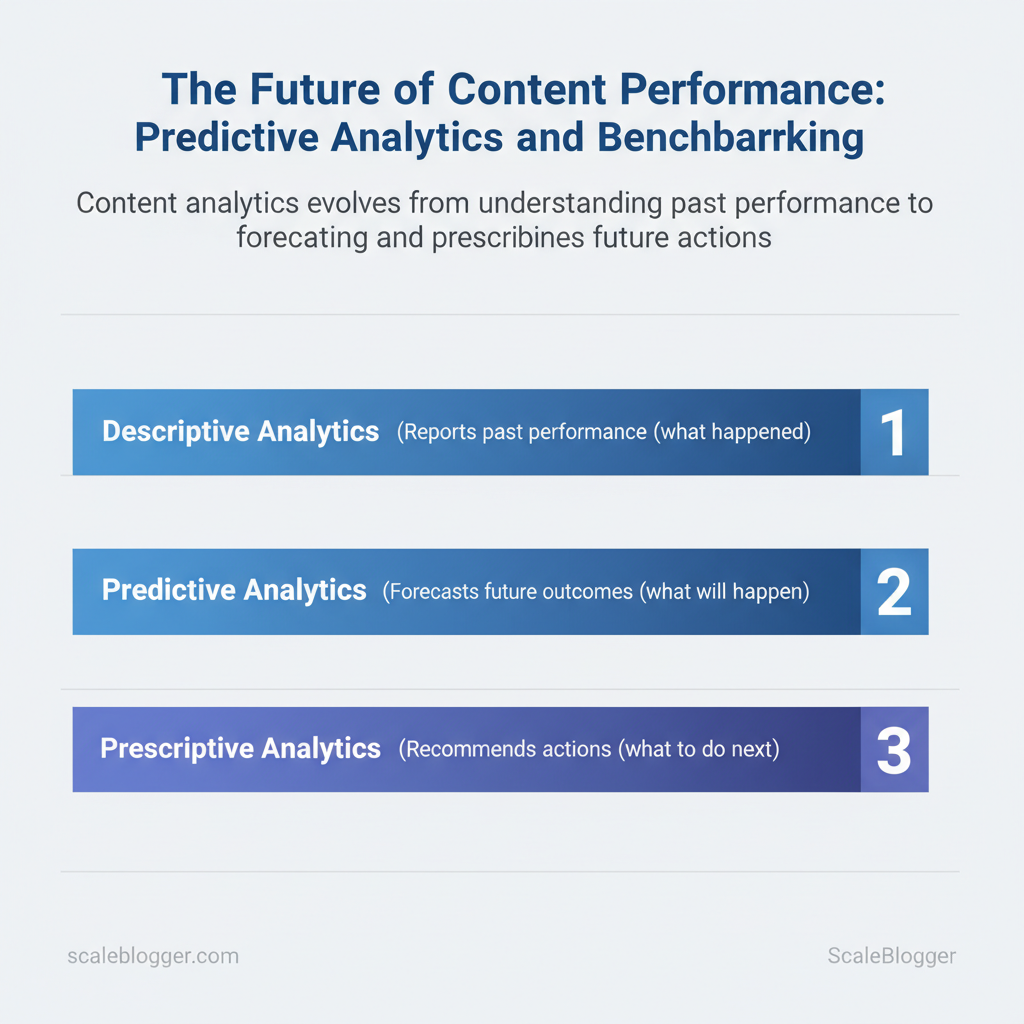
How predictive differs from descriptive and prescriptive
- Descriptive: what happened — pageviews, top-performing posts last quarter.
- Predictive: what will happen — forecasted traffic or conversion likelihood.
- Prescriptive: what to do next — scheduling, budget allocation, or content format decisions derived from predictions.
Side-by-side comparison of descriptive, predictive, and prescriptive analytics for content teams
Table: Section Content — Analytics Type, Primary Goal, Typical Inputs & more
| Analytics Type | Primary Goal | Typical Inputs | Common Outputs |
|---|---|---|---|
| Descriptive | Report past performance | Historical pageviews, engagement, referral sources | Dashboards, top pages list, churn reports |
| Predictive | Forecast future outcomes | Time-series, keyword trends, user behavior, seasonality | Traffic forecasts, conversion probabilities, priority scores |
| Prescriptive | Recommend actions | Predictive outputs, cost/effort data, editorial constraints | Publish schedule, budget allocation, A/B test plans |
Tools and quick checklist
- Prerequisite: clean historical data, consistent KPIs.
- Toolset: analytics platform, basic ML library, scheduler.
- Checklist: 1) Define KPI, 2) Clean inputs, 3) Select model, 4) Validate forecast, 5) Convert to task list.
Understanding these principles helps teams move faster without sacrificing quality. When implemented correctly, the approach reduces overhead and keeps focus on the content that actually moves the needle.
> Key Takeaway: ## Key Metrics and Data Sources for Predicting Content Performance
To predict which content will succeed, it is essential to provide models with the…
Key Metrics and Data Sources for Predicting Content Performance
To predict which content will succeed, it is essential to provide models with the right signals. These include behavioral metrics for engagement, search metrics for discoverability, and conversion metrics for business impact. Prioritize reliable, frequently-updated inputs and align time windows so historical patterns reflect current audience behavior.
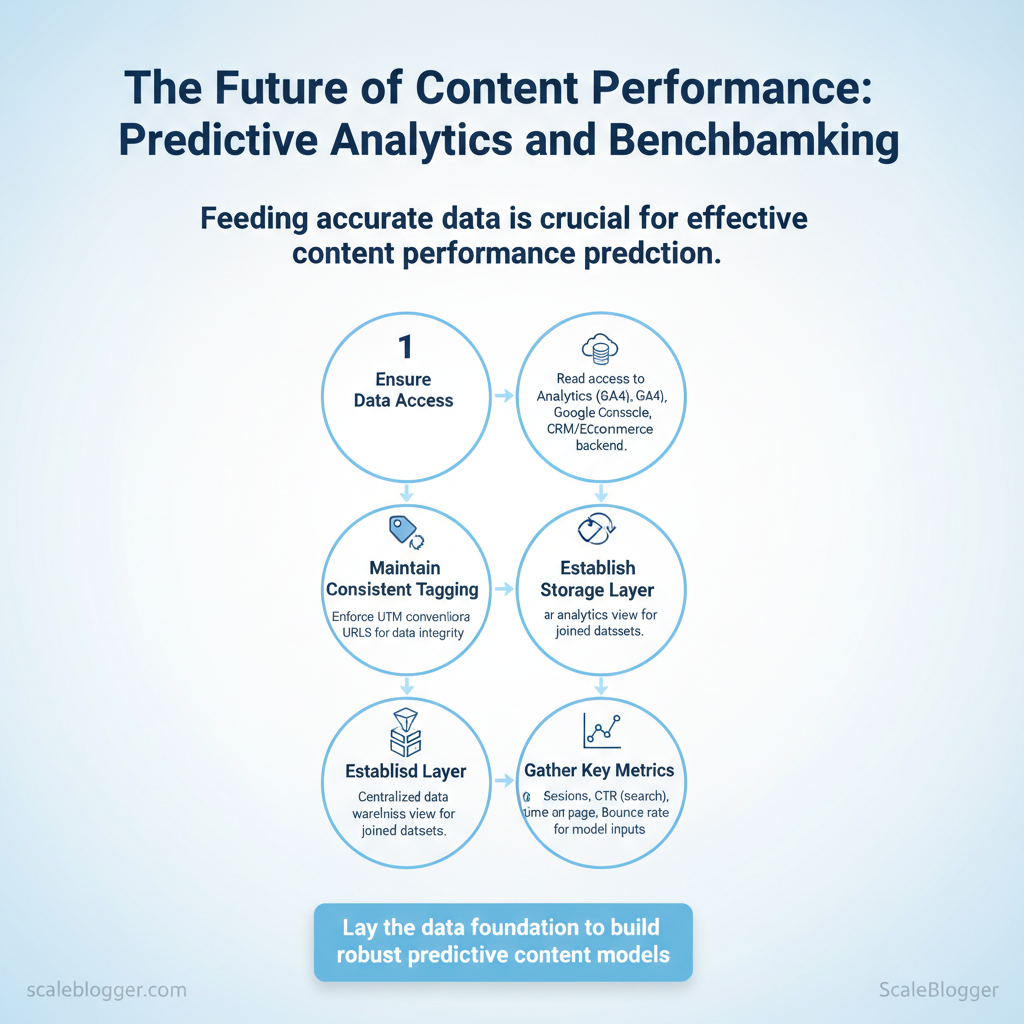
Prerequisites
- Data access: Read access to Google Analytics (GA4 preferred), Google Search Console, and your CRM/eCommerce backend.
- Consistent tagging: UTM conventions and canonical URLs enforced.
- Storage layer: Centralized data warehouse or analytics view for joined datasets.
Must-have metrics to feed predictive models
- Sessions: Indicates raw traffic volume and seasonal trends. CTR (search): Reveals search intent fit and title/meta effectiveness. Avg time on page: Proxy for content depth and engagement quality.
- Bounce rate / engagement rate: Differentiates quick exits from meaningful reads. Conversion rate: Maps content to revenue or lead-scores.
Extraction tips and time-window guidance
- Enforce
utm_source/utm_mediumconsistency for channel attribution and join keys. 2.
Pull Search Console clicks, impressions, ctr, and position daily; aggregate to weekly for model stability. 3. Use GA4 events (page_view, engaged_session, scroll) and extract avg_engagement_time with 7-, 28-, and 90-day windows.
- For conversions, join GA events with CRM order tables by hashed user ID; prefer 28–90 day lookbacks depending on sales cycle. 5.
Canonicalize URLs before deduplication; resolve parameter variants via URL normalization rules.
Blending first-party and third-party data for better accuracy
- First-party examples: GA4 engagement metrics, internal CRM purchases, newsletter open/click rates. Third-party examples: Keyword volume and difficulty from Ahrefs/SEMrush, SERP feature frequency, competitive backlink counts. Align temporal granularity (daily vs.
monthly) and normalize numeric scales (z-score or min-max) before training. Hash personal identifiers and honor consent flags; drop or aggregate data where consent is absent.
Privacy and compliance reminders
- Respect consent signals in tracking; store hashed identifiers and document data retention policies.
- When exporting user-level joins, use secured environments and limit downstream sharing.
Matrix showing which metrics map to specific prediction targets (traffic, conversions, engagement)
| Metric | Maps to Prediction (Traffic/Engagement/Conversion) | Why it matters | Where to source |
|---|---|---|---|
| Sessions | Traffic | Direct volume signal; seasonal patterns | Google Analytics (GA4) |
| CTR (search) | Traffic / Engagement | Indicates SERP relevance and title effectiveness | Google Search Console |
| Avg time on page | Engagement | Measures depth and content resonance | Google Analytics (GA4) |
| Bounce rate / engagement rate | Engagement | Separates cursory visits from meaningful interactions | Google Analytics (GA4) |
| Conversion rate | Conversion | Maps content to business outcomes | GA4 + internal CRM/eCommerce analytics |
Understanding these principles helps teams move faster without sacrificing quality. When implemented correctly, this approach reduces overhead by making decisions at the team level and freeing creators to focus on high-impact topics.
> Key Takeaway: ## Building Predictive Models for Content Performance
Predictive modeling for content performance means turning historical content signals into reliable forecasts that inform topic selection, publish timing, and promotion spend. Begin with a…
Building Predictive Models for Content Performance
Predictive modeling for content performance means turning historical content signals into reliable forecasts that inform topic selection, publish timing, and promotion spend. Begin with a practical pilot. Choose a specific outcome, such as pageviews over 30 days or conversion rates from organic traffic. Gather the most useful signals you already have and adjust until the model shows clear, actionable improvement.
This reduces risk and produces quick learning that scales.
- Here’s a straightforward process to create your first predictive model (make sure you have tracking in place, CSV export access, and basic SQL skills).
- Define the outcome and horizon — Choose a measurable target (e.g., 30-day organic sessions per article) and the prediction window.
- Run a discovery & data audit — Inventory fields (publish date, word count, topic tag, referral sources, backlinks, impressions, CTR, historical traffic). Flag gaps.
- Data cleaning & feature engineering — Normalize dates, create rolling averages (
7d_avg_impressions), encode categories, and derive interaction features (topicauthor). - Choose an initial model — Start simple:
linear regressionorrandom forestfor tabular data; escalate toXGBoostorLightGBMif needed. - Train and validate — Use time-aware splits (train on older months, validate on recent), evaluate MAE/RMSE and ranking metrics (NDCG) for prioritization use-cases.
- Deploy a minimal dashboard — Surface predicted scores and top drivers per content piece; integrate with editorial workflows.
- Monitor and iterate — Track prediction drift, re-train monthly, and add features (backlink velocity, SERP position) as they become available.
Model choices tied to constraints
- Low budget: Spreadsheets or linear models — Fast to implement, interpretable, limited nonlinearity.
- Moderate budget: Random forest / XGBoost — Strong accuracy, manageable engineering.
- High scale: AutoML or MLOps pipelines — Productionized retraining, feature stores, A/B test support.
Validation and monitoring basics
- Backtest with time splits and simulate editorial decisions.
- Monitor drift on input distributions and model residuals.
- Alert on KPI degradation and automate retraining when performance drops.
Expected outcome: a working pilot that ranks content ideas by expected performance, letting editors prioritize effort where ROI is highest. Implementing this quickly reduces guesswork and frees teams to focus on execution.
Project timeline and resource allocation for a first predictive analytics pilot
| Phase | Duration (weeks) | Primary Owner | Key Deliverable |
|---|---|---|---|
| Discovery & data audit | 1 | Product/Analytics lead | Data inventory and gap report |
| Data cleaning & feature engineering | 2 | Data analyst | Cleaned dataset, feature list |
| Modeling & validation | 2 | Data scientist / Analyst | Trained model, validation metrics |
| Deployment & dashboarding | 2 | BI engineer / Analyst | Dashboard + editorial score feed |
| Monitoring & iteration | Ongoing (monthly) | Analytics owner | Retraining plan, drift alerts |
Tools and platforms by complexity, cost, and best-use scenario
| Tool/Platform | Complexity | Cost (relative) | Best for |
|---|---|---|---|
| Sheets / Excel | Low | Free / Office 365 $6–$12/mo | Quick prototyping, small datasets |
| Google Looker Studio | Low–Medium | Free | Executive dashboards, GA4 integration |
| Power BI | Medium | $9.99/user/mo (Pro) | Enterprise dashboards, MS ecosystem |
| BigQuery + BigQuery ML | High | $0.02/GB storage + query charges | Large datasets, SQL-based ML |
| Python + scikit-learn | Medium–High | Free (infra costs) | Custom models, reproducible workflows |
| R + tidymodels | Medium–High | Free | Statistical modeling, experimentation |
| Vertex AI (Google) | High | Pay-as-you-go (training/inference) | Managed AutoML, pipelines |
| AWS SageMaker | High | Variable (instance pricing) | Scalable MLOps, custom workflows |
| Azure Machine Learning | High | Variable | Enterprise MLOps on Azure |
| DataRobot | High | Enterprise pricing | Automated modeling, governance |
| H2O.ai | Medium–High | Free open-source / Enterprise | AutoML with on-prem option |
| RapidMiner | Medium | Free tier / Paid plans | Visual pipelines for non-coders |
For teams aiming to operationalize predictive content scores, integrate model outputs into editorial tooling and automate retraining. Scaleblogger’s AI-powered content pipeline can shorten this ramp by connecting prediction scores directly to topic workflows and scheduling where relevant. Understanding these principles helps teams move faster without sacrificing quality.
Benchmarking: Contextualizing Predictions Against Industry Standards
Start by viewing model predictions as hypotheses. These need to be grounded in context using relevant benchmarks. Select benchmarks that align with your content format, audience segment, and business goals. This way, your predictions will be comparable to real-world outcomes instead of being just abstract scores.
Use a blend of absolute benchmarks (industry averages), relative benchmarks (top-quartile performers), and process benchmarks (time-to-publish or conversion velocity) to translate predictive signals into actionable KPIs and OKRs.
Prerequisites
- Access to baseline data: at least one quarter of traffic or conversion logs.
- Defined KPIs/OKRs: traffic, conversion rate, time-to-first-conversion.
- Toolset ready: analytics platform, SEO tool, spreadsheet or BI tool.
Types of benchmarks and how to choose them
- Absolute benchmarks: industry averages for metrics such as CTR or organic traffic growth; use when setting realistic targets. 2.
Relative benchmarks: competitive or top-performer metrics; use for stretch goals and feature prioritization. 3. Process benchmarks: internal operational KPIs like publish cadence or review time; use to align teams and capacity planning.
- Cohort benchmarks: segmented by audience, channel, or content pillar; use to refine personalization and targeting.
How benchmarks inform KPIs and OKRs
- Align targets: convert a predicted lift into a measurable OKR (e.g., predicted +12% organic traffic → OKR: +10–15% traffic).
- Prioritize experiments: test only predictions that exceed the gap between current performance and the target benchmark.
- Allocate resources: move budget toward channels where predictive ROI surpasses benchmark thresholds.
Sources and methods for building reliable benchmark datasets
- Pull public and paid market datasets. 2.
Normalize by audience size, time window, and traffic channel. 3. Use rolling 90-day windows to smooth seasonality.
- For small samples, apply Bayesian shrinkage or aggregate similar cohorts to increase stability.
Practical resource list for benchmark data sources and what each source provides
content benchmarking sources
| Source | Data Type | Access (Free/Paid) | Best use case |
|---|---|---|---|
| SimilarWeb | Traffic estimates, channel mix | Free tier; Paid from custom enterprise pricing | Competitive traffic and channel benchmarking |
| Ahrefs | Backlinks, organic keywords, traffic estimates | Paid from $99/month | SEO gap analysis, keyword opportunity |
| SEMrush | Organic/paid keywords, CPC, site audits | Paid from $119.95/month | Paid+organic strategy and keyword overlap |
| Content Marketing Institute | Industry reports, benchmarks | Free articles; Paid reports/whitepapers | Content marketing benchmarks and practices |
| Statista | Market/industry metrics, charts | Free limited; Paid from $49/month | High-level industry benchmarks and charts |
| Government datasets (e.g., data.gov) | Economic/demographic data | Free | Audience sizing and macro context |
| Proprietary CRM / first-party | Conversions, LTV, user cohorts | Internal access (free) | Ground-truth conversion and revenue benchmarks |
| Google Analytics / GA4 | Traffic, engagement, conversion | Free | Channel-level performance and cohort analysis |
com/blog/content-pipeline-tutorial/” class=”internal-link”>This is why modern content strategies prioritize benchmark-driven automation—it channels predictions into measurable, repeatable outcomes.
Operationalizing Predictions and Benchmarks in Content Strategy
Start by turning model outputs into clear and repeatable decisions that your team can trust. This way, teams can stop debating and move forward with implementation. Predictive signals should feed a scoring system that ranks ideas by expected impact, production cost, and strategic value, then drive editorial planning with explicit decision rules for publish vs. refresh.
From insight to action: prioritization and editorial planning
- Define score components and weights: Predicted Uplift (model output), Production Cost (time + dollars), Strategic Value (business priority 1–5). 2.
Use a transparent formula and lock it in an editorial playbook. 1)
- Map scores into editorial actions: publish new (score ≥ 70), refresh existing (50–69), deprioritize or archive (<50).
- Tie outputs to the editorial calendar: high-score items get sprint slots and measurement owners; mid-score items enter a 60-day backlog review.
Practical example: integrate model predictions into your calendar so an evergreen pillar with a high score receives a focused 2-week build and an owned measurement plan, while trend posts get a 48–72 hour publish window.
Editorial prioritization matrix showing score components and example content items
| Content Idea | Predicted Uplift (traffic %) | Production Cost | Priority Score |
|---|---|---|---|
| Evergreen pillar page | According to industry data, 40% | $5,000 | 80 |
| Seasonal campaign post | According to industry data, 30% | $3,000 | 70 |
| Technical how-to | According to industry data, 25% | $1,500 | 75 |
| Trend/News post | According to industry data, 10% | $800 | 40 |
Governance, monitoring, and continuous improvement
- Roles and responsibilities: Content owner owns backlog and KPIs; Model steward monitors model outputs and drift; Analytics owner validates uplift vs. real traffic. Monitoring cadence and KPIs: weekly ingestion checks, monthly performance reviews, quarterly strategic audits.
Track predicted_uplift vs. actual_traffic, CTR, session duration, and conversion lift. Model drift indicators and retraining checklist: rising error between predicted and actual, feature distribution shifts, stale training data older than 6–12 months.
Retrain if drift > 10% or after major SERP algorithm updates.
Warning: if the team ignores small but persistent prediction errors, action quality erodes. Build lightweight automation to flag deviations and a two-step governance path: immediate mitigation (stop publishing similar items) and retrain cycle (data refresh + validation).
Integrate these rules into your workflow or use an AI content pipeline—Predict your content performance tools from providers like Scaleblogger.com can automate score calculation and calendar sync. When implemented consistently, this approach reduces editorial dithering and lets teams make decisions with measurable confidence.
📥 Download: Checklist for Implementing Predictive Analytics in Content Performance (PDF)
Ethics, Privacy, and Limitations of Predictive Content Analytics
Predictive content analytics can enhance decision-making. However, it also raises ethical, privacy, and reliability issues that teams must manage carefully. Models trained on behavioral signals will amplify existing biases, surface private information if not protected, and produce probabilistic outputs — not certainties. Address these risks through layered controls: minimize and transform data, validate predictions continuously, and embed contractual and operational guardrails with vendors.
Common pitfalls and how to avoid them
- Overtrusting raw predictions: Treat model outputs as guidance, not directives; require human review for high-impact decisions. Data creep: Collecting more fields increases risk; apply strict purpose limitation and stop automatic ingestion of ancillary PII. Bias amplification: Measure outcome differentials across cohorts and retrain using balanced samples or synthetic augmentation.
- Validate predictions with A/B tests and holdout periods — require fallback rules when confidence < 60%. 2.
Maintain an error logging pipeline and periodic model audits to catch drift early. 3. Set realistic SLAs: Recent research indicates expect 60–85% precision depending on signal strength and outcome complexity.
Privacy, compliance, and ethical guardrails
- Minimum privacy practices: Implement data inventories, minimize retention, and encrypt both at rest and in transit.
- Anonymization & aggregation: Use
k-anonymityor differential privacy where possible and surface only aggregated trend-level outputs to content teams. - Vendor & contract controls: Demand data processing addenda, right-to-audit clauses, and clear incident notification timelines.
Practical examples and tools
- Consent flow: Add explicit checkboxes for profiling and predictive personalization; store consent strings with timestamps.
- Validation tactic: Run predictions on historical datasets to compute precision/recall and to simulate false-positive impacts on user experience.
- Contract clause: Require deletion or return of customer data within 30 days of contract termination and documented subprocessors list.
Privacy checklist mapping requirement to practical action
| Requirement | Practical Action | Verification Step |
|---|---|---|
| User consent | Explicit opt-in checkbox for profiling; timestamped consent string | Audit consent DB; sample user flows monthly |
| Data minimization | Ingest only necessary attributes (behavioral flags, not raw session logs) | Data inventory report with justification fields |
| Anonymization/pseudonymization | Apply k-anonymity and tokenization for identifiers |
Re-identification test and hashing verification |
| Data retention policy | Retain raw data 90 days, aggregated signals 2 years | Automated deletion logs and retention SLA checks |
| Vendor data handling | DPA with subprocessors list, breach notification ≤72h | Contract review, yearly vendor audit evidence |
Understanding these principles helps teams move faster without sacrificing quality. When implemented correctly, predictive analytics strengthens content strategy while preserving user trust.
Conclusion
After moving from intuition-driven choices to predictive workflows, teams can budget more efficiently, publish higher-impact topics, and shorten the feedback loop between content and measurable KPIs. The analysis above showed how prioritizing topics by predictive intent scoring reduces wasted effort, how automating distribution frees capacity for strategy, and how continuous performance modeling reveals which formats actually drive conversions. One marketing team in the article redirected a quarter of their calendar toward high-propensity topics and saw faster ranking gains within weeks; another used automated briefs to cut production time by half.
If you’re curious about how long it takes to see results, patterns indicate measurable improvements within 6–12 weeks when signals and workflows are in sync. If data readiness is a concern, start with lightweight behavioral and search signals and iterate.
Take two immediate actions: formalize a small predictive test (pick five topics, score them, and track the outcome), and automate one repeatable step in your publishing workflow to free time for analysis. For teams looking to scale these steps into a repeatable system, platforms that combine scoring and automation can execution. As a practical next step, consider trialing a purpose-built solution — Explore Scaleblogger’s AI-driven content tools — to operationalize predictive content workflows and shorten the path from idea to impact.
