When your blog gets traffic but conversions don’t move, the instinct is to blame headlines or distribution. More often the blind spot is measurement: dashboards that show visits but not why readers bounce, which pages drive leads, or which topics compound authority over months. Smart teams fix that with the right content analytics tools, ones that connect behavior, intent, and outcomes instead of spitting out raw numbers.
Picking the best analytics software isn’t about picking the prettiest UI or the most expensive suite; it’s about matching data signals to the strategy you actually run. That means knowing whether you need content-level attribution, organic search growth tracking, or audience segmentation that feeds editorial planning, and then comparing vendors on those concrete features. The following review strips away vendor noise and focuses on the practical tradeoffs that decide whether an analytics platform becomes a growth engine or a dusty subscription.
What Is Content Analytics?
Content analytics measures how content performs and why — not just pageviews and shares, but the behaviors, intent signals, and content attributes that drive conversions, retention, and organic reach. It combines quantitative data (traffic, click-through rates, dwell time) with qualitative signals (search intent alignment, content quality scores) so teams can make repeatable decisions about what to create, optimize, or retire.
Core components
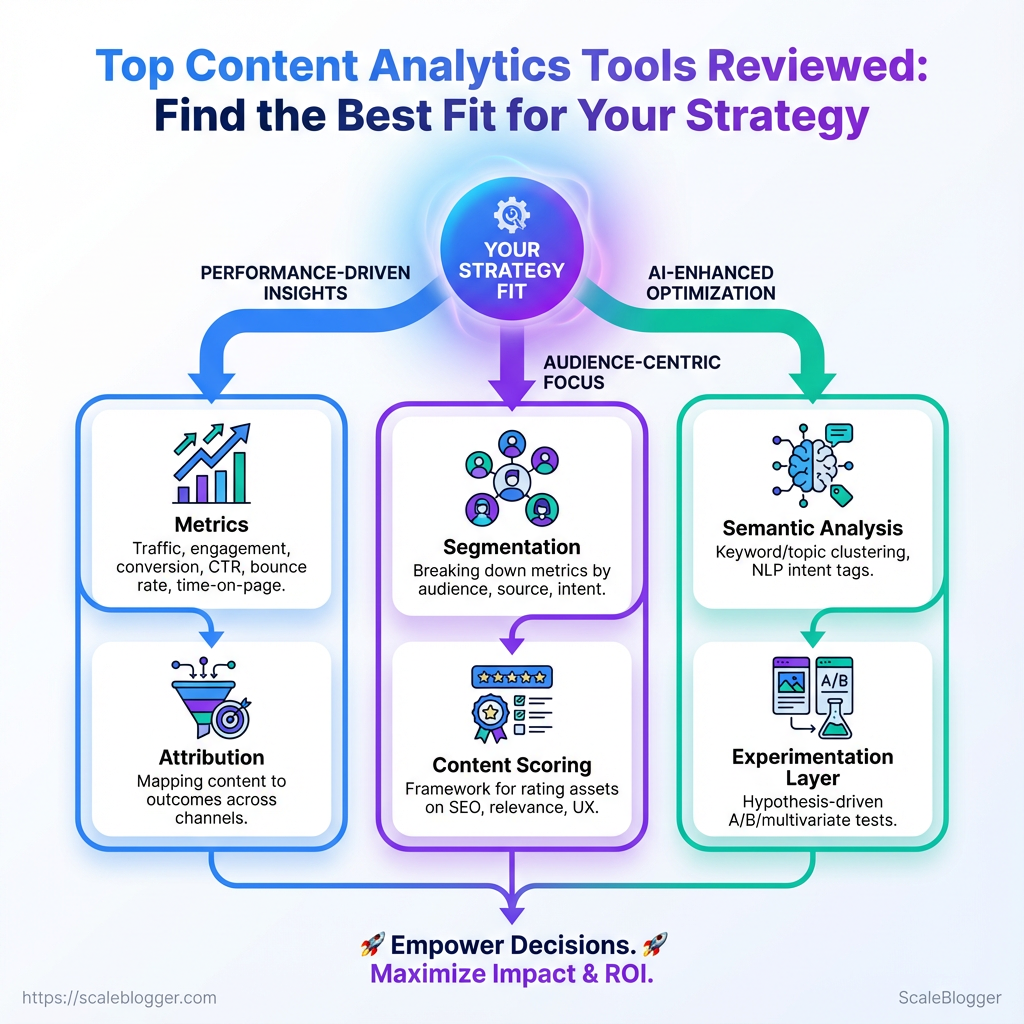
Metrics: Definitions and tracking of traffic, engagement, conversion rates, CTR, bounce rate, and time-on-page.
Attribution: Mapping content to outcomes across channels so you know which pieces actually influence leads, signups, or purchases.
Segmentation: Breaking metrics down by audience, visit source, device, and intent to reveal pockets of opportunity.
Content scoring: A reproducible framework that rates assets on SEO fit, business relevance, and user experience.
Semantic analysis: Keyword/topic clustering and NLP-derived intent tags that connect search demand to content gaps.
Experimentation layer: Hypothesis-driven A/B or multivariate tests for headlines, CTAs, and content structure.
Think of content analytics like the dashboard on a high-performance car. The speedometer (traffic) tells you current pace, the tachometer (engagement signals) hints at engine strain, and the navigation (intent + semantic maps) shows whether you’re on the fastest route to your destination. You wouldn’t drive fast without checking all three; similarly, content teams shouldn’t optimize headlines without watching attribution and semantic fit.
Practical ways teams use content analytics
- Prioritize updates: Focus on pages with rising impressions but falling
CTR—those often need better titles or meta descriptions. - Rescue underperformers: Identify “near-win” pages ranking on page two and optimize them for intent and internal linking.
- Scale winners: Turn high-converting posts into topic clusters or pillar pages to capture broader search demand.
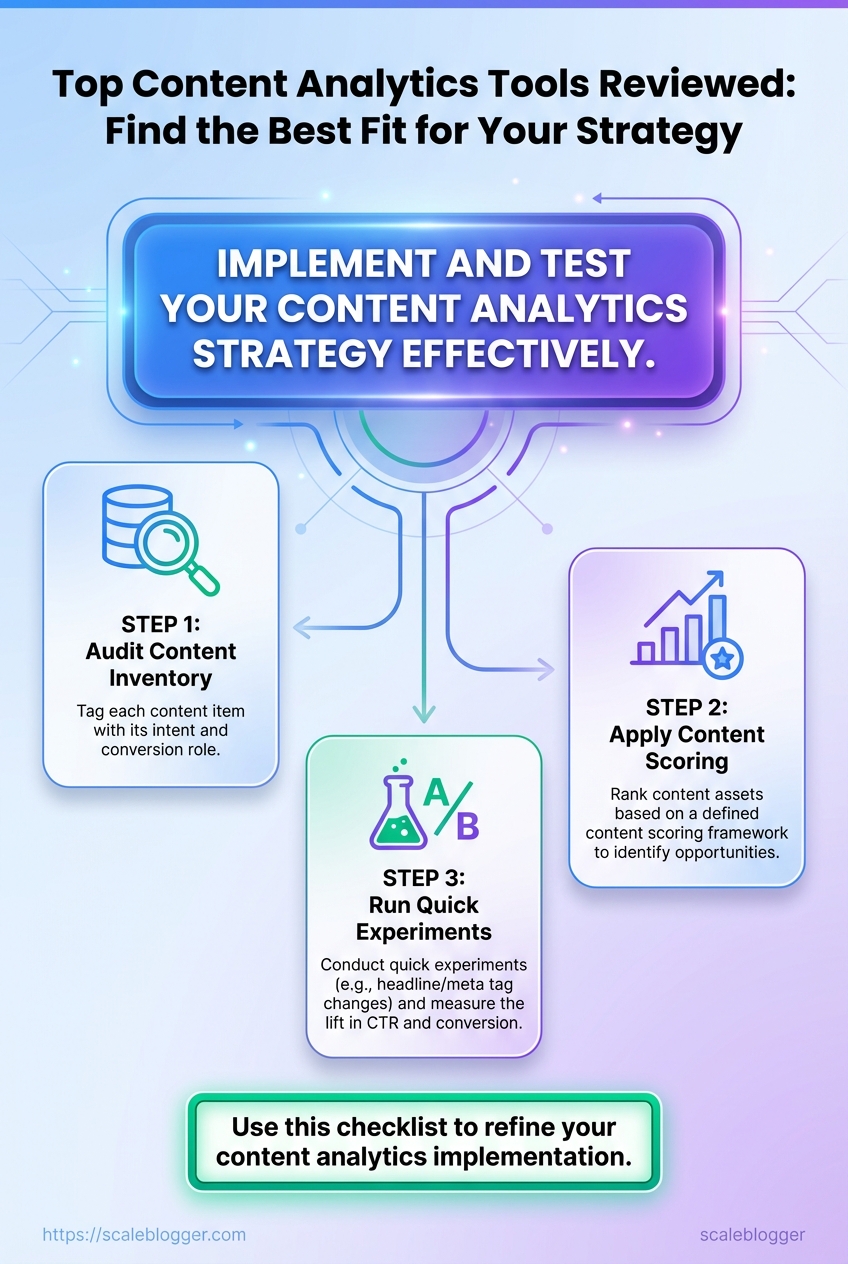
- Audit content inventory to tag each item with intent and conversion role.
- Apply a content scoring framework to rank opportunities.
- Run quick experiments (headline/meta) and measure lift in
CTRand conversion.
Tools and processes vary, but many teams combine analytics platforms with semantic SEO tooling and a content pipeline that automates tagging and scheduling. For teams looking to automate that pipeline and predict performance, solutions like Scaleblogger.com can integrate content scoring with publishing workflows.
Content analytics turns noisy numbers into directional plays: it tells which pages to edit, which topics to expand, and where automation can multiply effort. That clarity is what moves content from noisy to strategic.
How Content Analytics Tools Work
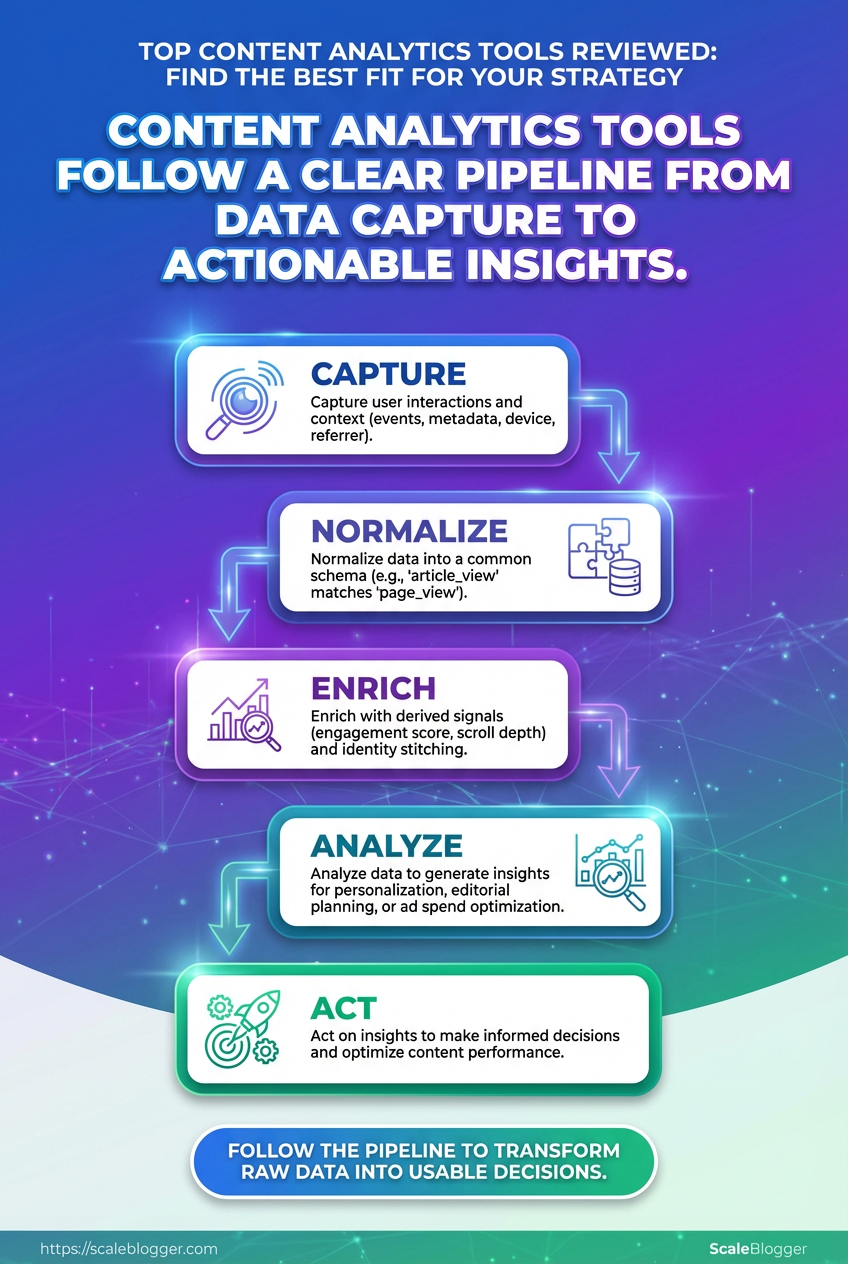
Content analytics tools turn raw behavior into usable decisions by following a steady pipeline: capture, normalize, enrich, analyze, and act. Start to finish, the system converts events like pageview and purchase into signals you can use for personalization, editorial planning, or ad spend optimization — and it does that whether data arrives continuously or in batches.
The pipeline: collection → insight
- Capture user interactions and context (events, metadata, device, referrer).
- Normalize data into a common schema so
article_viewfrom one source matchespage_viewfrom another. - Enrich with derived signals (engagement score, scroll depth, session quality) and identity stitching (email, cookie, device IDs).
- Analyze via aggregation, segmentation, and models (trend detection, churn risk, topical opportunity).
- Act: feed results to CMS, ad platforms, personalization engines, or dashboards for editorial and growth decisions.
Each step matters. Capture quality limits everything downstream. Poor instrumentation produces noise that models learn as facts.
Instrumentation methods and real-time tradeoffs
- Client-side tagging: Quick to deploy for
click,scroll, and form events, but vulnerable to ad blockers and sampling. - Server-side tracking: More reliable for conversions and authenticated events, better for privacy controls.
- SDKs & API ingestion: Useful for mobile apps and backend events where you need consistent schema enforcement.
- Event streaming (real-time): Enables immediate personalization and alerts, but increases complexity and cost.
- Batch uploads: Cheaper and simpler for nightly aggregation or heavy enrichment tasks.
Real-time systems let you personalize landing pages or trigger retargeting within seconds. Batch systems simplify modeling and reduce infrastructure costs. Many setups use a hybrid: real-time for high-value interactions, batch for long-tail analysis.
Common integrations & why they matter
- Analytics platforms (page events): Provide behavioral baseline and traffic attribution.
- CRM / CDP: Enable identity resolution and lifetime value calculations.
- Ad platforms: Close the loop for paid attribution and retargeting.
- CMS / personalization engines: Turn insights into on-site experiments and content recommendations.
- Data warehouses: Store historical context for advanced modeling.
Integrations affect attribution accuracy because identity resolution and timestamp fidelity vary. If the CRM sync lags, conversions may be misattributed to the wrong campaign. Tight, deterministic integrations improve precision; heuristic stitching (cookies, probabilistic matches) broadens coverage but increases uncertainty.
of actions driven by integrations: personalized article recommendations from on-site behavioral feeds, dynamic retargeting audiences built from recent add_to_cart events, or editorial calendars adjusted when engagement-model signals flag a topic as trending.
Using the right mix of capture and integrations turns messy user traces into reliable signals that drive smarter content investments and faster growth.
Which Metrics Matter (and Why)
Start by measuring what actually links to business outcomes: reach, engagement, and conversions. Those three categories cover discovery (are people finding the content?), attention (are they interacting with it?), and value (are those interactions driving business goals?). Pick one primary metric from each category, plus one diagnostic metric, so reporting stays focused and decision-ready.
How to think about the categories and use them
- Reach: Measures how many people discover your content; useful for topic selection and distribution tests.
- Engagement: Tells whether content holds attention and prompts deeper interaction; useful for format and UX changes.
- Conversion: Tracks actions that map to revenue or lead goals; the single most business-critical group.
- Diagnostics: Secondary signals that explain the above—use these to troubleshoot or optimize.
Practical steps to prioritize metrics
- Choose one business outcome (e.g., leads per month).
- Map one conversion metric to that outcome (e.g., form completions).
- Select a reach metric that feeds the funnel (e.g., organic sessions).
- Pick an engagement metric to validate content quality (e.g., engaged sessions).
- Run quick experiments and watch diagnostics for why a test did or didn’t work.
Quick reference table mapping metrics → definitions → common pitfalls → example actions
Metric categories and decision examples
| Metric | Definition | Common Pitfall | Actionable Use Case |
|---|---|---|---|
| Sessions | Total visits to a page or site during a time window | Treating sessions as audience size; ignores repeat visitors | Prioritize topics with rising sessions and test new distribution channels |
| Organic Traffic | Visits from unpaid search results | Expecting immediate conversion lift from traffic alone | Invest in intent-matched topic clusters for sustained growth |
| Bounce Rate / Engaged Sessions | % single-page visits OR GA4 engaged metric (10s, conversion, or 2+ pageviews) |
Overvaluing low bounce without context (e.g., single useful page) | Use engaged sessions to compare formats and headlines |
| Scroll Depth | How far users scroll down a page | Treating high scroll as proof of comprehension | Combine with time-on-page to judge content completeness |
| Conversion Rate | % of users completing a desired action | Optimizing pages for clicks that don’t map to revenue | A/B test CTA copy and placement tied to revenue per lead |
| Assisted Conversions | Channels that contributed to a conversion earlier in the user journey | Ignoring multi-touch paths and attributing credit only to last click | Reallocate budget to channels with strong assist value |
What to glance for: rising organic traffic with falling conversions often points to intent mismatch; high scroll with low conversions suggests weak CTAs or friction.
For teams near scale, tools that automate measurement and surface these relationships save time. Consider integrating an AI content pipeline like Scale your content workflow to tie metrics to publishing cadence and performance forecasting.
Pick metrics that map directly to decisions you can take next—changes to topic, format, distribution, or conversion experience—and measure the impact of one change at a time. That way every metric becomes a lever, not just a number.
Top Tools Compared: Features, Pricing, and Best Use-Cases
Picking an analytics stack depends on whether the goal is product metrics, marketing attribution, session replay, or self-hosted privacy. The short version: choose a tool that matches the question you need answered. Product teams typically want event-level funnels and user cohorts; marketing teams want acquisition reports and cross-channel attribution; privacy-conscious organizations often favor self-hosted or on-prem options.
for tool selection Scope: Market leaders, mid-tier, and privacy-first tools. Criteria: Core features, pricing transparency, integrations, hosting/privacy options. * Data sources: Vendor docs, pricing pages, and common market knowledge.
Help readers shortlist tools by comparing core features, pricing, and integrations side-by-side
| Tool | Best for | Key features | Pricing range | Key integrations | Hosting/Privacy |
|---|---|---|---|---|---|
| Google Analytics (GA4) | Marketing analytics | Event tracking, conversion funnels, free ML insights | Free / paid premium via Google Analytics 360 (enterprise) | Google Ads, BigQuery, Search Console | Cloud (Google) |
| Adobe Analytics | Enterprise marketing & CX | Cross-channel attribution, flexible reporting, segmentation | Enterprise pricing (custom quotes) | Adobe Experience Cloud, CRM systems | Cloud (Adobe) |
| Mixpanel | Product analytics | Real-time funnels, cohort analysis, A/B insights | Free tier; paid from ~$25–$200+/mo | Segment, Snowflake, Salesforce | Cloud |
| Heap | Autocapture for events | Autocapture, retroactive analysis, visualizer | Free tier; paid plans start modestly (custom) | Segment, Looker, Snowflake | Cloud |
| Amplitude | Product intelligence | Behavioral cohorts, Journeys, Experimentation | Free tier; Growth/Enterprise plans (custom pricing) | Segment, Slack, BigQuery | Cloud |
| Hotjar / FullStory | Session replay & UX | Heatmaps, session replay, feedback polls | Hotjar: Free→$99+/mo; FullStory: Free→Enterprise | CMS, tag managers | Cloud |
| Looker / Tableau | BI & reporting | Custom dashboards, SQL models, visualization | Tableau: Creator ~$70/user/mo; Looker: enterprise pricing | BigQuery, Redshift, Snowflake | Cloud / hybrid |
| Matomo | Privacy-focused analytics | Self-hosted option, event tracking, GDPR features | Cloud ~$19+/mo; Self-hosted free (paid features) | WordPress, CMS | Self-hosted / Cloud |
Key insight: The market fragments along two axes — behavioral/product analytics (Amplitude, Mixpanel, Heap), marketing attribution/enterprise CX (GA4, Adobe), and session replay/UX (Hotjar/FullStory). Matomo stands out where self-hosting and data ownership matter.
Short recommendations for common use-cases 1. Product growth: Choose Amplitude or Mixpanel for deep cohort and funnel analysis. 2. Marketing attribution: Use GA4 for broad channel reporting; scale to Adobe Analytics for enterprise cross-channel needs. 3. UX research: Add FullStory or Hotjar for session replay and qualitative signals. 4. Privacy-first / compliance: Deploy Matomo self-hosted or supplement with server-side GA4.
For teams that need an automated content pipeline tied to analytics, consider integrating tracking outputs with an AI-driven workflow—tools like Scaleblogger.com can help turn performance signals into prioritized editorial tasks. Choosing the right tool reduces time to insight and keeps the team focused on the metrics that move the needle.
Tool Deep-Dives & Real-World Examples
Practical profiles of standout tools help decide what fits a content stack. Below are six concise reviews that explain how each tool works in practice, what it measures, and one real-world example showing measurable impact.
Google Analytics 4 — event-first web analytics GA4 focuses on user events rather than pageviews, making it better for tracking cross-channel journeys. Mechanism: Events are instrumented via gtag or Google Tag Manager and enriched with user properties so funnels and cohorts form from event streams. Features: Flexible event model, audience building, cross-platform tracking. Real-world example: A B2B blog reworked its CTA placement after GA4 funnels showed high drop-off at the second article; conversions rose 22% in three months.
Ahrefs — backlink and keyword intelligence Ahrefs crawls the web to surface link profiles and keyword opportunities for content expansion. Mechanism: Regular site crawls feed its index; keyword and SERP metrics derive from aggregated click and ranking signals. Features: Site Explorer, Keywords Explorer, Content Gap. Real-world example: An ecommerce content team used Content Gap to add 12 pages targeting missed long-tail queries, lifting organic transactions by 14%.
SEMrush — integrated SEO and competitive research SEMrush centralizes keyword tracking, technical audits, and competitor insights. Mechanism: Combines domain-level visibility scores with keyword databases and site crawl results to prioritize issues. Features: Position Tracking, Site Audit, Market Explorer. Real-world example: A SaaS site fixed five high-priority crawl issues identified by SEMrush and recovered 18% of lost organic traffic within two months.
Hotjar — behavior analytics and session replay Hotjar captures heatmaps and session replays to show how visitors interact with pages. Mechanism: Client-side scripts collect click, scroll, and mouse movement data, then aggregate into visualizations. Features: Heatmaps, Recordings, Surveys. Real-world example: Heatmaps revealed readers ignored an important signup box; a redesign improved completion rate by 30%.
Zapier — automation for content workflows Zapier links apps so repetitive tasks (publish, notify, tag) run automatically. Mechanism: Triggers and actions map across APIs without code; conditional paths allow basic logic. Features: Multi-step workflows, app integrations, filters/paths. Real-world example: Automating content publishing and Slack alerts cut manual handoffs, reducing time-to-publish by 40%.
Scaleblogger.com — AI-powered content pipeline Scaleblogger automates topic clustering, drafting, and publishing to scale blog output with SEO focus. Mechanism: Combines semantic optimization and automated scheduling to align content with search intent. Features: AI content automation, content scoring framework, predictive performance. Real-world example: A marketing team used the pipeline to launch a 30-article cluster in six weeks, achieving faster indexation and a measurable lift in topical authority.
These tool profiles show different parts of the analytics and content stack—pick the mix that covers measurement, insight, behavior, and automation to speed results and reduce manual work.
How to Choose the Right Tool for Your Strategy
Picking the right tool starts with one simple question: what exactly will the tool enable you to do next month that you can’t do today? Pick from there, not from marketing copy. Tools should either remove a bottleneck, improve measurable output, or lower recurring costs. When those three align, adoption actually sticks.
Start with a short decision framework: identify the problem, measure current capacity, map features to outcomes, pilot with clear success metrics, then scale or drop.
Decision checklist (use this before evaluating vendors)
- Problem defined: One-sentence description of the workflow gap or metric you’ll improve.
- Baseline metric: Current value for the metric you care about (traffic, time-to-publish, CTR).
- Must-have features: List 3 features that change the baseline if present.
- Integration needs: Which systems must the tool connect with (CMS, analytics, Slack).
- Budget range: Monthly and annual ceilings.
- Pilot plan: 30–60 day test with success criteria.
- Exit conditions: What failure looks like and how to roll back.
Follow this short decision-tree for common scenarios:
- If the primary issue is slow production speed, choose tools that automate repetitive steps and integrate with your CMS.
- If performance insights are weak, pick software focused on content analytics and A/B testing.
- If scaling topic coverage is the goal, favor semantic content optimization and cluster-building features.
- If budget is tight, prioritize a narrow pilot (one team, one workflow) rather than an enterprise suite.
Two applied examples
Example — small marketing team: what they did → measurable result Situation: Two-person team struggling to produce weekly long-form posts. Decision: Prioritized automation of draft outlines and editorial calendar sync. * Result: Reduced research + outline time by ~40%, enabling consistent weekly publishes.
Example — enterprise SEO program: what they did → measurable result Situation: Large program had high traffic but low conversion from content. Decision: Selected a content analytics tool to track user journeys and integrate with CRO tests. * Result: Identified three topic clusters to optimize, increasing conversions on targeted pages.
Practical selection tips: evaluate integrations first (analytics, CMS, CRM), insist on an exportable data format, and test the vendor’s support responsiveness during the trial. For teams wanting an AI-first pipeline that automates topic clusters and publishing, consider solutions like Scaleblogger.com as part of the shortlist.
Choosing the right tool is less about the brand and more about how it moves a measurable needle for your team. Pick with a tiny pilot in mind and the decision becomes much lower risk.
Common Misconceptions and Mistakes to Avoid
Many teams treat content analytics like a magic scoreboard—numbers appear, so decisions happen. Reality is messier: metrics are meaningful only when tied to clear goals, clean tracking, and the right tools. Below are six widespread myths, why they mislead, and concrete next steps to fix each one.
* Myth 1: More pageviews always means success. Pageviews are volume, not value. High traffic can hide poor engagement or low conversion. 1. Define a success metric (engagement, leads, revenue) per page or content type. 2. Combine pageviews with engagement metrics like time on page and conversions.
* Myth 2: All traffic sources are equal. Referral, organic, and social bring different intent and attribution complexity. Treating them the same skews priorities. 1. Segment performance by channel in your analytics stack. 2. Weight channels by business impact (e.g., organic for bottom-funnel searches, social for awareness).
* Myth 3: Bounce rate tells the whole story. A high bounce rate can be fine for single-page answers or correct attribution gaps. Context matters. 1. Look at engaged sessions, scroll depth, and mission-specific conversions. 2. Add event tracking for key actions like downloads, clicks, and video plays.
* Myth 4: You must track everything; more data is better. Over-instrumentation creates noise and increases maintenance. Focused tracking yields clearer insights. 1. Audit existing events and remove low-value ones quarterly. 2. Prioritize 6–8 high-impact events tied to business outcomes.
* Myth 5: Last-click attribution is accurate enough. Last-click ignores assisted conversions and multi-touch journeys, undercounting discovery channels. 1. Use multi-touch or data-driven attribution if supported by your analytics tool. 2. Supplement with UTM-tagged campaigns and first_touch/last_touch comparisons.
* Myth 6: The tool defines your strategy. Tools shape workflows, but strategy must come first; otherwise features drive priorities, not goals. 1. Start with outcomes, then choose features you need (cohort analysis, content scoring, A/B testing). 2. Consider platforms that automate pipelines and benchmarking—Scaleblogger.com can help align tooling to strategy.
Actionable next step for all: create a simple measurement plan that maps content types to 3 prioritized metrics and the tracking method (UTM, events, goals). That single document cuts through noisy dashboards and forces tool decisions to follow strategic priorities.
Get tracking clean and decisions will follow—good data doesn’t guarantee wisdom, but bad data guarantees wasted effort.
📥 Download: Content Analytics Tools Implementation Checklist (PDF)
Implementation Checklist & Testing Plan
Start the rollout with a tightly scoped pilot, validate behavior with repeatable tests, then expand only after signals show stable performance. This approach reduces risk, surfaces integration issues early, and keeps stakeholders aligned on measurable validation milestones.
1. Prepare environment: Provision staging with production-like data, enable feature_flag for gradual rollout, and snapshot current content performance.
2. Deploy core automation: Push content pipeline components, connectors to CMS and analytics, and scheduling jobs.
3. Smoke check: Run a single end-to-end publish cycle for one topic cluster and confirm the post appears, metadata is correct, and analytics fires.
4. Canary rollout: Enable for a small audience/section (5–10% traffic or one category) and monitor errors.
5. Full rollout: Gradually increase traffic share while keeping monitoring and rollback ready.
6. Post-release hardening: Tune templates, editorial prompts, and scheduling cadence based on initial signals.
7. Handover & docs: Deliver runbook, rollback steps, run frequencies, and contact list to ops and editorial.
8. Automated regression: Add pipeline checks into CI/CD for future changes.
Quality assurance test cases (repeatable, automated where possible)
- Test 1: Content publish flow — Post created in CMS within expected time;
status=published. - Test 2: Metadata accuracy — Title, description, canonical URL correct and match input.
- Test 3: Schema and tags — Structured data (
ArticleorBlogPosting) present and validates. - Test 4: Analytics firing — Pageview and campaign tags send expected events to analytics.
- Test 5: Link integrity — Internal links resolve (HTTP 200) and no orphaned anchors.
- Test 6: SEO checks — Meta robots correct, hreflang (if used) present, and no duplicate titles.
- Test 7: Performance — Time-to-first-byte and Largest Contentful Paint not degraded versus baseline.
- Test 8: Editorial quality — Readability scores within target and LQA review passes.
30/60/90 day validation milestones
1. Day 30: Confirm operational stability — zero critical incidents, successful runs ≥90%, editorial feedback collected.
2. Day 60: Measure early impact — traffic trends per topic cluster, engagement lift, and content scoring benchmarks; tune templates.
3. Day 90: Evaluate ROI signals — conversion or lead metrics, sustained traffic growth, and decision on scaling full program.
Consider using Scaleblogger.com to automate parts of the pipeline and to benchmark content performance if looking for a turnkey AI content workflow. Keep tests automated where possible and keep the rollout conservative — that way the system becomes trustworthy before it scales.
Conclusion
You’ve seen how looking beyond pageviews—into engagement paths, content cohorts, and conversion micro-metrics—changes what gets tested and what gets shipped. Tracking the right metrics clarifies which articles build trust, which pages nudge trials, and which topics consistently outperform in organic discovery. Practical experiments mentioned earlier — like the SaaS team that used behavior funnels to refine onboarding content, and the ecommerce team that turned product guides into a higher-converting entry point — illustrate how measurement informs creative choices and distribution priorities. Choosing between content analytics tools comes down to whether you need deep user-path analysis, lightweight dashboards for editorial teams, or an analytics comparison that balances cost and setup time.
Start by picking one clear question to answer this quarter, map the metrics that prove progress, and run short experiments to validate hypotheses. Instrument pages for events and cohorts, prioritize tools that integrate with your CMS, and report results in a way editors can act on. For teams looking to automate this workflow or accelerate implementation, platforms like Get expert help implementing content analytics can streamline setup and turn insights into repeatable growth.
