

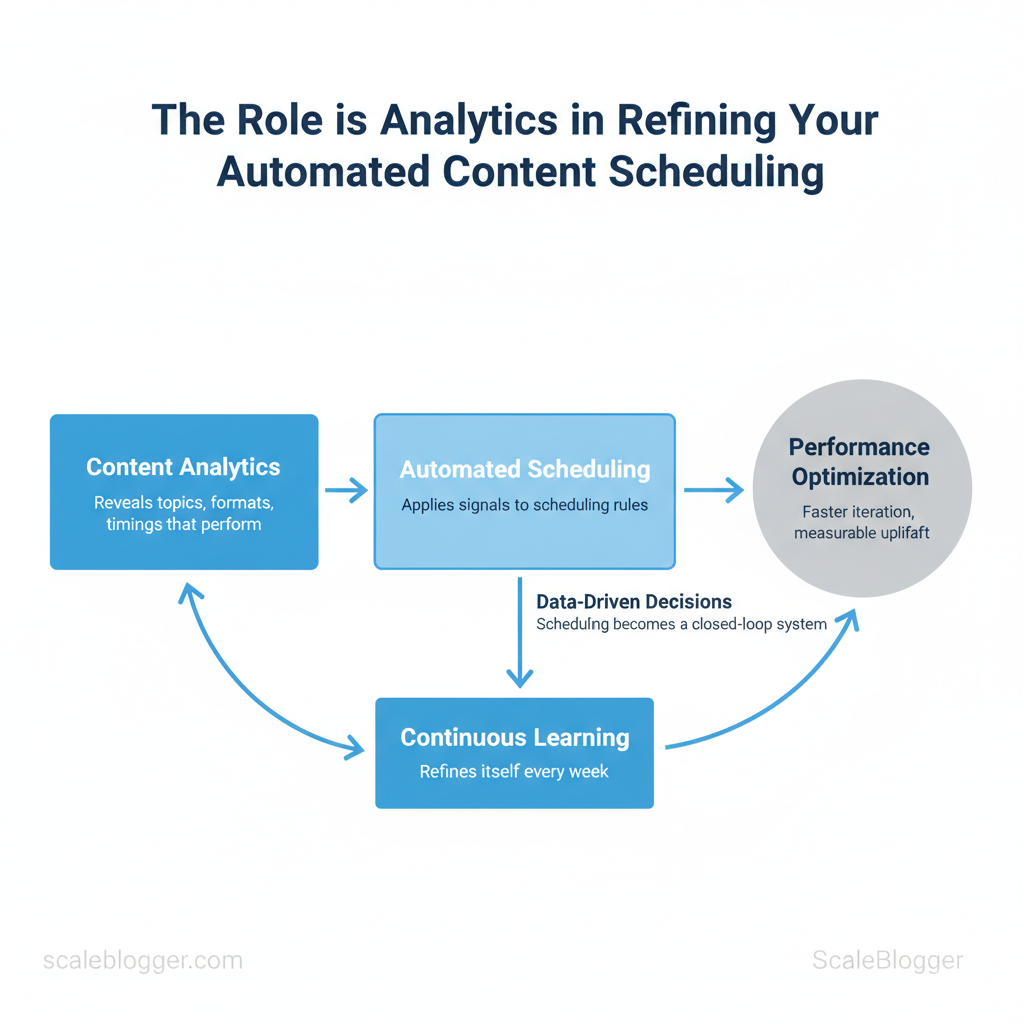
Marketing teams often cram too much content into their calendars. They also fail to measure its impact properly. This results in empty slots for high-performing content and unnoticed wasted effort. Using content analytics in automated scheduling eliminates guesswork by showing you which topics, formats, and timings drive results.
When teams apply those signals to scheduling rules, the result is faster iteration, measurable uplift, and clearer ROI.
> Automation without measurement is just delegation; measurement converts automation into learning.
Imagine a calendar that boosts posts when CTR and engagement_rate are high. It also stops formats that do poorly and redistributes budget to the authors who get the most engagement. That’s where performance optimization and data-driven decisions meet workflow: scheduling becomes a closed-loop system that refines itself every week. For practical templates and integrations that jumpstart this process, Get started with an analytics-driven content schedule (free resources): https://scaleblogger.com
- How to map analytics signals to scheduling rules that scale
- Which KPIs to prioritize for steady audience growth
- Simple tests to validate timing and format hypotheses
- Automations that reduce manual scheduling while increasing reach
The next section translates those bullets into a step-by-step roadmap for turning analytics into automated scheduling policies. Explore Scaleblogger’s automation and analytics solutions: https://scaleblogger.com
> Key Takeaway: ## Why Analytics Is Essential for Automated Content Scheduling
Analytics determines whether automation actually improves performance or simply repeats mistakes. When teams use scheduling rules without measuring results, they treat publishing as a…
Why Analytics Is Essential for Automated Content Scheduling
Analytics determines whether automation actually improves performance or simply repeats mistakes. When teams use scheduling rules without measuring results, they treat publishing as a one-time action. Analytics transforms this into a learning system that tests ideas, measures outcomes, and adjusts rules. Measurement reveals which times, formats, and frequencies move CTR, engagement rate, and downstream conversions—information that rules-only systems never surface.
When analytics feeds scheduling, automation becomes adaptive: it boosts content that performs and prunes what’s underperforming.
How rules-only systems fail
- Rigid frequency: A fixed cadence may overwhelm loyal readers or leave new audiences underserved. Blind timing: Posting by a calendar ignores hourly and regional engagement patterns. Format mismatch: Rules assume a format will perform; they can’t detect declines in watch time or read depth.
- No attribution: Without measurement, teams cannot assign ROI to channels or content types. Slow learning: Manual retrospectives replace rapid iteration, making recovery from mistakes slow.
How analytics creates continuous improvement
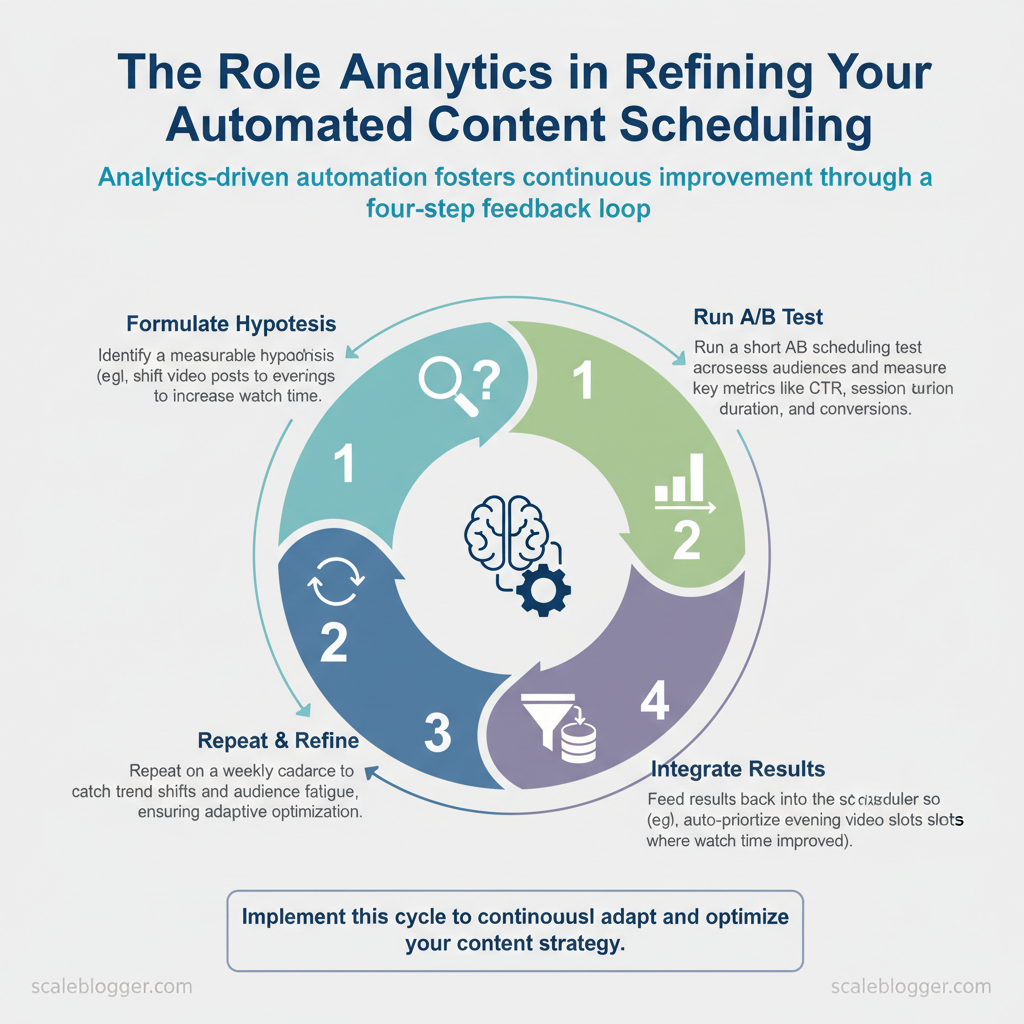
- , shift video posts to evenings to increase
watch time). 2.
Run a short A/B scheduling test across audiences and measure CTR, session duration, and conversions. 3. , auto-prioritize evening video slots where watch time improved).
- Repeat on a weekly cadence to catch trend shifts and audience fatigue.
Example: shifting formats and times
- Hypothesis: According to recent research, short-form clips posted at 7pm local time increase
CTRby 15%. Test: Schedule 20% of clips at 7pm vs baseline slots for two weeks. * Measurement: Analytics showsCTRuplift and longer watch time for 7pm posts.
- Action: Adjust automation to allocate additional evening slots and reduce midday slots for clips.
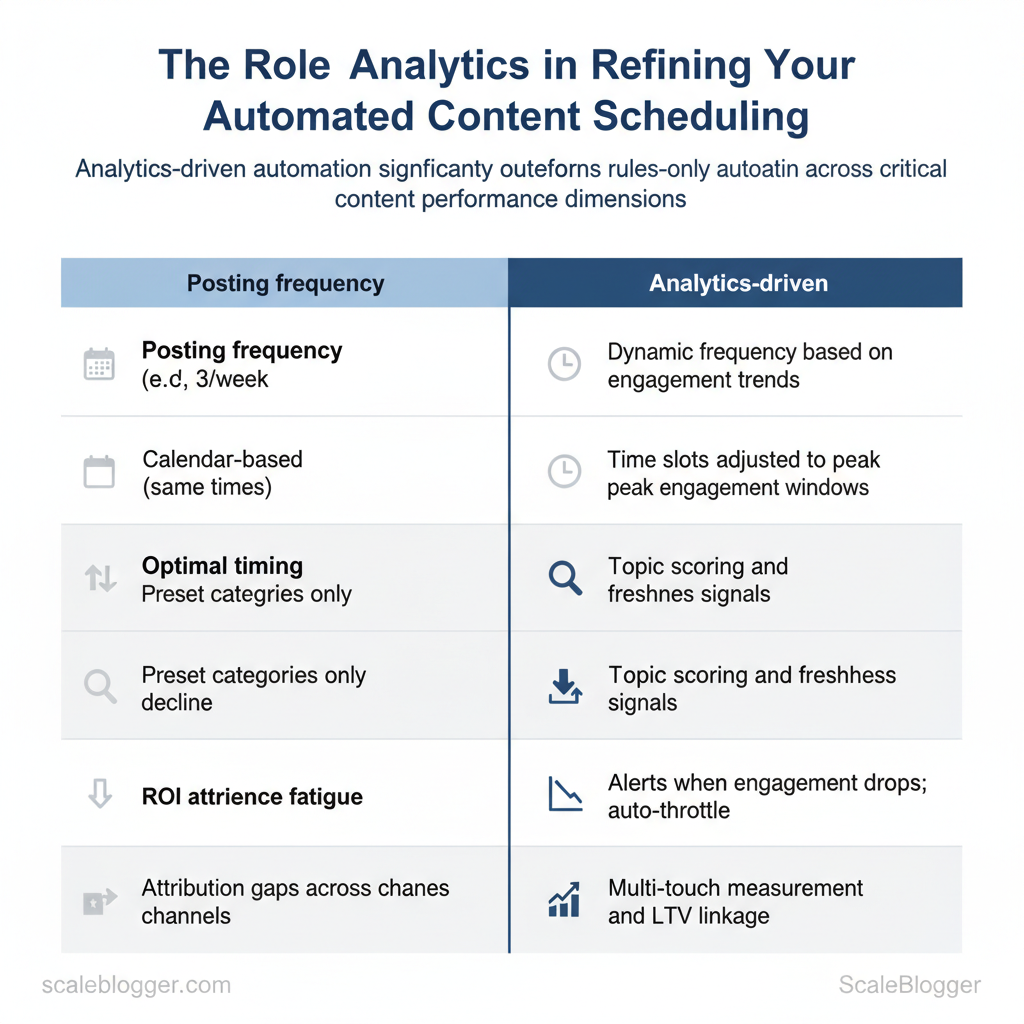
Outcomes from rules-only automation vs analytics-driven automation across key performance areas
content analytics vs automation
| Dimension | Rules-only Automation | Analytics-driven Automation | Business Impact |
|---|---|---|---|
| Posting frequency | Fixed cadence (e.g., 3/week) | Dynamic frequency based on engagement trends | Prevents fatigue, improves retention |
| Optimal timing | Calendar-based (same times) | Time slots adjusted to peak engagement windows | Higher CTR and reach |
| Content relevance | Preset categories only | Topic scoring and freshness signals | Better topical fit, increased conversions |
| Audience fatigue | No detection of decline | Alerts when engagement drops; auto-throttle | Reduces churn and unsubscribes |
| ROI attribution | Attribution gaps across channels | Multi-touch measurement and LTV linkage | Clearer budget decisions |
> Key Takeaway: ## Key Metrics to Track for Scheduling Optimization
Start by tracking a compact set of engagement and conversion metrics that directly inform when, how often, and where content should be scheduled. These metrics indicate if an audience is available…
Key Metrics to Track for Scheduling Optimization
Start by tracking a compact set of engagement and conversion metrics that directly inform when, how often, and where content should be scheduled. These metrics indicate if an audience is available (reach), engaged (engagement), and likely to take action (conversion/retention). Monitor them together rather than in isolation: a spike in impressions with falling engagement suggests distribution timing is right but content needs adjustment; rising average watch time at off-hours indicates an opportunity to expand publishing windows.
Core engagement and reach metrics tell you if scheduling aligns with audience presence:
- Impressions — total times content was shown; an early-warning signal for distribution effectiveness. Reach — unique users exposed; shows audience breadth and saturation risk. CTR (Click-through rate) — clicks ÷ impressions; indicates thumbnail/headline effectiveness at scheduled times.
- Engagement rate — interactions ÷ reach; captures quality of interaction independent of raw views. Average watch/read time — time spent per view; measures content resonance and ideal session lengths.
Conversion and retention signals guide cadence and recycling decisions:
- Prioritize awareness when reach or impressions are flat — increase publishing frequency or test new time slots to expand exposure. 2.
Prioritize conversion when CTR or sign-up rates decline despite steady reach — shift focus to CTAs, landing pages, and reducing friction during peak engagement windows. 3. Use retention signals (return visits, cohort retention) to set recycling cadence — high short-term retention supports longer gaps between re-promotions; low retention suggests faster recycling and format variation.
Attribution caveats when linking scheduling to performance:
- Multi-touch paths distort single-publish attribution — avoid assuming a single send-time caused a conversion.
- Platform delays and view-through conversions can make scheduling impact appear delayed; use cohort windows of 7–30 days.
- Cross-channel amplification often shifts the optimal schedule—what works on social may not transfer to email.
Provide consistent monitoring cadence and simple thresholds as guardrails:
- Rule-of-thumb thresholds: monitor CTR weekly (alert <1%), engagement rate weekly (alert <2%), average watch/read time monthly (alert <50% of content length).
Provide a quick reference table of metric definitions, how to calculate them, and which scheduling decision they most influence
| Metric | Definition / Formula | Primary Scheduling Impact | Monitoring Frequency |
|---|---|---|---|
| Impressions | Total times content displayed | Decide volume/frequency of publishes | Daily |
| Reach | Unique users exposed | Detect audience saturation; expand windows | Daily |
| CTR | Clicks ÷ Impressions |
Test posting times and creative variants | Weekly |
| Engagement Rate | Interactions ÷ Reach |
Choose formats and refine publish cadence | Weekly |
| Average Watch/Read Time | Average seconds or % completed | Set ideal content length and time slots | Weekly–Monthly |
Understanding these measures helps teams schedule with confidence and iterate faster without adding manual overhead. When applied consistently, this approach makes scheduling a data-driven lever that improves both visibility and downstream conversions.
> Key Takeaway: ## Tools and Integrations for Analytics-Driven Scheduling
Today’s scheduling should rely on data signals instead of old calendar habits. Start with analytics platforms that provide reliable, exportable event-level data and pair them with automation…
Tools and Integrations for Analytics-Driven Scheduling
Today’s scheduling should rely on data signals instead of old calendar habits. Start with analytics platforms that provide reliable, exportable event-level data and pair them with automation platforms that can act on those signals in real time. That combination lets teams automatically pause underperforming posts, boost high-CTR content, and reroute promotion budgets without manual bottlenecks.
Analytics Platforms and What to Look For
- Real-time ingestion: choose sources that surface near-real-time metrics for impressions, clicks, and conversions. – API/export capability: API access and bulk exports enable automation; CSV downloads alone are insufficient for continuous workflows. – Segmentation & cohorts: cohort analysis reveals lifecycle performance that single-session metrics miss.
- Custom events: track
content_view,cta_click,subscribe_attemptwith consistent naming across channels. – Attribution support: cross-channel attribution and UTM consistency let automation make channel-level decisions.
Practical reporting setup
- Instrument pages and posts with
content_idandpublish_timestampcustom events. 2.
Send events to GA4 and a third-party analytics sink for redundancy. 3. Build a scheduled ETL that computes 1-hour and 24-hour velocity metrics and writes a performance_status tag back into the CMS via API.
Scheduling & Automation Platforms — Integration Patterns Common mechanisms
- Webhooks — real-time event pushes to automation platforms. APIs (REST/GraphQL) — read/write control for publishing state and metadata. Message queues —
Pub/SuborKafkafor buffering spikes and retry logic.
- SFTP/CSV — batch export for legacy systems.
Examples of automation rules
- Auto-pause low performers: when 24-hour CTR < 0.25% and cost-per-click > threshold, call CMS API to unpublish draft or remove paid promotion tags.
- Boost high-CTR posts: when a post’s 6-hour engagement velocity exceeds historical 90th percentile, add to paid distribution queue and increase budget by X%.
- Resurface evergreen: if engagement decay < Y after 180 days, schedule a republish with updated title and meta.
Security and operational considerations
- Rate limits: design exponential backoff and idempotent endpoints; avoid polling tight loops.
- Authentication: use OAuth or API keys stored in vaults, rotate keys regularly.
- Data governance: only push non-PII performance tags back to publishing systems.
Example webhook payload
json { "content_id":"post-123", "metric":"ctr", "value":0.034, "window":"6h", "action":"boost" }Feature matrix showing which analytics capabilities are essential for automation integration
| Feature | GA4 | Social Native Analytics | Third-party Content Analytics | Why it matters |
|---|---|---|---|---|
| Real-time data | ✓ near-real-time (streaming via Measurement Protocol) | Varies by platform; often delayed 5–15m | ✓ real-time dashboards common | Enables quick scheduling actions |
| API/data export | ✓ Measurement Protocol & Reporting API | ✓ Graph API (Facebook), Marketing API (LinkedIn), native exports | ✓ REST APIs, data warehouses connectors | Automation requires programmatic access |
| Cohort/segment analysis | ✓ built-in cohort reports | ✗ limited cohort features | ✓ advanced cohort tools, retention analysis | Detects post lifecycle and audience behavior |
| Custom event tracking | ✓ gtag/event support |
✗ limited to available engagement metrics | ✓ supports custom schemas and events | Necessary for content-specific triggers |
| Cross-channel attribution | ✓ basic attribution models, BigQuery export for advanced | ✗ per-channel attribution only | ✓ multi-touch attribution engines | Prevents double-counting and misdirected boosts |
Understanding these integration patterns reduces manual overhead and ensures scheduling decisions are timely and defensible. When implemented correctly, automation frees teams to focus on creative optimization rather than repetitive publishing tasks.
Designing Tests and Experiments for Scheduling Decisions
Begin with a straightforward experiment template. Conduct tests that isolate timing, frequency, and channel variables. Schedule one independent variable per experiment, set a measurable primary metric, estimate the sample size using platform baselines or a power calculator, and define a clear decision rule (for example: p < 0.05 or a minimum 10% lift). Doing this prevents ambiguous results and keeps tests fast, actionable, and comparable over time.
- Experiment framework (step-by-step)
- Define the single variable: timing, frequency, format, or channel.
- State the hypothesis: e.g., posting at 9:00 vs 15:00 increases clicks by ≥10%.
- Choose the primary metric: impressions → awareness, CTR → interest, clicks → acquisition.
- Estimate sample size/duration: use historical averages, a statistical power calculator, or internal baselines to target enough impressions or sessions.
- Run and monitor: avoid overlapping campaigns; log metadata (audience segments, post copy, creatives).
- Apply the decision rule: accept change if it meets your
alphathreshold and business relevance.
Checklist for test readiness
- Clear hypothesis: one sentence, directional. Control defined: unchanged baseline variant available. Sufficient reach: estimate audience to hit sample size.
- No confounders: no simultaneous major campaigns or product launches. Monitoring plan: daily checks and automated alerts for anomalies.
Common pitfalls and how to avoid them
- Contamination: mixing audiences or reusing the same creative across variants. Fix by isolating audience segments and swapping only the scheduling variable. Seasonality: calendar events shift behavior.
Avoid by running matched-week comparisons or blocking tests around holidays. * Insufficient runtime: stopping early creates false positives. Minimum monitoring for awareness-stage metrics is typically 2–4 weeks depending on cadence and volume.
- Multiple simultaneous tests: interaction effects hide true impact. Stagger tests or use factorial designs when interaction measurement is intentional.
Template table for planning scheduling experiments showing hypothesis, metric, sample size estimate, duration, and decision criteria
| Test Name | Hypothesis | Primary Metric | Sample Size / Duration | Decision Rule |
|---|---|---|---|---|
| Timing Test — Morning vs Afternoon | Morning posts (9am) increase CTR by ≥10% vs 3pm | CTR (%) | ~5,000 impressions per variant / 14–28 days | Win if ≥10% lift and p < 0.05 |
| Frequency Test — 1x vs 3x per week | 3x/week increases weekly sessions by ≥15% | Weekly sessions | 4 weeks per arm / audience control | Win if sustained lift for 2 consecutive weeks |
| Format Boost Test — Short clip vs long read | Short clip drives higher engagement rate | Engagement rate | 2,500 views per variant / 14–21 days | Win if engagement rate +12% and practical lift |
| Channel Allocation Test — LinkedIn vs Twitter | LinkedIn produces 20% more qualified leads | Qualified leads | 100 lead-conversion opportunities / 30 days | Win if lead quality/OCR improves by ≥15% |
| Recycle Cadence Test — 30 days vs 90 days | 30-day recycle generates more recency traffic | Returning sessions | 8 weeks per arm / historical baseline | Win if returning sessions lift ≥10% without UX fatigue |
Understanding these principles helps teams move faster without sacrificing quality. When implemented correctly, this approach reduces overhead by making decisions at the team level.
Automating Responses to Analytics — Rules, Scripts, and Machine Learning
Use clear rules to automate quick operational decisions. Reserve scripts for linking processes and integrations. Invest in machine learning when the complexity of signals requires it. Start with simple rule-based recipes to cut manual triage time, add scripted workflows for edge-case handling and API orchestration, and only move to ML when historical signals predict outcomes reliably and at scale.
Rule-Based Automation Recipes (practical examples)
- Auto-pause low CTR posts: Pause underperforming posts to conserve budget and test variations. Auto-boost high engagement posts: Increase ad spend or push social amplification when engagement spikes. Reschedule posts with high impressions but low CTR: Change headline or thumbnail when impressions > threshold but CTR below benchmark.
- Promote evergreen content gaining traction: Add to evergreen promotion queue when organic impressions rise consistently. Throttle frequency to reduce audience fatigue: Reduce send frequency when engagement drops after X sends.
- Example rule testing sequence:
- Mirror production metrics into a sandbox dataset for 14–30 days.
- Run rules against historical window and record hypothetical outcomes.
- Validate false-positive and false-negative rates, adjust thresholds.
- Deploy with muted actions (log-only) for 7 days, then progressively enable live actions.
Code and script example (simplified auto-pause using a platform API)
python Python pseudo-code: pause article if CTR < 0.8% over last 72h from analytics import fetch_metrics, publish_action

metrics = fetch_metrics(post_id, window_hours=72) if metrics['impressions'] > 1000 and metrics['ctr'] < 0.008: publish_action(post_id, action='pause')
When to use scripts vs ML
- Signals for scripts: Data sparsity, deterministic rules, simple thresholds, or tasks requiring API orchestration (format conversion, scheduling). Signals for ML: Rich historical data (months+), multiple interacting features (time, audience cohort, creative variants), and a measurable positive ROI from predictions. High-level ML use cases: predicting post performance (CTR, conversions), time-to-peak (hours until max engagement), and next-best-action for content promotion.
- Fallback strategy: Always include a conservative fallback—revert to rule-based defaults if model confidence is low or latency spikes. Human-in-the-loop: Require human review for actions with high cost or brand risk (promotions above spend thresholds, content takedown).
Risk mitigation and testing
- Rate limits and API quotas: Implement exponential backoff and circuit-breakers in scripts.
- Spam/false-action detection: Add sanity checks (e.g., require minimum impressions before action).
- Sandbox validation: Use shadow mode (log-only) and A/B test automated actions against controlled cohorts.
Practical automation recipes with trigger, action, tool examples, and expected business result
| Recipe | Trigger (Metric) | Action | Tool/Implementation Example | Expected Result |
|---|---|---|---|---|
| Auto-pause low CTR posts | CTR < 0.8% over 72h & impressions >1000 | Pause post / remove from rotation | Zapier webhook → CMS API / custom Python script | Reduced wasted impressions; lower ad spend |
| Auto-boost high engagement posts | Engagement rate ↑ 30% day-over-day | Increase ad budget or promote on social | Facebook Ads API + Make automation | Faster reach growth; improved top-performing ROI |
| Reschedule posts with high impressions but low CTR | Impr > 5k & CTR < benchmark | Reschedule with new headline/thumbnail | Buffer API + CMS edit via Zapier | Improved CTR after creative refresh |
| Promote evergreen content gaining traction | Organic impressions + impressions growth >10% week | Add to evergreen queue / schedule promos | Custom scheduler + Google Sheets trigger | Sustained traffic lift; higher long-tail SEO value |
| Throttle frequency to reduce audience fatigue | Engagement drop >15% after N sends | Reduce send frequency for cohort | Email platform API + script | Lower unsubscribes; stabilized engagement |
📥 Download: Automated Content Scheduling Checklist (PDF)
Operationalizing Insights — Teams, Workflows, and Governance
To use analytics effectively, you need clear ownership, a steady schedule, and documentation that allows for tracking decisions. Begin by assigning crisp roles for scheduling and analytics, then bake dashboards, alerts, and templates into the workflow so insight-to-action is repeatable. Below are concrete rules, a sample RACI for scheduling governance, meeting cadences, and dashboard/alert standards that teams can adopt immediately.
Roles, RACI, and Meeting Cadence
| Task | Responsible | Accountable | Consulted | Informed |
|---|---|---|---|---|
| Define scheduling rules | Content Ops Manager | Head of Content | SEO Lead, Legal | Editorial Team, Stakeholders |
| Monitor analytics and alerts | Analytics Analyst | Head of Growth | Content Ops, DevOps | Marketing, Execs |
| Approve automation changes | Automation Engineer | Head of Content Ops | Security, Legal | Content Creators |
| Run experiments (A/B, cadence tests) | Growth PM | Head of Growth | Data Scientist, SEO Lead | Content Ops, Editors |
| Document outcomes | Content Ops Coordinator | Head of Content Ops | Analytics Analyst | Entire Marketing Team |
- Meeting cadence (recommended)
- Weekly 30-min Standup — quick alerts, immediate action items.
- Biweekly 60-min Ops Review — backlog, schedule changes, automation requests.
- Monthly 90-min Strategy Sync — experiments, performance trends, policy updates.
- Quarterly Governance Board — approvals for major automation or policy shifts.
Typical agendas include: alert triage, experiment status, backlog prioritization, and documentation sign-off.
Dashboards, Alerts, and Documentation Best Practices
- Dashboards: Focus on outcomes — surface sessions, conversions, organic ranking changes, content scoring, and experiment lift; include trend lines and baseline comparisons.
- Alerts: Thresholds by impact — e.g., traffic drop >20% week-over-week, conversion fall >15%, publish failures >0.5%; route critical alerts to Slack + email, less critical to a daily digest.
- Documentation: Audit-first templates — capture hypothesis, dataset, query, experiment settings, results, decision, and owner.
Example documentation template:
markdown Title: Owner: Hypothesis: Dataset & Query (include SQL): Experiment Settings: Start/End Dates: Result Metrics: Decision & Next Steps: Audit Trail (links to dashboards, changelogs):Practical tip: Integrate change logs into dashboards so every automation adjustment links to the documenting entry. Use tools that export metadata automatically; if building custom pipelines, include commit hashes and pipeline run IDs.
Understanding these principles helps teams move faster without sacrificing quality. When implemented correctly, this approach reduces overhead by making decisions at the team level.
Conclusion
You’ve seen how pairing content analytics with automated scheduling uncovers wasted opportunity and makes performance measurable. When teams match their scheduling to data, they stop guessing which time slots work best. They begin reallocating resources to formats and times that drive real results. One editorial team that adopted analytics-driven automation reclaimed previously underused publishing windows and freed editorial capacity for higher-value pieces; another used automated A/B scheduling to identify headline patterns that consistently lifted engagement.
Prioritize quick wins: instrument events, map the highest-impact publishing slots, and automate repeatable workflows so the calendar starts working for you instead of against you.
If you have questions—like how long results will take to show or which metrics to track first—plan for initial signals within weeks after consistent tagging and scheduling. Start by focusing on engagement rate, click-through, and conversion attribution. For teams looking to scale this approach without rebuilding internal tooling, platforms can tracking, scheduling, and reporting. com) as one practical next step.
Begin by running a two-week pilot: tag your top 20 posts, automate their optimal slotting, review the outcome, and iterate. That sequence yields clarity fast and creates a repeatable loop for continuous improvement.
