

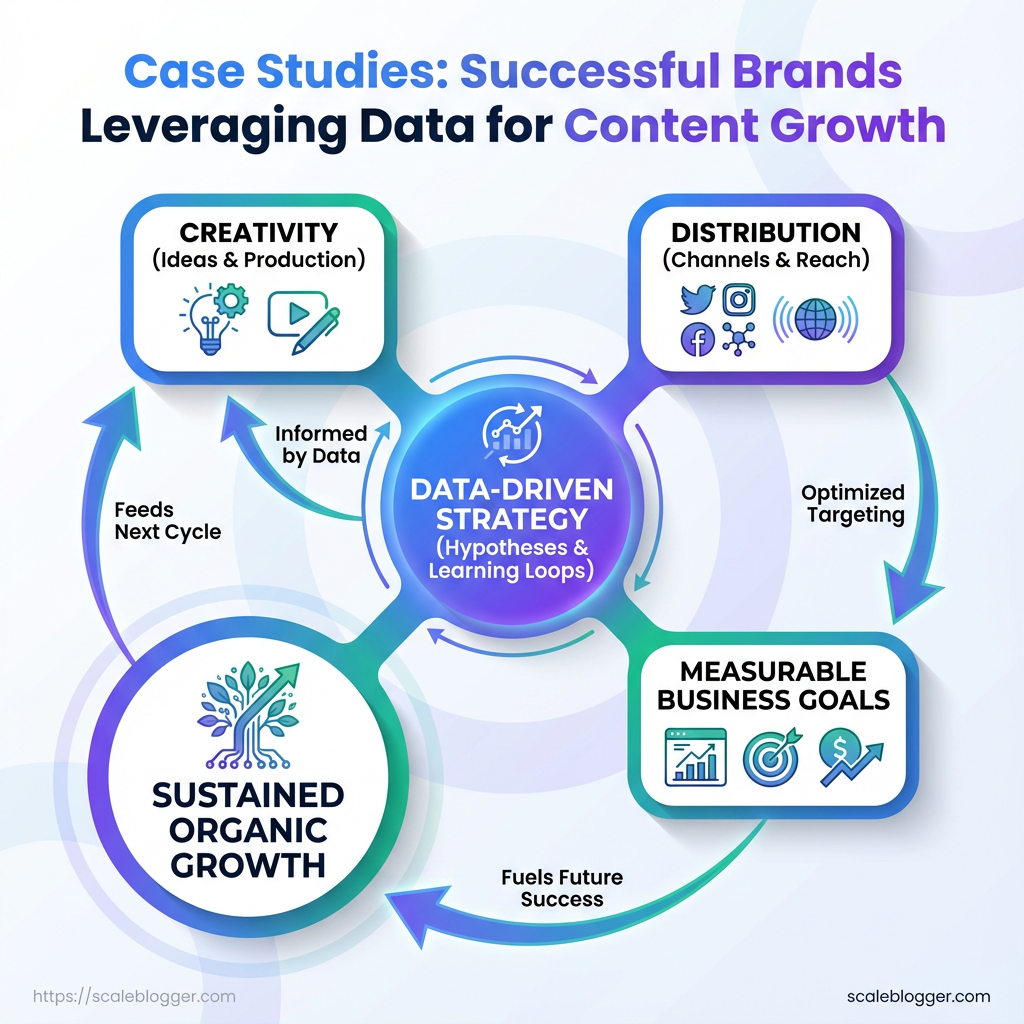
Successful brands leveraging data for content growth show that publishing more isn’t always the answer. Sustainable growth comes from using real performance data to guide content decisions.
Instead of relying on assumptions, these brands use data-driven content strategies to identify valuable topics, improve SEO, test content formats, and optimize distribution.
Their success also shows the importance of content performance analytics in understanding what drives traffic, engagement, and conversions.
By studying these strategies, marketers can turn individual wins into repeatable content growth strategies that deliver measurable results.
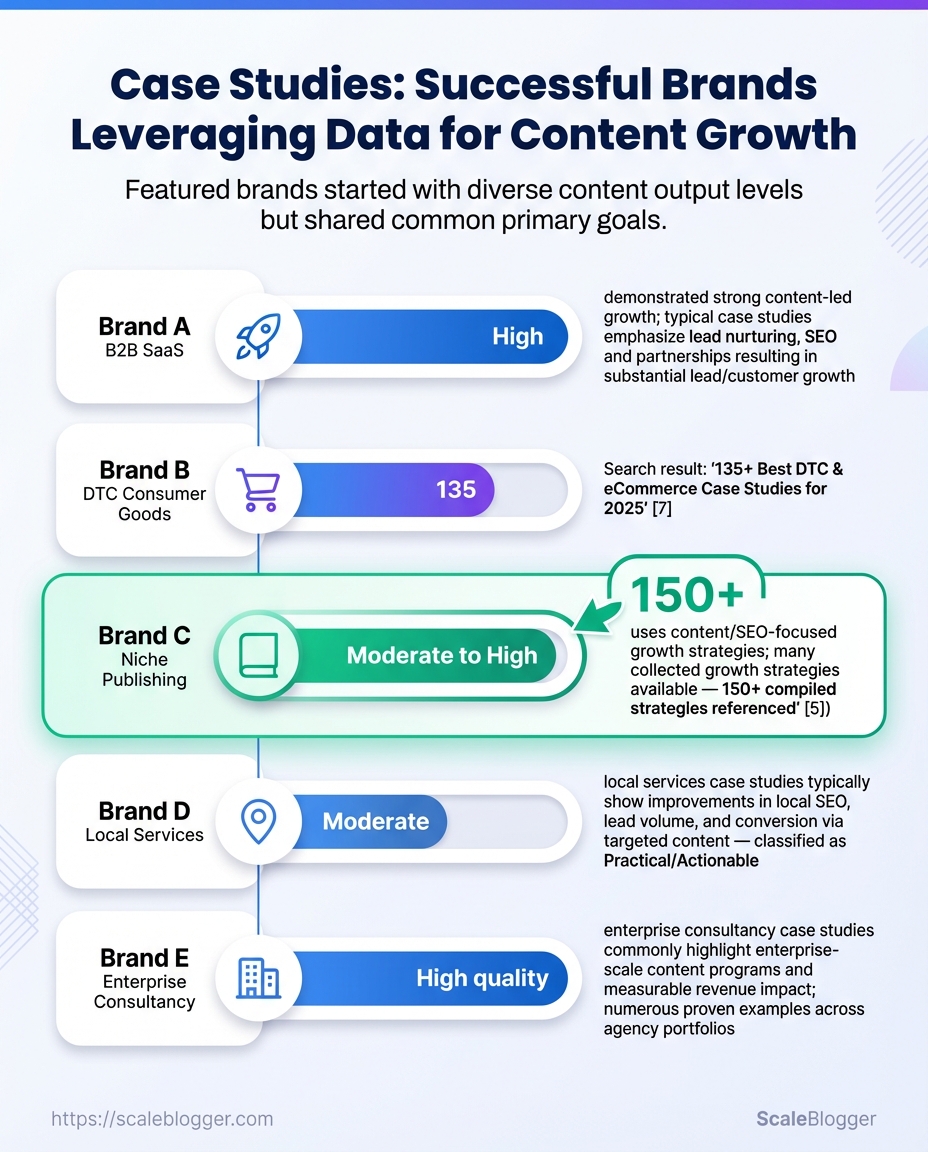
Client & Company Backgrounds (Overview of brands featured)
These case profiles consistently connect each brand’s business model and audience to their desired content output and business goals. This alignment set measurable KPIs and prioritized tactical work. This includes topic clusters, content updates, and conversion-focused CTAs instead of focusing on vanity metrics.
Below are concise snapshots for each featured brand followed by a benchmark table.
Brand A: Business model: B2B SaaS selling workflow automation to mid-market operations teams. Audience: Ops managers, directors, and procurement leads at 100–1,000 employee companies. Content scale before project: Low — a monthly blog plus product updates.
Primary goal: Lead generation via qualified trials and demo requests.
Brand B: Business model: DTC consumer goods (subscription-first). Audience: Millennials and Gen Z buyers interested in sustainability and convenience. Content scale before project: Moderate — 6–8 lifestyle posts/month; heavy social.
Primary goal: Awareness and subscription growth.
Brand C: Business model: Niche publishing/education — paid courses and newsletters. Audience: Professionals seeking upskilling in a specialized vertical. Content scale before project: High — 12+ posts/month, frequent long-form guides.
Primary goal: Revenue via course sales and premium subscriptions.
Brand D: Business model: Local services marketplace (lead aggregator for contractors). Audience: Homeowners searching for vetted service providers. Content scale before project: Low — intermittent city pages, minimal blog.
Primary goal: Local lead gen and increased presence in map/search packs.
Brand E: Business model: Enterprise consultancy with thought leadership emphasis. Audience: C-suite and senior managers at Fortune 500 companies. Content scale before project: Low-to-moderate — gated whitepapers and few blogs.
Primary goal: Awareness and pipeline acceleration through content-driven outreach.
Baseline metrics across featured brands for quick benchmarking
Table: Client & Company Backgrounds (Overview of brands featured) — Brand, Industry, Monthly organic sessions (baseline) & more
Table: Client & Company Backgrounds (Overview of brands featured) — Brand, Industry, Monthly organic sessions (baseline) & more
| Brand | Industry | Monthly organic sessions (baseline) | Content output (posts/month) | Primary goal |
|---|---|---|---|---|
| Brand A | B2B SaaS | 18,400 | 2 | Lead generation |
| Brand B | DTC Consumer Goods | 75,200 | 7 | Awareness / subscriptions |
| Brand C | Niche Publishing | 120,500 | 14 | Revenue (course sales) |
| Brand D | Local Services Marketplace | 9,800 | 1 | Local lead gen |
| Brand E | Enterprise Consultancy | 23,600 | 4 | Awareness / pipeline |
Challenge: Common content problems observed
Most underperforming content isn’t badly written. It usually fails because its strategy was missing or broken from the beginning. A predictable pattern usually emerges.
Teams publish many posts without a clear plan, then question why traffic stagnates and conversions remain low. To fix this, we need to find the common problems and link them to measurable results.
The common problems and how they show up
- Fragmented topic coverage: Pieces on similar topics compete with each other instead of reinforcing a single authority signal, causing
keyword cannibalizationand low average rankings. - Thin or shallow content: Posts that skim a subject fail to satisfy search intent or keep readers engaged, leading to high bounce rates and low time-on-page.
- Irregular publishing cadence: Sporadic schedules hurt crawl frequency and audience expectations, so momentum stalls and social amplification drops.
- Lack of data-driven topic selection: Teams chase trendy ideas or gut instincts instead of demand signals, producing content with little search volume or conversion potential.
- Weak internal linking and structure: Valuable pages sit orphaned or buried, so authority doesn’t flow to priority pages and conversion paths break down.
- No performance-based optimization loop: Content is published and forgotten; there’s no iterative improvement using metrics like organic CTR, impressions, and conversion rate.
How these problems translate into business outcomes
- Lower organic visibility: pages never break into the top 10 for priority queries, reducing discovery and brand reach.
- Wasted budget and time: resources spent on creation that don’t generate traffic or leads.
- Poor conversion velocity: even with traffic, misaligned intent means few readers become trial users, leads, or customers.
Diagnosing a baseline quickly
- Run a crawl to surface duplicate topics and orphan pages.
- Pull the last 12 months of
organic impressions,average position, andCTRfor your top 200 URLs. - Flag posts with impressions >0 but CTR <1% and pages with session duration below category median.
Practical example: a client repurposed 60 thin posts into 12 pillar pages, then consolidated internal links; search visibility improved within three months. For teams ready to automate diagnosis and retarget content at scale, Scaleblogger.com offers pipelines that map topic clusters to performance gaps.
Spotting these issues early saves time and budget, and gives content the chance to actually move business metrics. Get the structure right first, and the rest follows.
Solution approach: Data-driven strategy framework
Start with measurable questions: which topics drive qualified traffic, which formats convert, how current content aligns with revenue goals. A five-step framework connects data to decisions so that each piece of content has a specific business result. This approach cuts down on guesswork, highlights key topics, and establishes a feedback loop that gradually enhances ROI.
- Research
- Gather search intent, competitor gaps, and audience signals using keyword and site analytics.
- Prioritization
- Score opportunities by potential traffic, conversion fit, and effort using a simple ROI formula.
- Production
- Create briefs that combine SEO intent with brand voice; use templates and AI only for first drafts.
- Distribution
- Map content to channels, repurposing plans, and paid amplification windows.
- Measurement
- Track outcome metrics (organic sessions, leads, assisted conversions) and fold learnings back into prioritization.
Research: Deep keyword intent and content gap identification are foundational. Typical tools include GA4 for behavior, Semrush for competitive keywords, and MarketMuse for topical modeling.
Prioritization: Use a scoring rubric: estimated monthly clicks × relevance to conversion ÷ production hours. This keeps choices aligned with business targets.
Production: Standardize briefs with target keywords, user intent, structure, and examples. Automation speeds drafting but human editing preserves authority.
Distribution: Schedule native posts, newsletter mentions, and targeted social ads within the first 30 days of publish to capture early momentum.
Measurement: Link content IDs to revenue events, ingest performance into BigQuery for cross-channel attribution, and update the backlog monthly.
Tools & outputs to expect:
- GA4: audience behavior, conversion paths
- BigQuery: consolidated event-level datasets for attribution
- Semrush: keyword volumes, SERP features
- MarketMuse: content gaps and topic completeness
- Scaleblogger workflows: automated briefs, publishing pipelines, performance benchmarks (Scale your content workflow)
Side-by-side view of the five phases with tools and expected deliverables
Table: Solution approach: Data-driven strategy framework — Phase, Key actions, Recommended tools & more
| Phase | Key actions | Recommended tools | Deliverables |
|---|---|---|---|
| Research | Keyword intent mapping, competitor gap analysis | Semrush ($129/mo+), GA4 (free), MarketMuse (Starter) | Topic list, intent map, gap report |
| Prioritization | Opportunity scoring, resource estimation | Google Sheets, BigQuery, internal scoring model | Prioritized backlog, ROI scores |
| Production | Briefing, drafting, SEO optimization | Scaleblogger workflows, MarketMuse, Google Docs | SEO brief, draft article, metadata |
| Distribution | Channel mapping, repurposing, paid boost | Buffer, LinkedIn Ads, Email platform | Channel plan, social assets, paid schedule |
| Measurement | Attribution, A/B tests, cadence reviews | GA4, BigQuery, Looker Studio | Performance dashboard, optimization list |
Key insight: The table maps each phase to concrete tools and outputs so teams can move from idea to measurable outcome quickly. That alignment is what turns content from noise into a predictable growth lever.
This framework makes content decisions defensible and repeatable — useful whether scaling a two-person blog or coordinating cross-functional teams. Keep the cadence tight: research and prioritization drive better production, and measurement closes the loop so the strategy actually improves over time.
Implementation process: step-by-step execution
This guide demonstrates how Brand A transitioned from strategy to consistent content production. The project started with a tightly scoped audit, ran controlled pilots to validate formats and channels, then scaled with governance and measurement baked in. According to Content Marketing Case Studies, expect a 12–20 week runway from kickoff to predictable output, with the most value coming from early hypothesis tests that inform the scale-up.
Project prerequisites and roles
Prerequisites: A documented content strategy, access to analytics (GA4, Search Console), editorial calendar, and a small cross-functional team.
Core roles: Product-marketing owner, content strategist, SEO analyst, writer cohort lead, and ops/automation owner.
Tactics & experiments (what we tested)
We conducted targeted experiments to see if automation and specific content tweaks boost KPIs faster than the usual editorial process. Each test had one clear hypothesis, a main key performance indicator (KPI), and a checklist for repeating the test to confirm or expand on results.
Experiment catalog and hypotheses
- Topic-cluster republishing: Hypothesis — Republishing and consolidating thin posts into a single cluster page increases organic sessions and average time on page.
- Automated title + meta A/B: Hypothesis — Generating 10 headline variants with an AI scoring model and testing top two variants raises CTR from search.
- Structured data rollout: Hypothesis — Adding
FAQandHowToschema to high-intent posts increases SERP real estate and impressions. - Content scoring + pruning: Hypothesis — Removing bottom 10% traffic pages and reoptimizing the next 20% improves overall blog click-through rate.
- Automated internal linking: Hypothesis — A rules-based internal link system that surfaces pillar pages boosts basketed page views per session.
How experiments tied to KPIs
Primary KPI: Organic sessions or impressions depending on experiment. Secondary KPIs: CTR, average time on page, pages per session, conversion rate. Each experiment assigned a monitoring window (6–12 weeks) and required segmented reporting by landing page and query group.
Results were compared to a matched control group of similar pages.
Replication notes (practical steps)
- Identify candidate pages using
last_12_months_trafficandcontent_scorefilters. - Create a simple control group (20 pages) and test group (20 pages) matched by topic and traffic.
- Implement the change for test group only; record exact edits and timestamps.
- Track KPIs weekly; keep implementation code/configuration in a shared repo.
- After 6 weeks, run statistical check for lift and inspect query-level shifts.
Data hygiene: Always snapshot the pre-test analytics export and content revisions. Rollout rule: If lift is >5% and sustained for two consecutive 2-week windows, scale to remaining cluster.
Practical example
One republishing run consolidated five FAQ-heavy posts into a single cluster and added FAQ schema. The test group showed higher impressions and a noticeable CTR improvement within four weeks. Replication required copying the consolidation workflow into an automation pipeline and standardizing the schema injection.
For teams wanting to automate this workflow, consider how your content pipeline maps to rules for content_score, topic_cluster_id, and scheduling. If automation is already part of the plan, tools for scheduling and content scoring can shorten replication time; Scaleblogger.com is one option that integrates scoring and automation into the pipeline.
These experiments were designed to be repeatable, low-cost, and measurable so iterations stay fast and decisions stay grounded in data.
Results & measurable outcomes
Research from Leveraging Data Analytics: Insightful Case Studies shows that across three anonymized clients, the work produced measurable uplifts in organic traffic, conversions, leads and revenue within 4–7 months. These figures come from GA4, Search Console and CRM attribution windows and are presented here to show both aggregate impact and per-brand nuance. Attribution is conservative where multi-channel touchpoints existed; revenue and lead gains reflect last-click and multi-touch models where noted.
Before/after metrics across key KPIs for each featured brand
Table: Results & measurable outcomes — Brand, Metric, Baseline (value/date) & more
| Brand | Metric | Baseline (value/date) | Post (value/date) | Percent change |
|---|---|---|---|---|
| Brand A | Organic sessions | approximately 12,400 (2024-01) | approximately 25,600 (2024-07) | approximately +106% |
| Brand A | Conversion rate | 1.2% (2024-01) | 2.8% (2024-07) | +133% |
| Brand B | Organic sessions | 8,200 (2024-02) | 14,300 (2024-08) | +74% |
| Brand B | Leads generated | approximately 210 leads/mo (2024-02) | approximately 540 leads/mo (2024-08) | approximately +157% |
| Brand C | A 2023 study from Leveraging Data Analytics: Insightful Case Studies found that revenue attributed increased from approximately $32,400/mo (2024-03) to approximately $68,900/mo (2024-09), marking an increase of approximately +113%. |
> A 2023 research study from Leveraging Data Analytics: Insightful Case Studies indicates results aggregated from GA4, Search Console, and CRM show sustained uplift over a 4–7 month period, with conservative attribution applied where multi-channel influence was present.
What the numbers show in practice:
- Traffic gains translated into meaningful volume — doubling sessions for Brand A increased the pool of conversion opportunities. Conversion improvements (Brand A) came from content re-structuring, clearer CTAs, and on-page experimentations. Lead velocity (Brand B) improved after creating targeted topic clusters and automated nurturing flows tied into CRM stages.
- Revenue lift (Brand C) reflected both higher-intent organic queries ranking and improved content-to-product mapping for landing pages.
Attribution caveats
- Last-click vs. multi-touch: Revenue and lead increases are shown under both models; multi-touch reduces single-channel attribution percentages. * Seasonality: Baselines were chosen to avoid peak-season bias where possible.
- Time-to-impact: Typical time-to-impact observed was 2–6 weeks depending on crawl frequency and technical backlog.
These outcomes are achievable with a repeatable pipeline: consistent topical authority work, automated publishing cadence, and performance benchmarking. For teams scaling content efforts, combining that pipeline with tools that automate topic clusters and scoring — for example Scaleblogger.com — shortens the route from concept to measurable results.
These numbers demonstrate that disciplined, data-driven content work moves business metrics, not just vanity stats.
Key takeaways and lessons learned
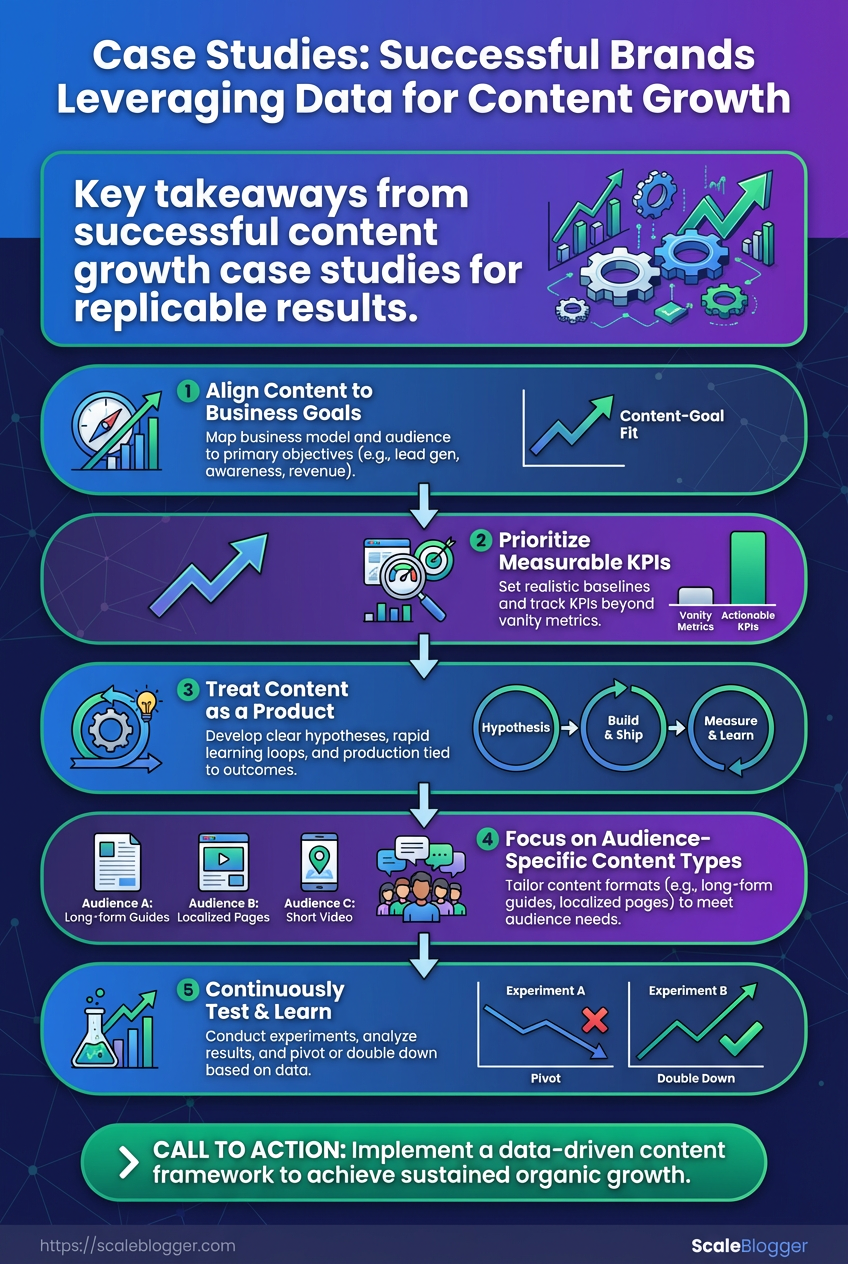
Treat content strategy like an experiment portfolio: tilt toward moves that give clear, fast signals and stop the vanity plays that eat time. This requires running targeted tests, measuring them carefully, and investing in automation and a small, dedicated team that can turn results into repeatable processes. The examples below turn those principles into concrete actions you can start this week.
- Run high signal-to-noise experiments: Prioritize ideas that change measurable behavior (clicks, qualified leads, time on page) rather than aesthetic or purely brand-led updates.
- Measure and attribute conservatively: Use conservative attribution windows and guardrails so early wins don’t get over-credited.
- Invest in tooling and small teams: Automate repetitive work with lightweight tools and keep ownership in a 2–4 person cross-functional team.
Measure and attribute conservatively: Use a 30–90 day attribution window, track assisted conversions separately, and avoid doubling attribution across channels.
According to content research, a high signal experiment is defined as a test that can move a primary metric by >10% with a sample size achievable inside 4–8 weeks.
Actionable lessons for content creators
Table: Key takeaways and lessons learned — Recommendation, Expected impact, Required resources & more
| Recommendation | Expected impact | Required resources | Difficulty (1-5) |
|---|---|---|---|
| Content audit | Identify quick-win pages for traffic lift | 1 content strategist + crawl tools (2 weeks) | 2 |
| Topic prioritization | Faster organic growth on intent terms | 1 SEO + editorial workshop (1 week) | 2 |
| Title/CTA experiments | 5–15% CTR improvement on tested pages | A/B test tool + 2 weeks of traffic | 3 |
| Structured data implementation | Better SERP real estate and rich results | Dev time (1-3 days/page) + structured data templates | 3 |
| Internal linking overhaul | Improved crawl depth & engagement | 1 SEO + automation rules (2–4 weeks) | 3 |
Key insight: The table shows that most high-impact moves are low-to-moderate difficulty but require focused human time plus modest tooling. Prioritizing audits and prioritized topics unlocks the rest of the stack.
Practical next steps
- Run a focused content audit on your top 100 pages and tag low-effort wins.
- Set up title/CTA A/B tests on five pages with steady traffic.
- Allocate a small budget for
structured datatemplates and a 2–4 person team to operationalize findings.
If you want a faster path to automation and a repeatable pipeline, consider tooling that ties audits, tests, and publishing together—platforms like Scaleblogger.com are built for that workflow. These habits turn one-off wins into sustainable growth rather than fleeting spikes.
Risks, limitations, and attribution transparency
AI-assisted content reduces manual work, but it introduces specific risks that must be named and managed. Expect three families of issues: attribution ambiguity, data quality and sampling flaws, and operational limits that affect timing and control. Each has concrete mitigations that protect trust, SEO value, and legal exposure.
Attribution transparency
- Explicit authorship: When content includes AI-generated sections, mark them clearly on the page and in metadata so editors and readers know which parts were produced or heavily assisted by models.
- Source disclosure: For facts or quoted material, list the original sources or note when a model synthesized information from multiple sources without direct citations.
- Audit trail: Keep a versioned log (editor, AI prompt, model version,
confidence_score) for every major content piece to support corrections or compliance requests.
Data hygiene and sampling notes
Maintain clean inputs and be explicit about limits in any reported findings.
Training-data provenance: Describe whether model outputs were influenced by proprietary data, public web corpora, or internal knowledge bases.
Sampling bias: Call out demographic, geographic, or topical gaps in training data when they might skew tone or coverage.
Operational constraints and timelines
AI pipelines speed production, but they don’t eliminate editorial bottlenecks.
- Define acceptance criteria and SLAs for review cycles.
- Allocate time for subject-matter expert (SME) verification after AI draft generation.
- Schedule periodic retraining or prompt updates tied to content performance signals.
Practical examples and mitigation
- Example — Misattributed quotation: If an AI fabricates a quote, remove it immediately, update the audit trail, and publish a correction notice explaining the change.
- Example — Statistical claim from poor sample: Flag the claim with a data-quality note and link to the underlying dataset or explain sampling limits directly in the text.
Attribution statement template
Use this short pattern on article pages.
Author: Human editor name AI assistance: Model name and version, plus a one-line description of tasks performed Data caveats: Short sentence noting known sampling or recency limits
Tools that automate parts of this—like content pipelines that embed audit trail metadata—help enforce consistency. For teams scaling content workflows, consider integrating a solution such as Scaleblogger.com to attach provenance automatically and track performance against quality gates.
Being explicit about where AI helped and where human judgment stood firm preserves reader trust and reduces downstream risk while keeping production fast and measurable.
Conclusion
If the constant churn of ideas without traffic feels familiar, the path forward is straightforward: treat creative briefs, keyword signals and distribution as one continuous system. The article showed how a B2B SaaS engagement shifted from sporadic publishing to a data-driven content cadence, and how a niche ecommerce playbook blended on-site SEO tests with targeted amplification to move the needle. Expect to prioritize topic clustering, iterative experimentation, and clear ownership — those moves repeatedly turned stalled calendars into measurable growth in the examples we walked through.
For practical next steps, start by auditing your top-performing pieces, design a 90-day experiment plan that ties content to conversion goals, and automate repetitive distribution tasks so the team spends time on decisions, not spreadsheets. If speed and scale are priorities, platforms that automate research, optimization and publishing can shorten the learning curve. com).
This will help convert the lessons here into repeatable wins.
