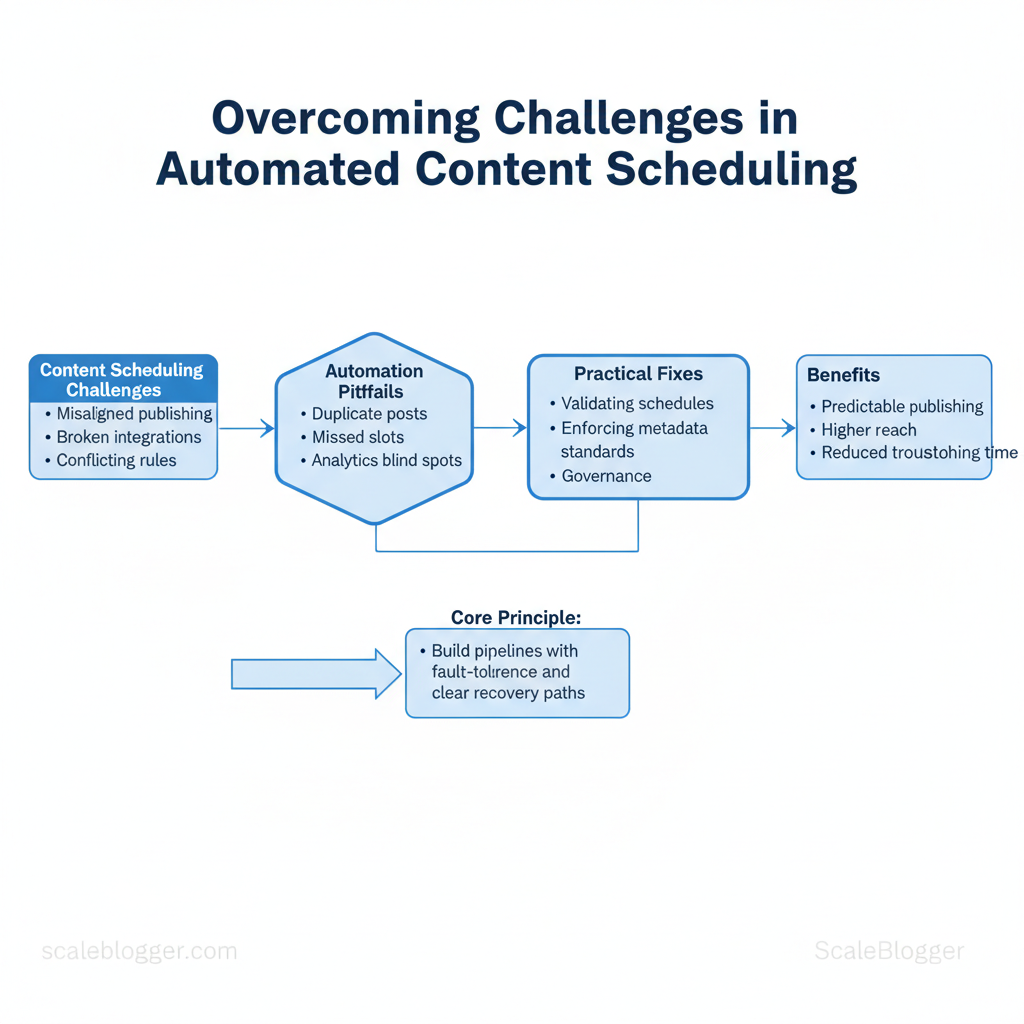
Marketing calendars collapse not because teams lack ideas, but because content scheduling challenges silently multiply: misaligned publishing windows, broken integrations, and rule sets that conflict across platforms. Those issues turn automation from a time-saver into a maintenance headache, eroding trust in systems designed to scale.
Automation can still unlock predictable publishing and higher reach, but only when pipelines are built with fault-tolerance and clear recovery paths. Practical fixes start with small, repeatable checks — from validating `cron`-style schedules to enforcing content metadata standards — and extend to governance that limits who can change routing rules. That mindset prevents common automation pitfalls such as duplicate posts, missed slots, and analytics blind spots.
Picture a content team that frees eight hours weekly by enforcing a single source of truth for assets, automated preflight checks, and a rollback rule for failed publishes. Troubleshooting then becomes routine instead of urgent, and performance gains compound.
- How to diagnose recurring scheduling failures quickly
- Configuration steps that prevent duplicate or missed publishes
- Recovery patterns for failed automated posts and rate-limit errors
- Governance rules to reduce human-induced automation breakage
Next, a step-by-step approach will show how to audit existing workflows and implement resilient scheduling patterns.
What You’ll Need (Prerequisites)
Start with the accounts, permissions, and minimal skills that remove friction during implementation. Prepare these items before building an automated content pipeline so handoffs, API calls, and scheduled publishing run without delays.
- CMS admin account — full publishing rights, plugin access.
- Social scheduler account — scheduling and RSS-to-post integrations.
- Analytics property access — view and edit for tracking and UTM verification.
- Team collaboration workspace — channel and project access for content workflows.
- API/Webhook console access — ability to create and rotate `API keys` and configure `webhooks`.
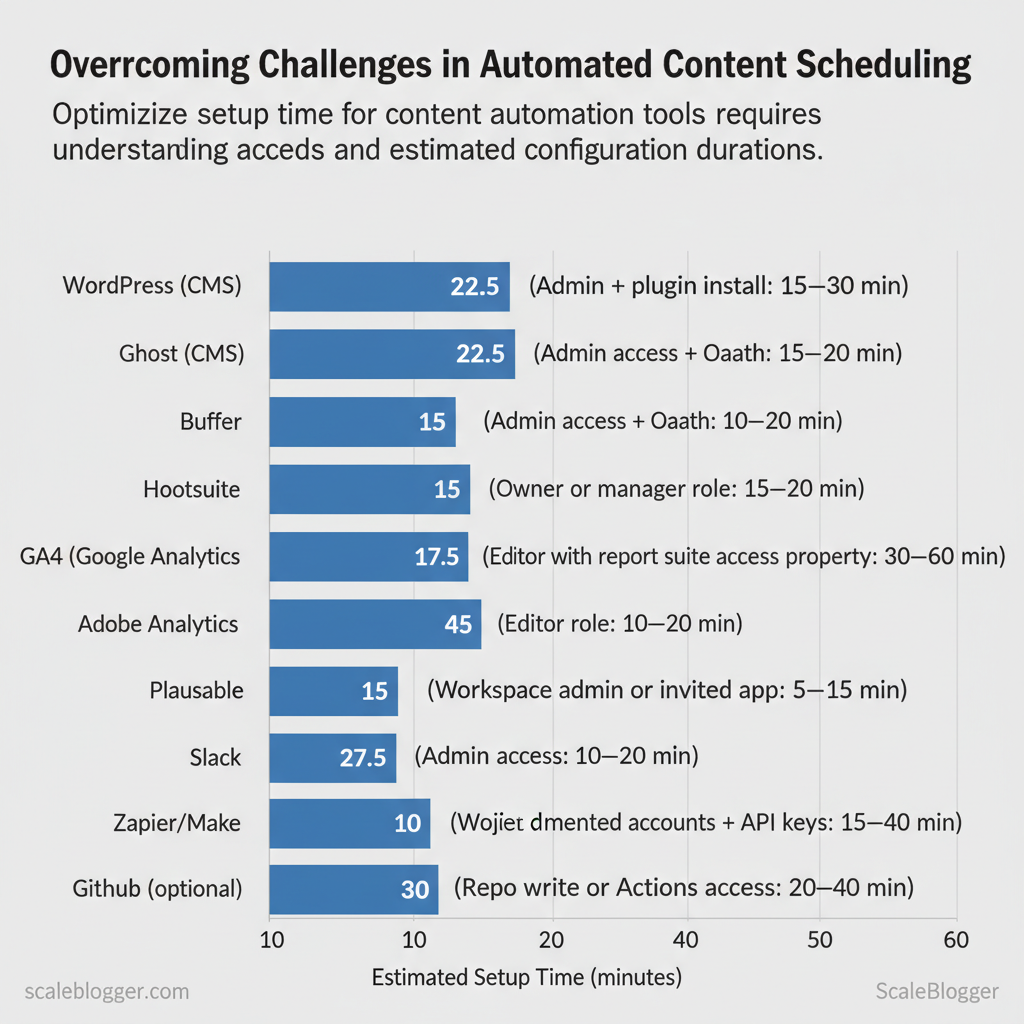
Skills and time estimates
| Tool/Resource | Required Access/Permission | Why it’s needed | Estimated setup time |
|---|---|---|---|
| WordPress (CMS) | Admin + plugin install | Publish, SEO plugins, webhook endpoints | 15–30 min |
| Ghost (CMS) | Admin + API key | Server-side publishing, content API | 15–30 min |
| Buffer | Admin access + OAuth | Scheduled posts, RSS import, API | 10–20 min |
| Hootsuite | Owner or manager role | Multi-network publishing, team approvals | 15–30 min |
| Later | Editor role | Visual scheduling, Instagram support | 10–20 min |
| GA4 (Google Analytics) | Editor or Admin on property | Tracking, conversion events, UTM verification | 10–25 min |
| Adobe Analytics | User with report suite access | Enterprise tracking and segments | 30–60 min |
| Plausible | Admin access | Privacy-first analytics, simple events | 10–20 min |
| Slack | Workspace admin or invited app | Notifications, approvals, webhooks | 5–15 min |
| Asana | Project admin or member | Task flows, approvals, deadlines | 10–20 min |
| Zapier/Make (Integromat) | Connected accounts + API keys | Orchestration between CMS, scheduler, analytics | 15–40 min |
| GitHub (optional) | Repo write or Actions access | CI, content versioning, deployments | 20–40 min |
Understanding these prerequisites shortens deployment time and prevents last-minute permission holds. When configured correctly, the pipeline runs reliably and frees teams to iterate on content strategy rather than firefight integrations.
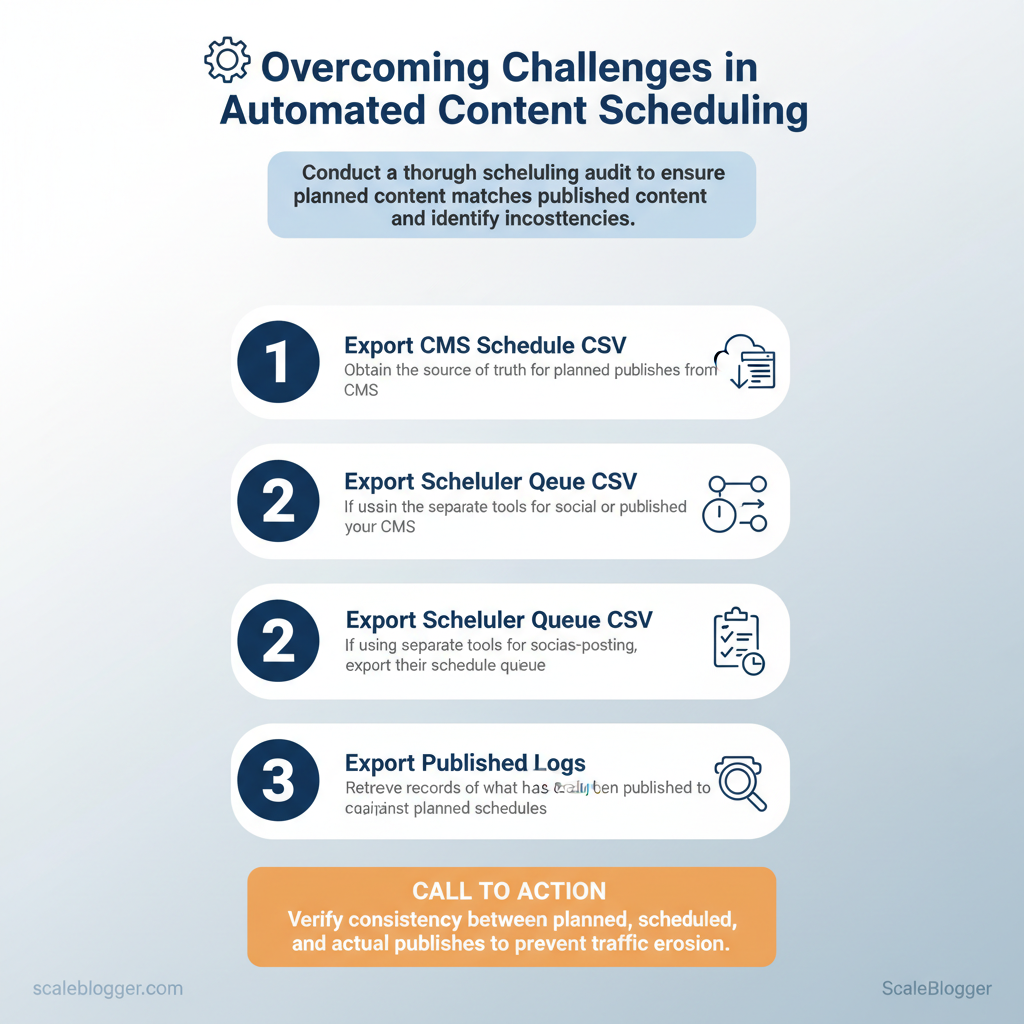
Step 1 — Conduct a Scheduling Audit
Start by verifying what you think is scheduled matches what will actually publish. A scheduling audit exposes inconsistencies that quietly erode traffic: missed posts, time-zone drift, duplicate publishes, and scheduler/CMS mismatches. The goal is a deterministic map from planned item → scheduled date/time → actual publish record.
What to export and why
What this looks like in practice:
- Planned schedule: columns include `post_id`, `slug`, `planned_publish_datetime`, `author`.
- Scheduler queue: columns include `job_id`, `target_platform`, `scheduled_time`, `status`.
- Published log: columns include `post_id`, `slug`, `actual_publish_datetime`, `status_code`.
Run the comparison (step-by-step)
“`sql — simple example: find planned vs actual drift SELECT s.post_id, s.slug, s.planned_publish_datetime AT TIME ZONE ‘UTC’ AS planned_utc, p.actual_publish_datetime AT TIME ZONE ‘UTC’ AS actual_utc, EXTRACT(EPOCH FROM (p.actual_publish_datetime – s.planned_publish_datetime))/60 AS time_diff_minutes FROM schedule s LEFT JOIN published_log p USING (post_id); “`
Common error patterns to log
- Time zone drift: scheduled in local time but published in UTC → consistent offset.
- Duplicates: retry logic creating multiple publishes.
- Missing posts: failed jobs or content approvals blocking publish.
Step 2 — Identify Common Automation Pitfalls
Start by scanning logs and UX patterns for repeatable failures; the most productive diagnostics are those that map a concrete symptom to a single, testable check. Practical troubleshooting reduces mean time to repair and prevents recurring incidents by fixing root causes rather than symptoms.
Common pitfalls typically surface as timing errors, rate-limit responses, duplicate actions, webhook delivery failures, and metadata mismatches. Each has distinct signals in scheduler, API, and webhook dashboards that point to the corrective action. Below are the fastest checks to run when an automation behaves unexpectedly, plus short examples you can run immediately.
- Server vs scheduler time: compare `date` on the server and the scheduler UI timestamps.
- HTTP 429 / 5xx errors: inspect API response codes and rate-limit headers.
- Repeated event IDs: examine webhook payload `event_id` or timestamp fields.
- Delivery logs: check webhook delivery success/failure counts and last failed payload.
- Content metadata: validate `slug`, `publish` flag, and taxonomy fields in the content JSON.
| Pitfall | Symptoms in logs/UX | Immediate Diagnostic | Quick Fix / Workaround |
|---|---|---|---|
| Time zone mismatch | Posts scheduled at odd hours; timestamps off | Compare server `date` vs scheduler UI; check DB `created_at` | Set scheduler to UTC or align server TZ; migrate timestamps |
| API rate limits | HTTP 429 responses; delayed processing | Inspect API headers `Retry-After`; count 429s per minute | Implement exponential backoff + queue; throttle clients |
| Duplicate triggers | Duplicate posts; repeated webhook deliveries | Check webhook `event_id` and delivery counts | Deduplicate by `event_id`; add idempotency keys |
| Webhook failures | 500/timeout entries; missed actions | Review webhook delivery logs and last failed payload | Retry failed payloads; increase timeout; add retries |
| Metadata mismatches | Wrong slug/taxonomy; unpublished content | Validate content JSON fields (`slug`,`publish_flag`) | Validate schema on ingest; reject malformed payloads |
If an integrated pipeline is needed to automate these checks and standardize diagnostics, consider an AI-enabled content pipeline to surface anomalies and suggest fixes—Scale your content workflow with tools designed for this exact problem at https://scalebloggercom. Understanding these principles helps teams move faster without sacrificing quality.
Step 3 — Step-by-Step Fixes (Numbered Actions)
Start by treating the scheduling layer like a transactional system: make reversible changes, verify each step, and only widen the blast radius once validation passes. Below are precise, numbered actions to restore reliable scheduling after automation failures, with time estimates, expected outcomes, and troubleshooting notes so teams can act confidently.
Prerequisites
- Access: Admin API keys, CI/CD access, scheduler UI credentials.
- Tools: `curl` or Postman for webhooks, log aggregator (ELK/Datadog), spreadsheet for reconciliation.
- Time estimate: 60–180 minutes for triage and safe rollback; additional 2–6 hours for full reconciliation depending on scale.
Step 4 — Re-run and Validate (Monitoring & QA)
Run a short, controlled re-run and validate every change before scaling. Start small, watch systems and content closely for 72 hours, and treat this window as the highest-sensitivity period for delivery, SEO impact, and user experience.
Prerequisites and tools
- Prerequisite: A reproducible test batch (5–20 posts or pages) that mirrors production metadata and media.
- Tools: log aggregation (e.g., `ELK`-style), uptime/alerting (PagerDuty or similar), synthetic monitoring (transaction checks), and a lightweight QA dashboard.
- Optional: Use an AI content scoring tool or the Scaleblogger.com platform to benchmark content quality and SEO signals.
Validation checklist (use for each batch)
- Test publish completed: logs show no retries and zero 5xx errors.
- CDN cache hit rate: acceptable range >70% within 24 hours.
- Structured data present: schema validates with no warnings.
- Internal links resolved: no broken internal breadcrumbs.
- Image assets served: correct `Content-Type` and sizing.
Troubleshooting tips
- If images fail, recheck origin path and CDN invalidation timing.
- If crawl errors spike, temporarily pause rate-heavy processes and review robots rules.
Step 5 — Hardening Automation: Best Practices & Architecture
Reliable scheduling is built on predictable idempotency, resilient retries, clear environment separation, and rich observability. Start by treating scheduling events as first-class, immutable entities with `event_id`s and deterministic handlers; combine that with exponential backoff on transient failures, strict separation between staging and production schedules, and structured logs + tracing so SLAs are enforceable and measurable.
Design patterns and policies (prerequisites)
- Required: unique event IDs, durable message store, retries with jitter, role-based access controls, structured logging pipeline.
- Tools: job queue (e.g., `RabbitMQ`, `SQS`), distributed tracing (`OpenTelemetry`), central logging (`ELK`/`Datadog`), secrets manager.
- Time estimate: 2–6 weeks for a basic hardened pipeline; 8–12 weeks for enterprise-grade RBAC and full observability.
Code example — simple backoff policy (Python pseudocode) “`python def retry_with_backoff(func, retries=5, base=0.5, cap=30): for attempt in range(retries): try: return func() except TransientError: wait = min(cap, base (2 attempt)) (1 + random()) time.sleep(wait) raise PermanentFailure(“Exceeded retries”) “`
| Pattern | What it prevents | Implementation effort | Estimated benefit |
|---|---|---|---|
| Idempotency / unique IDs | Duplicate executions, double publishes | Low (write-once check + DB unique index) | Very high — prevents data duplication |
| Exponential backoff | Cascade failures from transient API errors | Low–Medium (lib + error classification) | High — reduces retries during outages |
| Staging/production separation | Accidental production changes from tests | Medium (envs, feature flags, separate creds) | High — safe testing and rollout |
| Observability & structured logs | Silent failures and long MTTR | Medium–High (tracing + log pipeline) | Very high — fast detection + SLA tracking |
| RBAC for automation | Unauthorized or runaway automation actions | High (policy, auditing, admin workflow) | High — prevents privilege escalation |
Troubleshooting tips
- If duplicate jobs still occur, check clock skew and ensure DB unique constraints.
- If retries spike, inspect upstream API circuit-breakers — reduce parallelism temporarily.
- If observability shows gaps, add `trace_id` to every log line and instrument consumer libraries.
Step 6 — Troubleshooting Common Issues
When an automated publish fails or behaves unexpectedly, start by matching the visible symptom to a short diagnostic path and an immediate workaround, then collect evidence for a permanent fix or vendor escalation. Rapid, repeatable checks save hours: check the scheduler state, examine CMS activity logs, validate webhook deliveries, and confirm asset availability before changing configuration or code. Below are concrete workflows, log queries, and escalation criteria that teams use to restore service quickly and prevent recurrence.
Quick workflows and common fixes
Log snippets and exact diagnostics
- Search for publish attempts: `grep “publish” /var/log/cms/activity.log | tail -n 50`
- Filter by content ID: `jq ‘select(.content_id==”12345″)’ /var/log/cms/activity.json`
- Webhook failures: `grep “webhook” /var/log/integration/webhooks.log | grep “timeout”`
When to escalate and what to provide
- Escalate after repeat failures: escalate to vendor if the same failure occurs for >30 minutes or after 3 automated retries.
- Required evidence for vendor support: include exact log snippets, scheduler job IDs, webhook delivery IDs, timestamps, and a brief reproduction path.
- Priority escalation: attach CSV of related events and the output of `systemctl status scheduler.service` or equivalent.
| Issue | Likely Root Cause | Quick Diagnostic | Escalation Threshold | |
|---|---|---|---|---|
| Post not publishing | Scheduler worker crashed | `systemctl status scheduler.service` | >30 min or 3 retries | |
| Duplicate publishes | Retry logic misfire | `grep “publish” /var/log/cms/activity.log | wc -l` | >2 duplicates/user complaint |
| Wrong publish time (TZ) | Timezone config mismatch | `date -u` vs CMS timezone setting | Any production mismatch >1 hour | |
| Missing media/assets | CDN purge or permission | `curl -I https://cdn.example.com/media/123` | Asset 404 for >10 minutes | |
| Webhook timeouts | Downstream endpoint slow | `grep “504” /var/log/integration/webhooks.log` | >3 timeouts per hour |
When diagnosing, document each step and keep reproducible artifacts. For repeat or complex failures, consider enhancing observability and using automated rollbacks; tools that automate publishing and monitoring, such as services to Scale your content workflow (https://scaleblogger.com), reduce firefighting and let teams focus on content quality. Understanding these routines accelerates recovery and prevents the same incident from reappearing.
📥 Download: Automated Content Scheduling Checklist (PDF)
Step 7 — Tips for Success & Pro Tips
Start small and instrument everything: publish in controlled batches, track each action with a unique identifier, and run short audits frequently so problems are caught before they scale. These operational habits turn brittle content pipelines into predictable systems that teams can scale without firefights.
Prerequisites
- Access control: Ensure CI/CD and publishing credentials are stored in a secrets manager.
- Observability: Logging and a lightweight dashboard for scheduled posts must exist.
- Versioning: Templates and content schemas should be in source control.
- Automation runner: a CI tool or scheduler (e.g., GitHub Actions, cron).
- Logging store: central logs with searchable fields.
- Runbook: a short incident playbook stored with your repo.
- Content dashboard: an internal view of publish queue and status (Scaleblogger.com can integrate this step as part of `AI content automation`).
Practical examples and templates
- Example — stagger schedule: publish 25 posts at 09:00, 25 at 12:00, 25 at 15:00 to avoid rate-limiting windows.
- Example — idempotency header: include `Idempotency-Key:
` with each POST so the endpoint ignores repeat requests.
Troubleshooting tips
- If rate-limited: back off exponentially and widen publish windows.
- If partial failures occur: use `event_id` to resume without duplication.
- If content drift appears: snapshot rendered HTML and diff against previous publish.
Appendix: Scripts, Checklists, and Templates
Reusable, copy/paste-ready templates accelerate execution and reduce decision friction during routine ops and incidents. Below are practical scripts and templates designed for scheduling automation, monitoring health checks, CSV diffing for content imports, incident management, and vendor escalation — each ready to drop into pipelines or adapt to internal tooling.
What’s included and why it matters
- Health check script — quick availability and dependency probe to run as a scheduled job.
- CSV diff template — exact column names to export from CMS or data feeds so imports remain consistent.
- Incident runbook — fields and a reproducible structure to triage and execute remediation.
- Vendor escalation email — timestamped template that captures logs and next steps for faster external resolution.
- Monitoring alert presets — suggested thresholds and messages to reduce alert fatigue.
health-check.sh — checks key endpoints and DB connection
URLS=(“https://example.com/health” “https://api.example.com/status”) DB_CONN=”user:pass@tcp(db.example.com:3306)/appdb” for u in “${URLS[@]}”; do status=$(curl -s -o /dev/null -w “%{http_code}” “$u”) echo “$(date -u +%FT%TZ) CHECK $u -> $status” if [ “$status” -ne 200 ]; then echo “ALERT: $u returned $status” | mail -s “Health-check alert” [email protected] fi donesimple DB check
mysqladmin ping -h “$(echo $DB_CONN | cut -d’@’ -f2 | cut -d’:’ -f1)” >/dev/null 2>&1 || echo “ALERT: DB unreachable” “`CSV diff template (exact columns to export)
- Required columns: `id`, `slug`, `title`, `status`, `published_at`, `author_id`, `word_count`, `category`, `tags`, `canonical_url`
- Use case: Detect additions/updates before bulk import with `csvdiff` or Python script
- Implementation time: 1–2 hours to wire into exporter
Vendor escalation template (email with log snippet) “`text Subject: URGENT: Service outage impacting [service] — Escalation needed
Time (UTC): 2025-11-30T14:12:03Z Impact: Production API 5xx errors, 40% traffic fail rate Logs (snippet): [2025-11-30T14:11:59Z] ERROR api.request id=abc123 status=502 backend=svc-xyz latency=120ms Requested action: Please investigate backend load balancing between nodes A/B and provide ETA within 60 minutes. Contact: [email protected], +1-555-0100 “`
| Artifact | Format | Use Case | Estimated Time to Implement |
|---|---|---|---|
| Health-check script | `bash` | Scheduled uptime and dependency checks | 1 hour |
| CSV diff template | `CSV (columns listed)` | Pre-import validation / content sync | 1–2 hours |
| Incident runbook | `Markdown` | Standardized incident response and ownership | 30–60 minutes |
| Vendor escalation email | `Plain text` | Fast escalation with timestamps & logs | 15 minutes |
| Monitoring alert presets | `YAML` | Alert rules for Prometheus/Datadog | 1–2 hours |
Understanding these patterns helps teams move faster without sacrificing quality. When implemented correctly, this approach reduces overhead and keeps decision-making close to the team.
Conclusion
Fixing a collapsing marketing calendar starts with three practical moves: audit the publishing rules, map every integration point, and automate the routing that causes the most missed windows. Teams that replace manual handoffs with rule-based workflows typically cut missed publishes and editorial churn within a single quarter — for example, a content team that automated asset approvals and scheduling eliminated late posts tied to calendar conflicts. Ask whether the effort will pay off: if your team spends more time reconciling calendars than creating headlines, prioritize automation of approval and scheduling steps first. If the question is how to begin, run a two-week experiment that captures where delays occur, then codify those steps into a reusable playbook.
Move from insight to action by setting a 30–60 day plan: identify the three highest-friction processes, define the success metric (missed publishes per month), and deploy a lightweight automation or rule to resolve one choke point. For teams looking to scale this approach, tools and services that centralize scheduling and content rules save time and reduce errors — to streamline evaluation, consider Explore Scaleblogger’s content automation services as one practical resource. Start with a short audit, automate the biggest bottleneck, and measure impact — that sequence turns calendar chaos into a predictable publishing engine.
