

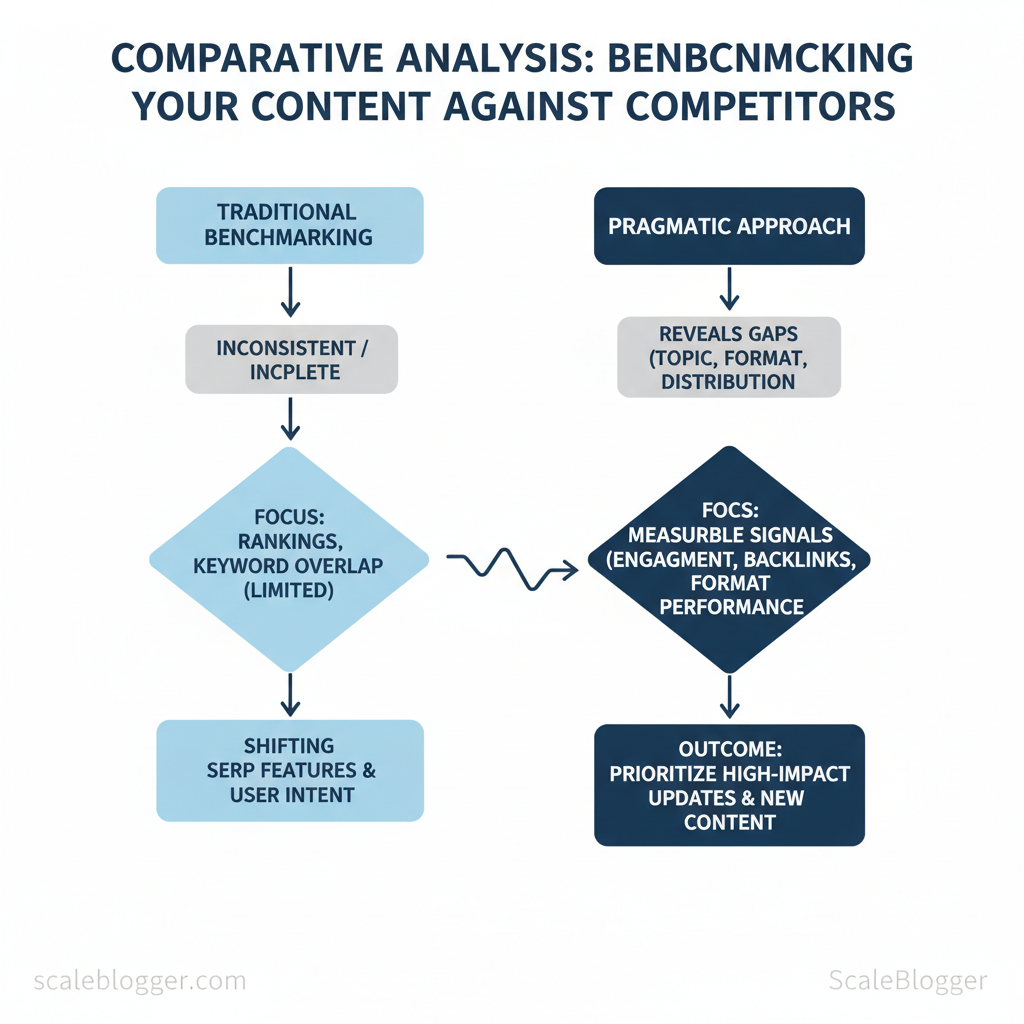
Marketing teams spend hours on content that often fails to beat competitors due to inconsistent or incomplete benchmarking. Rapidly changing SERP features and user intent make it clear that just tracking rankings does not explain who is winning and why.
A practical approach to competitive analysis reveals gaps in topic coverage, format, and distribution, not just in keyword overlap. When content benchmarking looks at measurable signals like engagement, backlinks, and format performance, teams can confidently prioritize important updates and new content. Picture a product marketing group that reportedly used engagement-based benchmarking to shift three cornerstone pages from long-form posts to interactive guides, which may have increased qualified traffic within two months.
This introduction outlines practical benchmarking techniques that eliminate guesswork and connect outcomes to business metrics. Expect stepwise methods, common pitfalls, and tools that automate data collection while preserving strategic judgment. The emphasis is on content benchmarking that scales, not on vanity metrics.
- What to measure beyond rankings and why it matters for conversions
- How to map competitor content formats to opportunity space
- Simple
datachecks that reveal high-impact update targets - Benchmarking techniques for prioritizing content roadmaps
- Ways to automate competitor data collection without losing context
Automate your content benchmarking with Scaleblogger: https://scaleblogger.com — this will speed competitor data collection and generate actionable benchmarking reports that feed the content roadmap.
> Key Takeaway: ## Define Your Benchmarking Goals and Scope
Start by connecting benchmarking to a clear business outcome. Choose one main KPI that relates directly to revenue or growth, like traffic for top-of-funnel, leads for demand generation, or rankings for…
Define Your Benchmarking Goals and Scope
Start by connecting benchmarking to a clear business outcome. Choose one main KPI that relates directly to revenue or growth, like traffic for top-of-funnel, leads for demand generation, or rankings for discoverability. Establish a realistic timeframe and target based on current baselines from your analytics and search console. This prevents teams from chasing vanity metrics and sets them up for measurable wins.
Prerequisites
- Access to analytics: Google Analytics (GA4) and Google Search Console credentials. Lead data: CRM access for content-sourced lead attribution. Competitive list: URLs for direct and aspirational competitors.
- Topic inventory: Existing content grouped into 3–5 topic clusters.
Tools and materials
- Google Analytics (GA4) for traffic and engagement baselines. 2.
Google Search Console for keyword rankings and impressions. 3. Internal CRM for lead attribution.
- A spreadsheet or dashboard tool (Looker Studio, Sheets) to track KPIs. 5.
Optional: an automated benchmarking solution such as the AI-powered content pipeline and benchmarking service from Scaleblogger to speed data collection and reporting.
How to choose measurable goals (step-by-step)
- ** If objective = increase demand, pick New leads from content as primary KPI. If objective = brand reach, pick Organic sessions.
- Use the last 90 days from GA4 and Search Console; for leads use the CRM’s attribution window. 3.
Pick 90 days for a sprint, 180–360 days for strategic shifts; target improvements of approximately 10–30% in 90 days depending on baseline volatility. 4. Lock which tool is the source of truth for each KPI to avoid reporting mismatches.
Define scope: topics, competitors, time range
- Topic clusters (3–5): Prioritize clusters aligned with product-market fit and revenue influence.
- Competitor set: Include 3 direct competitors (same audience & offering) and 2 aspirational competitors (higher traffic or domain authority).
- Time range: Use 90 days for iterative tests, 180–360 days to evaluate seasonality and compound SEO effects.
KPI templates with baseline and target columns to help readers copy realistic goals
Table: Section Content — KPI, Baseline , Target (90 days) & more**
| KPI | Baseline | Target (90 days) | Measurement tool |
|---|---|---|---|
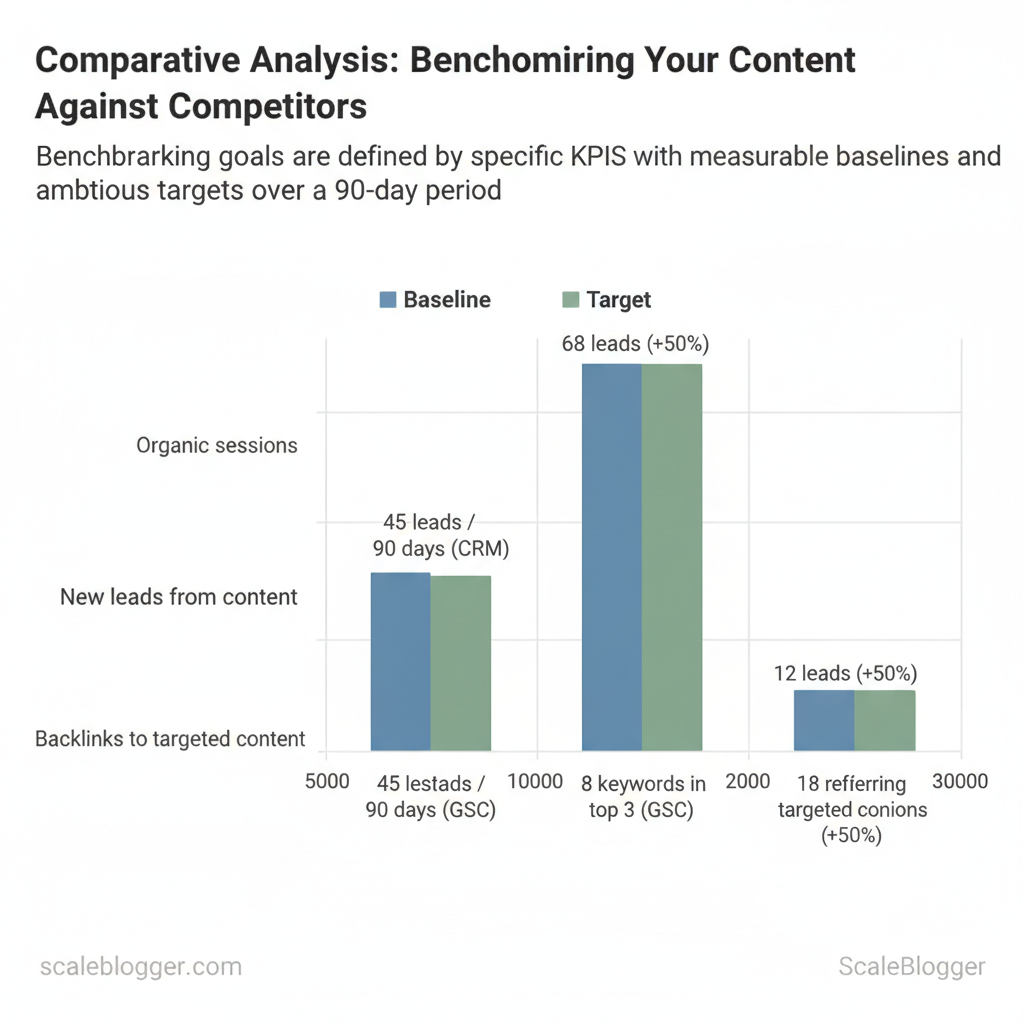
| Organic sessions | approximately 12,000 sessions / 90 days (GA4) | 14,400 (+20%) | Google Analytics (GA4) |
| New leads from content | approximately 45 leads / 90 days (CRM) | 68 leads (+50%) | Internal CRM (UTM attribution) |
| Top-3 keyword rankings | approximately 8 keywords in top 3 (GSC) | 12 keywords (+50%) | Google Search Console |
| Average time on page | approximately 1:45 (mm:ss) | 2:10 (+25%) | Google Analytics (engagement) |
| Backlinks to targeted content | approximately 18 referring domains | 27 referring domains (+50%) | Ahrefs / Majestic / GSC links |
Expected outcomes and time estimates
- 90-day sprint: Quick on-page wins, internal process changes — visible traffic and ranking movement.
- 180–360 days: Compounded authority gains, consistent lead growth, and stable rankings.
Troubleshooting tips
- If baselines are noisy, extend the baseline window to 180 days.
- If leads don’t move despite traffic growth, audit intent alignment in your topic clusters and CTAs.
- If competitor selection feels arbitrary, filter by shared keywords and overlap in audience intent.
Understanding how to set measurable goals and a tight scope turns benchmarking from a reporting exercise into a decision-making tool that accelerates content ROI. When implemented correctly, this approach reduces wasted effort and focuses teams on the few metrics that actually move the business.
> Key Takeaway: ## Collect Competitor Data Efficiently
Start by deciding the minimum set of metrics that answer business questions: where competitors get traffic, which keywords drive that traffic, which assets attract backlinks, and how audiences engage with…
Collect Competitor Data Efficiently
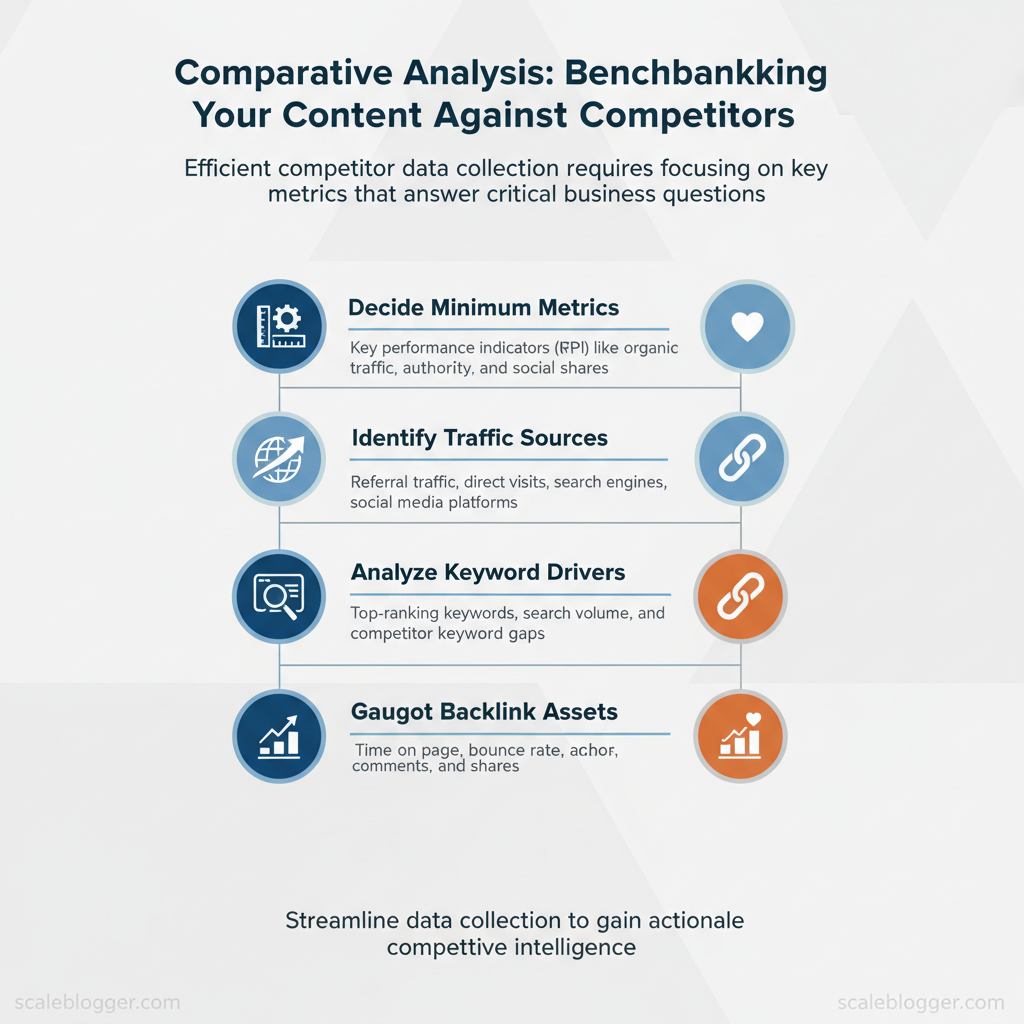
Start by deciding the minimum set of metrics that answer business questions: where competitors get traffic, which keywords drive that traffic, which assets attract backlinks, and how audiences engage with content. These metrics form a concise benchmarking backbone that teams can automate and iterate on without drowning in noise.
Prerequisites
- Access: Accounts for Google Analytics/GA4 and Search Console, and trial/paid access to one SEO platform.
- Tools: Spreadsheet (Google Sheets), API keys for chosen SEO tools, dashboarding tool (Looker Studio, Grafana, or internal BI).
- Time: 2–4 hours to wire initial automation; ongoing maintenance 30–60 minutes/week.
Essential metrics and measurement tips
- Traffic (sessions): Use GA4 for site-level sessions, normalize to sessions per article and per month. For competitors, estimate with tools that provide domain traffic. Keyword rankings: Track top 50 keywords per competitor, capture SERP position and search volume; export weekly for trend analysis.
- Backlinks: Record new referring domains, anchor text, and domain authority proxies; prefer referring-domain counts over raw link counts. Engagement (time on page, bounce): Use time-on-page and event metrics; compute rolling 30-day averages to reduce volatility. * Content depth / word count: Collect word counts and structural signals (H-tags, media count); normalize engagement per 100 words.
Quick automation and scraping best practices
- Choose APIs first: Use official APIs (
Search Console API,Google Analytics Data API,Ahrefs API,SEMrush API) for stable, TOS-compliant data pulls. 2.
Fallback to exports: Use CSV exports when API limits or plan restrictions block needed fields. 3. Rate limits & TOS: Respect API rate limits, cache results, and avoid scraping protected pages; schedule incremental pulls to stay under quotas.
- Normalize on ingest: Convert all timestamps to UTC, compute per-article averages, and tag by content pillar to compare like-for-like. 5.
Sample flow: API -> Google Sheets (or BigQuery) -> Transform layer -> Dashboard.
Sample automation flow (conceptual)
- Authenticate to
SEMrush API/Ahrefs API. 2.
Pull top keywords and backlink snapshots for 10 competitors. 3. Append results to Google Sheets via Sheets API.
- Use Looker Studio connected to Sheets for near-real-time visualization.
python
sample: pull keyword list and write to Google Sheets (pseudo)
import requests from googleapiclient.discovery import build

resp = requests.get("https://api.example-seo.com/top_keywords?domain=competitor.com&key=API_KEY") keywords = resp.json()["keywords"] sheets = build('sheets','v4',credentials=CREDS).spreadsheets() sheets.values().append(spreadsheetId=ID, range="Sheet1!A1", valueInputOption="RAW", body={"values":keywords}).execute()
Tools for each metric showing trade-offs (cost, accuracy, export options) so readers can choose quickly
| Metric | Recommended Tool | Cost level | Best for |
|---|---|---|---|
| Traffic (sessions) | Google Analytics (site) / SimilarWeb (estimates) / Semrush Traffic Analytics | GA: Free; SimilarWeb: $199+/mo; Semrush: $119.95+/mo | GA: precise site analytics; SimilarWeb/Semrush: competitor estimates |
| Keyword rankings | Semrush / Ahrefs / Moz / Serpstat | Semrush/Ahrefs: $120–$179+/mo; Moz: $99+/mo; Serpstat: $69+/mo | Rank tracking, SERP features visibility |
| Backlinks | Ahrefs / Majestic / Moz Link Explorer | Ahrefs: $99+/mo; Majestic: $49+/mo; Moz: $99+/mo | Fresh backlink indexes and referring-domain analysis |
| Engagement (time on page, bounce) | Google Analytics (GA4) / Hotjar (session replay) | GA4: Free; Hotjar: $39+/mo | GA4 for metrics; Hotjar for qualitative behavior |
| Content depth / word count | Screaming Frog / Sitebulb / Custom scraper | Screaming Frog: Free up to 500 URLs; paid $229/yr | Structural audit, word counts, H-tag extraction |
> Key Takeaway: ## Analyze Content Performance and Gaps
Start by mapping content into a practical quadrant: volume (search/impression potential) on the X-axis and quality (engagement/conversion performance) on the Y-axis. Plot each URL or topic by combining…
Analyze Content Performance and Gaps
Start by mapping content into a practical quadrant: volume (search/impression potential) on the X-axis and quality (engagement/conversion performance) on the Y-axis. Plot each URL or topic by combining objective measures: search volume or impressions for volume; bounce rate, time on page, and conversion rate for quality. Use a composite score per axis so comparisons stay consistent.
Prerequisites
- Access: Search Console, Google Analytics (or GA4), Ahrefs/SEMrush export, competitor site crawl
- Tools: Spreadsheet, basic BI tool (Data Studio/Looker), Scaleblogger content pipeline where automation speeds scoring
- Time estimate: approximately 4–8 hours for a mid-size domain (100–300 pages)
How to calculate the quadrant axes
- Volume score (0–100): normalize monthly search volume or impressions per topic to a 0–100 scale. 2.
2 (conversion_rate_norm)`. 3. Plot each topic at (Volume, Quality).
Quadrants then read as: high-volume/high-quality = scale; high-volume/low-quality = content; low-volume/high-quality = expand into clusters; low/low = deprioritize.
Gap score components and weighting suggestions
- Search demand gap (40%): how much traffic competitors capture vs. you
- Content depth gap (30%): topic breadth and subtopic coverage
- Recency/authority gap (20%): freshness and backlink profile
- Engagement gap (10%): how well competitor pages convert or retain users
Gap Score = 0.4Demand + 0.3Depth + 0.2Authority + 0.1Engagement (scale 0–100). Prioritize topics with high demand and high gap score first.
Topic overlap matrix and content cluster gap table
Content gap analysis template
| Topic/Subtopic | Your Coverage (Y/N & depth) | Competitor A Coverage | Competitor B Coverage | Gap Score |
|---|---|---|---|---|
| Core Topic 1 | Y — Comprehensive pillar (4,200 words) | ✓ — Comprehensive pillar | ✓ — Brief overview | 72 |
| Subtopic A | Y — Brief guide (900 words) | ✓ — Deep how-to | ✗ — — | 81 |
| Subtopic B | N — not covered | ✓ — Long-form case study | ✓ — FAQ + examples | 88 |
| Core Topic 2 | Y — FAQ + checklist (1,100 words) | ✗ — — | ✓ — Medium guide | 60 |
| Subtopic C | Y — Short blog (700 words) | ✗ — — | ✗ — — | 45 |
Execution steps
- Export keyword and URL lists, normalize scores, and compute gap scores. 2.
Rank opportunities by Demand x Gap Score. 3. Create a 5–10 item prioritized opportunity list (start with the highest combined score).
- Use the content pipeline to assign briefs and publish cadence.
When implemented this way, teams reduce churn on low-impact updates and focus effort where measurable opportunity exists. This approach makes editorial roadmaps predictable and performance-driven.
Craft a Competitive Content Plan
Start by treating content decisions as triage: decide whether to update, create, or promote based on measurable signals like traffic, ranking, and conversion potential. A tight decision framework prevents wasted production hours and focuses resources where impact is highest. Use simple triggers — declining traffic with steady impressions → update; no coverage + strategic keyword → create long-form; strong-performing pages with low conversion → promote — and apply consistent KPI targets so outcomes are reproducible.
Prioritization matrix: update vs create vs promote
‘Update’, ‘Create’, and ‘Promote’ actions across criteria (effort, time to impact, best tactics)
| Action | Typical Effort | Time to Impact | Best Tactics |
|---|---|---|---|
| Update existing post | Medium (2–6 hours) | Short (2–8 weeks) | Technical SEO fixes, add new sections, refresh stats, internal links |
| Create new long-form article | High (10–30+ hours) | Medium (8–16 weeks) | Deep keyword research, expert interviews, comprehensive structure |
| Create short-form or social asset | Low (1–3 hours) | Immediate (0–4 weeks) | Repurpose snippets, micro-content, platform-optimized creatives |
| Promotion / PR push | Medium–High (5–20 hours) | Short–Medium (1–8 weeks) | Outreach, sponsored placements, press releases, influencer amplification |
| Repurpose into other formats | Low–Medium (2–8 hours) | Short (2–6 weeks) | Turn posts into videos, podcasts, slide decks, gated resources |
Editorial brief and KPI targets
- Prerequisites: access to analytics, keyword data, CMS editor, template library, and internal linking map. Time estimate: 2–4 hours to produce a brief.
- Editor fields to complete (must be filled before production):
- Title / Working headline — target keyword and intent
- Primary KPI —
organic views/mo,leads/mo, orbacklinks - Secondary KPIs — time on page, CTR, conversions
- Target audience & persona — use-case, pain points
- Top 3 competitor URLs — what to beat and why
- Required sections & word count —
H2scaffold, media needs - Internal links to include — 3–5 priority pages
- Technical SEO checklist — canonical, schema, meta, alt text
- Promotion plan — channels and budget
Example KPI targets by content type:
- Long-form pillar:
10k organic views/mowithin 6 months,15 backlinksfirst 6 months, lead rate0.5% - Update: traffic uplift
+20%in 8 weeks, maintain top-10 ranking for target keyword - Short-form: social reach
5k impressionsand2% engagement ratefirst month
Process steps for repeatability
- Run analytics and tag candidates.
- Apply prioritization matrix to choose action.
- Complete editorial brief and assign owner.
- Produce with
technical SEO checklistenforced. - Schedule promotion and measure against KPIs.
Understanding these rules lets teams act quickly and measure results consistently. When implemented, this approach funnels effort to the highest-impact content without adding coordination overhead.
Measure, Report, and Iterate
Start measuring from day one and make reporting the operational heartbeat of the content program. Track short-window signals weekly to catch execution issues and leading indicators, then use monthly and quarterly views to validate SEO traction and strategic direction. Dashboards should be actionable: every widget exists to answer a single question and to trigger one of three responses — fix, iterate, or scale.
What to monitor and when
- Weekly — execution signals: publishes, index status, crawl errors, impressions by page, CTR, and content QA flags. Monthly — performance trends: organic sessions, keyword rankings (tracked set), conversion rate by content type, backlinks acquired. Quarterly — strategic health: topical authority growth, content velocity vs.
competitors, funnel influence (assisted conversions).
Dashboard widgets and their purpose
- Publish cadence widget: shows planned vs. shipped content; triggers resource reallocation when behind schedule. Top-10 keyword movers: identifies pages gaining/losing rankings; triggers prioritization for refreshes.
- Engagement funnel: sessions → time-on-page → scroll depth → conversion; exposes UX or intent mismatch. Technical health score: crawlability, index coverage, Core Web Vitals aggregated; flags urgent dev work. Experiment tracker: active tests, status, primary metric, and next decision date.
- Build a dashboard that answers three questions: Did we ship? Did users respond? Do we have enough signal to decide?
- Wire alerts to
email/Slack for critical thresholds (e.g., >30% drop in impressions, indexability failures). - Use the dashboard to create weekly short reports and a monthly decision memo that calls for one concrete action.
Experiment templates and measurement windows
- Design: hypothesis → variant → primary metric (
organic sessions,rankings, orCTR) → sample size target. - Measurement window: allow 4–8 weeks for on-page tests (indexing lag), 8–12 weeks for experiments targeting rankings.
- Capture: store test briefs, raw results, and a one-paragraph learning in a living playbook.
Provide a simple experiment brief:
markdown Title: H1/Meta rewrite for topic X Hypothesis: Improve CTR will increase organic sessions Variant: New meta + H1 Primary metric: Search CTR (2-8 weeks) Decision point: If CTR +15% then roll out; if -10% rollback Notes: Target 500 impressions minimumProvide a 90-day experiment timeline template showing when to test, measure, and iterate
| Week | Activity | Metric to Measure | Decision Point |
|---|---|---|---|
| Weeks 1-2 | Publish test variant; submit sitemap; monitor index status | Indexing, impressions, initial CTR | Continue if indexed; pause if not indexed after 2w |
| Weeks 3-4 | Monitor user signals; fix technical issues; collect early CTR data | CTR, bounce rate, avg. time on page | If CTR +10% continue; if CTR -10% revert |
| Weeks 5-8 | Observe ranking movement; assess backlink pickup | Keyword rank, organic sessions, backlinks | If rank improving → expand test; if flat → iterate content |
| Weeks 9-12 | Final measurement window; A/B analysis for lift | 90-day sessions, conversions, assisted conversions | Scale if sustained lift; otherwise document learnings |
| Review & Plan | Consolidate results; update playbook; plan next cycle | Net traffic lift, ROI, effort hours | Escalate to strategy if >20% topical lift or repeat failures |
Capture learnings as structured entries in a shared playbook, and convert repeated wins into templates or automated rules (the client’s AI-powered pipeline fits naturally here). When patterns persist across tests, elevate them to strategy-level changes rather than one-off tweaks. Understanding these measurement rhythms helps teams make faster, lower-risk decisions while preserving long-term SEO momentum.
📥 Download: Content Benchmarking Checklist (PDF)
Scale Benchmarking with Automation and Teams
Effective scaling of benchmarking happens when governance and automation are set up to empower teams to make decisions while ensuring measurements stay accurate and repeatable. Start by assigning clear ownership for the benchmark lifecycle, set SLAs for data freshness and validation, and deploy a minimal, battle-tested automation playbook that ties alerts to human handoffs. The result: teams iterate faster because they trust the underlying metric system and receive signals only when action is needed.
Map roles to responsibilities and expected outputs to clarify governance
Table: Section Content — Role, Primary Responsibility, Deliverables & more
| Role | Primary Responsibility | Deliverables | Cadence |
|---|---|---|---|
| Benchmark Owner | Define benchmark scope, targets, and success criteria | Benchmark charter, SLA doc, KPI definitions | Quarterly strategy + monthly review |
| Data Analyst | Ingest, validate, and model data for benchmarks | Clean datasets, dashboards, anomaly reports | Daily pipelines + weekly reports |
| Content Editor | Translate benchmark insights into editorial tasks | Content briefs, optimization tickets, A/B test plan | Weekly planning + per-campaign updates |
| Growth / Performance Lead | Tie benchmarks to revenue/traffic outcomes and prioritize experiments | Experiment backlog, ROI calculations, prioritization framework | Bi-weekly sprint reviews |
| Agency / Contractor | Execute scaled content ops and short-term experiments | Drafts, briefs, campaign analytics | Deliverable-based (sprints) |
- Roles, responsibilities, and governance — practical steps
- Assign a single Benchmark Owner responsible for target-setting and SLA enforcement.
- Create an SLA for data freshness: near-real-time for paid channel metrics (≤1 hour), daily for organic traffic, weekly for cohort analyses.
- Establish handoffs: analysts push validated anomaly alerts to a shared
#benchmarkschannel; content editors must acknowledge within 24 hours and schedule remediation within 72 hours. - Lock KPI definitions in a versioned doc to prevent metric drift.
Automation playbook and toolchain — minimum viable components
- Data ingestion: connector to analytics (GA4), CMS exports, and SERP trackers. Warehouse + modeling: central table with canonical content IDs and normalized metrics. Orchestration: job scheduler (Airflow or managed alternatives) for ETL.
- Alerting: rule engine that posts to Slack or webhook when thresholds breach. * Dashboarding: read-only dashboards for teams with links to source queries.
Examples of alert triggers to watch
- Traffic drop >20% week-over-week for top 10 landing pages.
- CTR decline >15% from SERP impressions baseline for pages ranking position 1–5.
- New content failing to reach baseline engagement within 30 days.
Guidance on cost vs ROI for custom tooling
- Start lean: use managed connectors and existing BI tools to validate use cases before investing.
- Custom tooling justified when automation saves >10 hrs/week across teams or improves content velocity such that revenue lift exceeds tooling TCO within 6–12 months.
- Measure ROI by tracking time-to-action, experiment throughput, and conversion lift pre/post-automation.
yaml Example SLA snippet for data freshness
data_sources: ga4: refresh: daily paid_ads: refresh: hourly serptool: refresh: daily alert_ack: 24h remediation_window: 72hWarnings and tips blend into operations: avoid over-alerting by tuning thresholds and grouping related signals; maintain a one-page playbook so new team members can join the feedback loop quickly. Understanding these principles helps teams move faster without sacrificing quality. When implemented correctly, this approach reduces overhead by making decisions at the team level.
Conclusion
From the examples and tactics discussed, the best path forward is transforming benchmarking from a one-time audit into a continuous, automated part of your content workflow. Teams that shift to routine competitor data collection and gap analysis reclaim hours and surface actionable opportunities faster—often revealing overlooked queries, thin pages, and high-opportunity topics that manual checks miss. From the methods discussed, three outcomes matter most:
- Automate competitor data collection to free analyst time and ensure consistent comparisons.
- Prioritize pages by opportunity and intent so effort targets measurable traffic gains. – Run monthly benchmarks to track shifts in SERP features and evolving user intent before they erode traffic.
If the next question is how to get started or how long before improvements appear: set up the automation and a 30–60 day testing window for the first optimization cycle; expect clearer prioritization immediately and measurable traffic movement within two to three cycles. For a practical first step, export one content cohort (top 50 pages), automate competitor pulls, and run a baseline report to identify the top five pages to rework.
For teams ready to skip manual collection and accelerate that cycle, Automate your content benchmarking with Scaleblogger — use it to schedule competitor scans, generate benchmarking reports, and convert the patterns highlighted above into repeatable wins.
