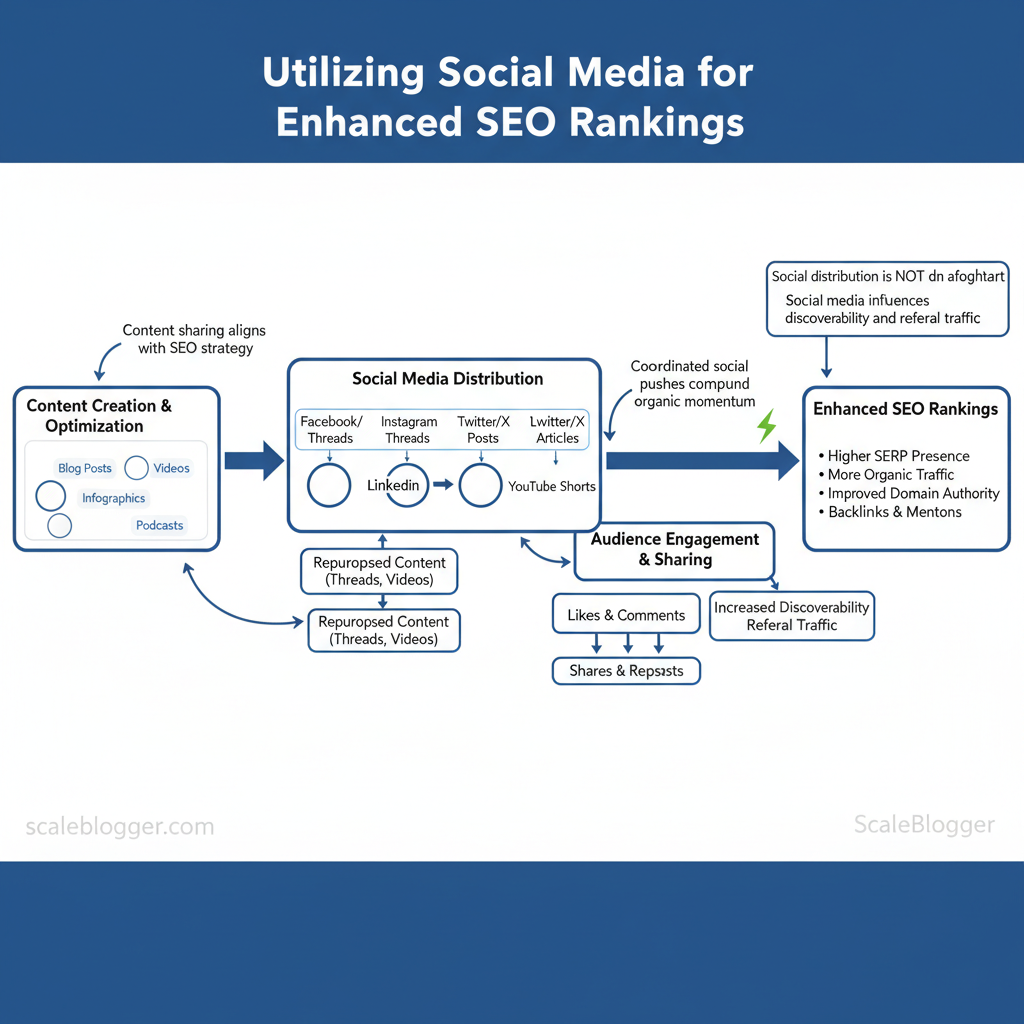
Brands pour resources into on-page SEO while ignoring a powerful amplifier sitting in plain sight: social media SEO. Content that gains traction on networks still influences discoverability, referral traffic, and the signals search engines use to rank pages. When social distribution is treated as an afterthought, links, engagement, and topical relevance are diluted before they ever reach search algorithms.
- What tactical post formats improve discoverability and backlink potential
- How to map social platforms to keyword intent and topical clusters
- Low-effort ways to scale social amplification without losing SEO signals
- Metrics to measure social impact on rankings and referral growth
How Social Media Impacts SEO
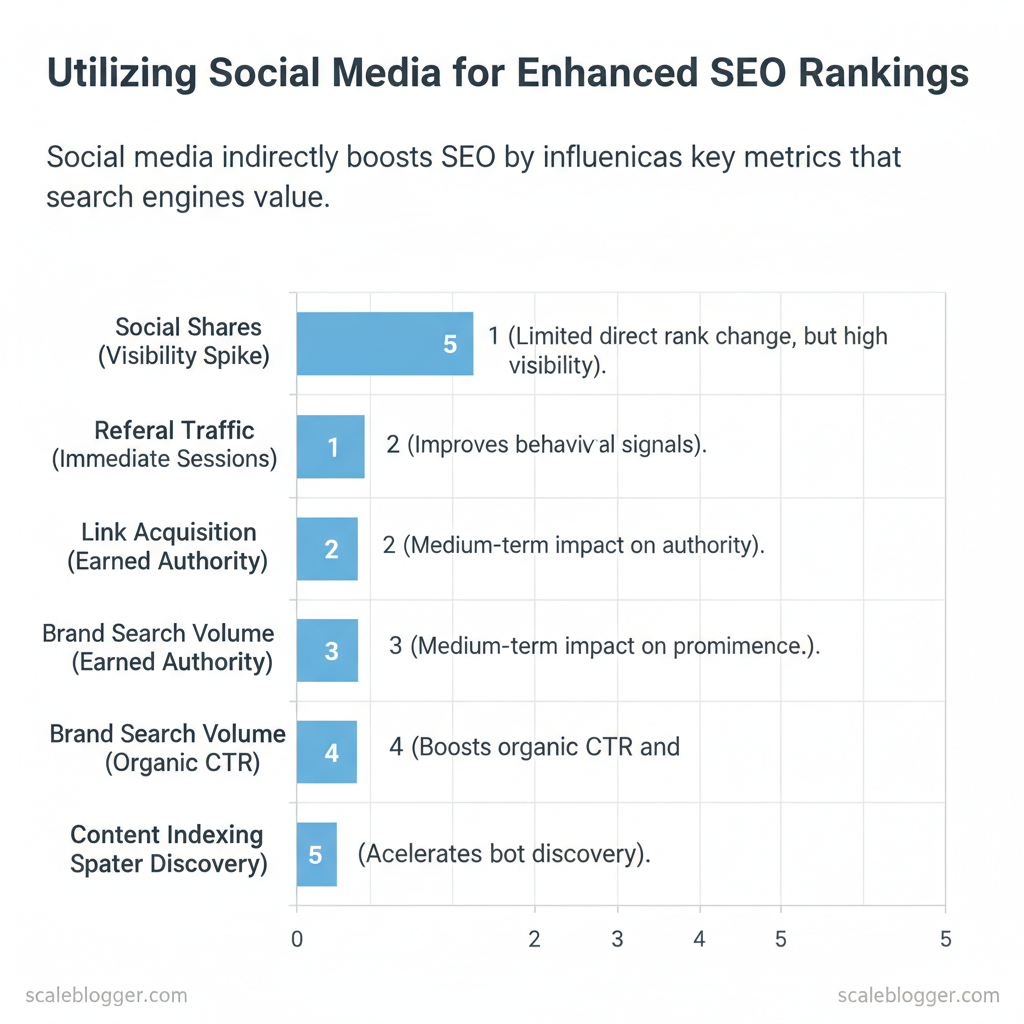
Search engines do not treat social signals (likes, shares) as primary ranking signals, yet social activity influences the SEO ecosystem through measurable, indirect pathways. Social channels drive referral traffic, increase content visibility that leads to earned backlinks, boost branded search volume, and can speed up content discovery and indexing. Measuring those downstream effects—referral traffic, backlinks, impressions, organic CTR, and branded searches—lets teams turn social activity into verifiable SEO outcomes rather than guesswork.
How that plays out practically:
- Social visibility: A viral post raises impressions and branded searches, increasing organic click-through potential.
- Referral engagement: Traffic from platforms raises dwell time and page view depth, which correlate with improved organic performance.
- Link acquisition pipeline: Public social distribution creates linkable opportunities for journalists and bloggers who monitor platforms for stories.
- Indexing and freshness: Active promotion accelerates bot discovery when combined with sitemaps and proper canonicalization.
Tools and metrics to use
- Google Analytics / GA4: referral traffic, session duration, conversions
- Google Search Console: impressions, organic CTR, indexed pages
- Ahrefs / Moz / Majestic: backlink acquisition, referring domains
- Platform analytics (Twitter/X, Facebook, LinkedIn, Instagram): post impressions, engagement rate
- BuzzSumo: content virality and influencer pickup
- Scaleblogger.com can automate the content distribution cadence and connect social referral trends to content performance for faster iteration
| Mechanism | Is it a direct ranking factor? | Typical short-term SEO impact | How to measure |
|---|---|---|---|
| Social shares | ✗ | Visibility spike; limited direct rank change | Platform analytics, UTM clicks in GA4 |
| Referral traffic | ✗ | Immediate sessions and engagement; can improve behavioral signals | GA4 referral reports, session quality metrics |
| Link acquisition | ✗ (indirect) | Medium: earned links improve authority over weeks | Ahrefs new backlinks, referring domains |
| Brand search volume | ✗ (indirect) | Higher branded queries boost organic CTR and SERP prominence | GSC queries (branded terms), Google Trends |
| Content indexing speed | ✗ (indirect) | Faster discovery when content is widely shared | GSC URL Inspection, crawl stats |
Expected outcomes: better referral-to-organic conversion rates, accelerated link pickup, and clearer attribution of social-to-SEO value. When teams tie social distribution to these metrics and iterate weekly, content gains sustainable search visibility without relying on ephemeral signal assumptions.
Creating Social Content That Helps SEO
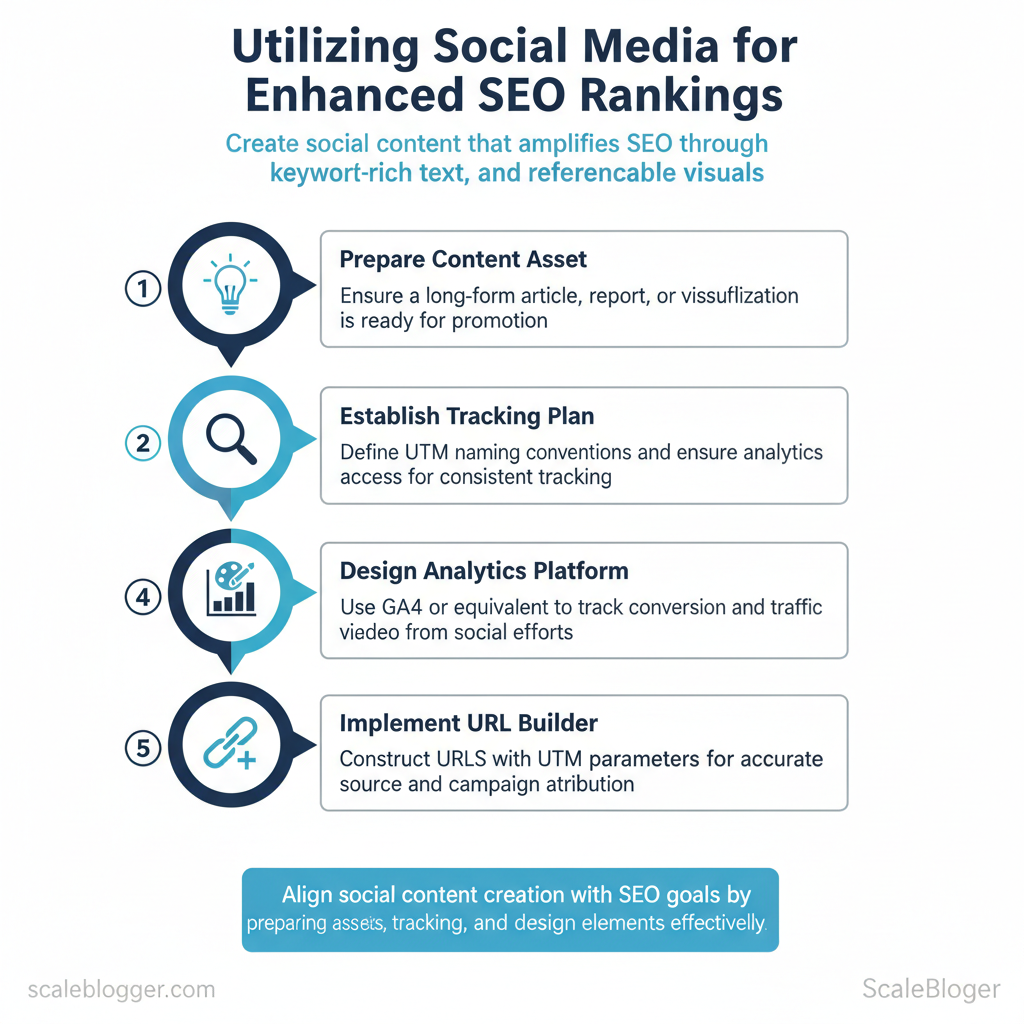
Social content can drive SEO when it amplifies linkable assets, supplies descriptive search-friendly text, and creates referenceable visual signals that earn backlinks. Prioritize social posts that point users (and crawlers indirectly) to long-form resources, surface keyword-rich copy for indexing, and use visuals that other sites will cite. This works because search engines reward authoritative signals—shares, earned links, and on-page relevance—and social platforms are the fastest way to seed those signals at scale.
Prerequisites
- Content asset ready: A long-form article, report, or data visualization to promote.
- Tracking plan: UTM naming convention and analytics access.
- Design assets: Infographic, chart PNGs, short vertical video clips.
- Analytics platform: GA4 or equivalent for conversion and traffic tracking.
- URL builder: `?utm_source=twitter&utm_medium=social&utm_campaign=Q4_report`
- Scheduling tool: native scheduler, Sprout-like tool, or an automated pipeline (Scaleblogger automation fits naturally here).
Optimization checklist for social posts
- Bold link tracking: Always include a clear, trackable link with `utm` parameters and a canonical URL.
- Bold descriptive copy: Use 1–2 keyword phrases in the first 1–2 lines to improve indexing and preview snippets.
- Bold hashtags/keywords: Use 3–5 targeted hashtags and platform keywords; avoid generic or spammy tags.
- Bold structured mentions: Tag authors, data partners, and publications to increase reference likelihood.
- Bold visual alt text: Add descriptive alt text to images; platforms increasingly index image descriptions.
- Bold repurposing cadence: Post the same asset with 3 variations over two weeks to capture different audience segments.
| Content format | Best use case | Primary SEO benefit | Ideal post template |
|---|---|---|---|
| Infographic | Visualize study findings for easy embedding | High backlink potential from publishers | Image + caption + one-link CTA |
| Short video (under 60s) | Tease a report highlight or demo | Boosts reach and social signals | Vertical clip + transcript + link |
| Long-form article teaser | Drive organic visits and deep engagement | Improves dwell time and inbound links | Hook + key stat + CTA link |
| Listicles / roundups | Curate multiple resources for shareability | Attracts links and internal citations | Numbered points + resource links |
| Data-driven charts | Share original datasets or interactive charts | Encourages citation and dataset linking | Screenshot + embed link + dataset URL |
Common troubleshooting
- If clicks track but no referrals appear, check `rel=”nofollow”` on links and ensure canonical tagging on the landing page.
- If visuals aren’t picked up, include an embed code and an explicit attribution line so publishers can copy it easily.
Amplification Strategies to Earn Links and Mentions
Start by treating amplification as part of the content architecture: well-crafted content rarely earns links on its own — distribution creates the oxygen. Focus on pairing targeted, audience-first outreach with low-friction distribution channels so content gains traction, social proof, and — eventually — editorial links.
Organic amplification techniques
Practical example: run a two-week pre-launch in a niche Slack + LinkedIn group, then offer the most active members a data visualization embed — that often results in natural mentions from community publications.
Paid and hybrid amplification
- Paid social to surface content: boost posts to lookalike audiences for traffic and social proof.
- Influencer hybrid deals: small guaranteed payment + performance bonus for links or placements.
- PR outreach with promoted placements: combine PR outreach with sponsored placements on industry newsletters.
| Channel | Budget % (example) | Primary Objective | Expected KPI |
|---|---|---|---|
| Organic social posting | 10% | Awareness + community traction | Shares, engagement rate |
| Paid social boosts | 25% | Jumpstart traffic to pillar pages | CTR 1-3%, time on page |
| Influencer payments | 30% | Earn links and editorial mentions | Mentions, referral traffic |
| PR outreach | 20% | Secure editorial placements | Press mentions, backlinks |
| Content promotion (sponsored placements) | 15% | Targeted reach on niche sites | Referral quality, links |
A sensible mix of organic activation plus targeted paid push shortens the path from publish to link, and solutions like `Scaleblogger.com` can automate distribution steps so teams focus on creative and outreach that actually earns links. When implemented consistently, this approach reduces wasted spend and raises the odds that content earns authoritative, long-term mentions.
Technical and On-Page Essentials to Support Social Traffic
Social referrals spike when pages load fast, present correctly on platforms, and make sharing frictionless. Start by treating every social landing page as both a conversion asset and an embeddable content card: unique, metadata-rich, and optimized for mobile. Populate social meta tags, serve compressed images sized for feeds, and make conversion actions obvious within the first viewport.
Metadata and Open Graph: practical rules
- Unique title tags: keep to 50–60 characters, include target keyword and a compelling hook.
- Meta descriptions: 120–155 characters that summarize value and invite clicks; avoid duplication across a site.
- og:title / og:description / og:image: populate these for every page so social platforms render predictable cards; use the same copy strategy as title/meta but adjusted for conversational tone.
- Schema.org: add page-level schema (Article, BreadcrumbList, Product) where relevant to increase visibility in rich results.
- Testing: verify tags with platform tools and previewers before launch.
Practical examples and templates
- Example tag set for an article:
- Performance checklist: enable `preconnect` for CDNs, reduce unused CSS, and use `rel=”preload”` for hero images.
| Tag | Purpose | Recommended content | Testing tool |
|---|---|---|---|
| title | Page headline for SERPs & shares | 50–60 chars, target keyword + hook | Browser SERP preview plugins |
| meta description | Summary for SERP snippets | 120–155 chars, action-oriented | Google Rich Results Test |
| og:title | Card title shown on social platforms | Conversational variant of title, ≤70 chars | Facebook Sharing Debugger |
| og:description | Social card summary | 110–200 chars, clickable language | Twitter Card Validator |
| og:image | Visual card asset for shares | 1200x630px, WebP/AVIF compressed | Open Graph checkers / social preview tools |
Measuring Impact and Iterating
Start by defining what success looks like for the next 90 days and instrument everything before launch. Set baselines from `internal analytics`, Google Search Console, and your backlink tool so early signals (CTR, sessions, impressions) can be separated from noise. Use the 90-day timeline below to convert vague goals into measurable checkpoints and design A/B tests that isolate one variable at a time.
A/B Tests and experiments
| Timeframe | Primary activities | Metrics to monitor | Success threshold |
|---|---|---|---|
| Week 0 – Setup | Baselines, tagging, QA | CTR, sessions, top keywords, backlink count | Baseline report saved; tags firing |
| Weeks 1-4 – Launch & early engagement | Publish, social push, micro-tests | CTR, bounce, time on page, impressions | CTR within ±10% baseline; >1% CTR uplift target |
| Weeks 5-8 – Amplification & backlinks | Outreach, PR, paid boosts | New referring domains, referral sessions, shares | ≥20 new links (DA30+ combined) or 10% referral growth |
| Weeks 9-12 – Analysis & iteration | Rank tracking, A/B rollouts | Keyword positions, organic sessions, conversions | 15–25% organic session lift; positive ROI |
| Post 12 weeks – Scale or pivot | Scale winners or pivot content types | Long-term retention, LTV impact | Maintain ≥20% traffic lift and profitable CAC |
When experiments are tightly documented and measurements are consistent, teams iterate faster and with greater confidence; integrating `AI content automation` can accelerate test rollout and scale winners across your site without adding manual overhead.
📥 Download: Social Media for SEO Enhancement Checklist (PDF)
Case Studies and Action Plan
Two short campaigns delivered measurable wins inside an 8–12 week window by prioritizing linkable assets, tight amplification, and rapid measurement. Both used the same editorial calendar discipline and automation to scale distribution — one focused on organic amplification through owned channels and outreach, the other combined paid ads and PR to speed discovery. The following compares tactics, timelines, and outcomes so teams can copy the mechanics rather than the minutiae.
| Case focus | Tactics used | Time to measurable results | Key outcomes |
|---|---|---|---|
| Organic amplification | Long-form pillar post, influencer outreach, newsletter push, syndication to Medium | 10 weeks | +48% organic traffic, 27 backlinks from niche blogs, 3 top-5 keyword movements |
| Hybrid paid + PR | Short-form viral asset, targeted LinkedIn Ads, journalist briefings, press release syndication | 8 weeks | +62% referral traffic, 15 high-authority backlinks, campaign featured in 2 industry roundups |
Case study takeaways: Rapid wins require linkable assets. A single data-driven visual* or unique checklist drove most backlinks.
- Distribution matters more than volume. Focused outreach to 20 high-fit sites outperformed blasting 200 low-fit contacts.
- Measure weekly, optimize biweekly. Small copy tweaks to headlines and CTAs increased click-throughs noticeably within the campaign window.
Practical notes:
- Tooling: Use automation for outreach sequencing and a content scoring framework to prioritize assets (Scaleblogger.com integrates well here).
- Expected outcome: First 8–12 weeks show directional gains; compounding results appear by month 3.
Conclusion
You’ve seen how social signals act as an amplifier for organic discovery: tailoring headlines for shares, mapping content to platform behaviors, and measuring referral and keyword movement after social bursts all shift content from buried to discoverable. Brands that recycle cornerstone articles into serialized social posts and short-form video consistently extend reach and pick up secondary search queries; teams that automate distribution and track SERP changes report clearer causal links between social activity and ranking trends. Before moving forward, prioritize three things: align titles and meta with shareable hooks, schedule cross-platform variants to sustain momentum, and instrument analytics to tie social traffic to keyword performance.
For teams ready to scale that workflow, start by running one experiment: pick a high-value article, create three platform-tailored assets, schedule staggered posts, and measure rankings and referral lift over four weeks. Expect early signals within days and more robust ranking movement in 6–8 weeks. To streamline this process, platforms like Try Scaleblogger to automate social distribution and measure SEO impact can automate posting cadence and surface the SEO impact of each distribution. If questions remain about attribution windows or how many variants to test, treat the first month as calibration: reduce variables, track consistently, then iterate.
