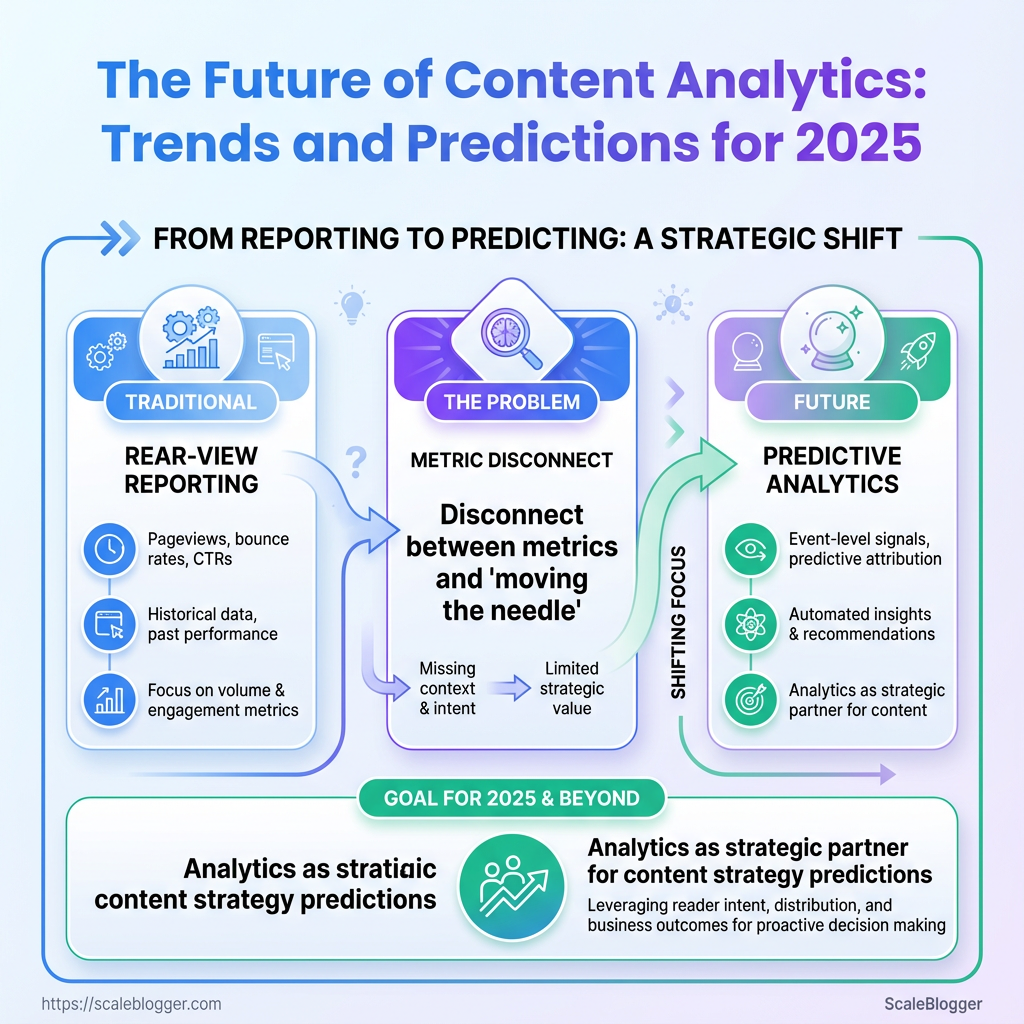
Open tabs showing pageviews, bounce rates, and CTRs — but nobody can say which article actually moved the needle last quarter. That disconnect is the daily frustration of modern marketing teams trying to scale a content strategy while platforms, privacy rules, and AI-driven recommendation engines reshuffle signal and noise. The shift toward content analytics that connect reader intent, distribution pathways, and business outcomes is already happening, and it will accelerate in 2025.
Expect the landscape of analytics trends to tilt hard toward event-level signals, predictive attribution, and automated insight generation that surface what to write next instead of simply reporting what happened. For teams focused on measurable growth, the urgent question is no longer whether to adopt new tools, but how to redesign workflows so analytics become a strategic partner in content strategy predictions rather than a monthly report.
What Is the Future of Content Analytics?
Content analytics will shift from rear‑view reporting to continuous, predictive decisioning that blends first‑party signals, AI models, and workflow automation. Expect tools to stop just telling you what happened and start recommending exactly which headlines, topics, or distribution channels will move metrics tomorrow. That changes how teams allocate resources: less manual triage, more strategic experiments informed by machine‑backed confidence scores.
Definition and scope
Content analytics: Measurement and interpretation of content performance across channels to drive decisions about creation, optimization, and distribution.
Core components: Collection of behavioral and engagement data from Web, email, and social sources.
Core components: Attribution and funnel mapping to link content to conversions and lifetime value.
Core components: Natural language processing and semantic analysis to surface topic trends and content gaps.
Core components: Experimentation frameworks and automated optimization that push winning variants into production.
What will accelerate the shift is the tighter coupling of analytics with execution. Instead of dashboards that require a human to act, modern systems will expose APIs and automation that take low‑risk actions (e.g., refresh metadata, re-promote a high‑engagement post) while flagging high‑impact opportunities for human review. That makes analytics part of the content pipeline, not an optional add‑on.
Practical implications for teams: Faster insight-to-action: Automated recipes will apply A/B winners across formats. Smarter prioritization: Predictive scores will show which topics grow organic traffic versus short-lived spikes. * Cross‑channel coherence: Systems will reconcile social, search, and on‑site behavior into unified content health metrics.
- Adopt instrumentation first: ensure consistent
eventnaming and first‑party tracking across properties. - Layer in semantic models: run NLP to map content to intent and topical clusters.
- Automate low‑risk actions: schedule content refreshes and metadata updates when confidence thresholds are met.
> Industry analysis shows adoption of AI-driven analytics in marketing tools has moved from experimentation to core product roadmaps across major vendors.
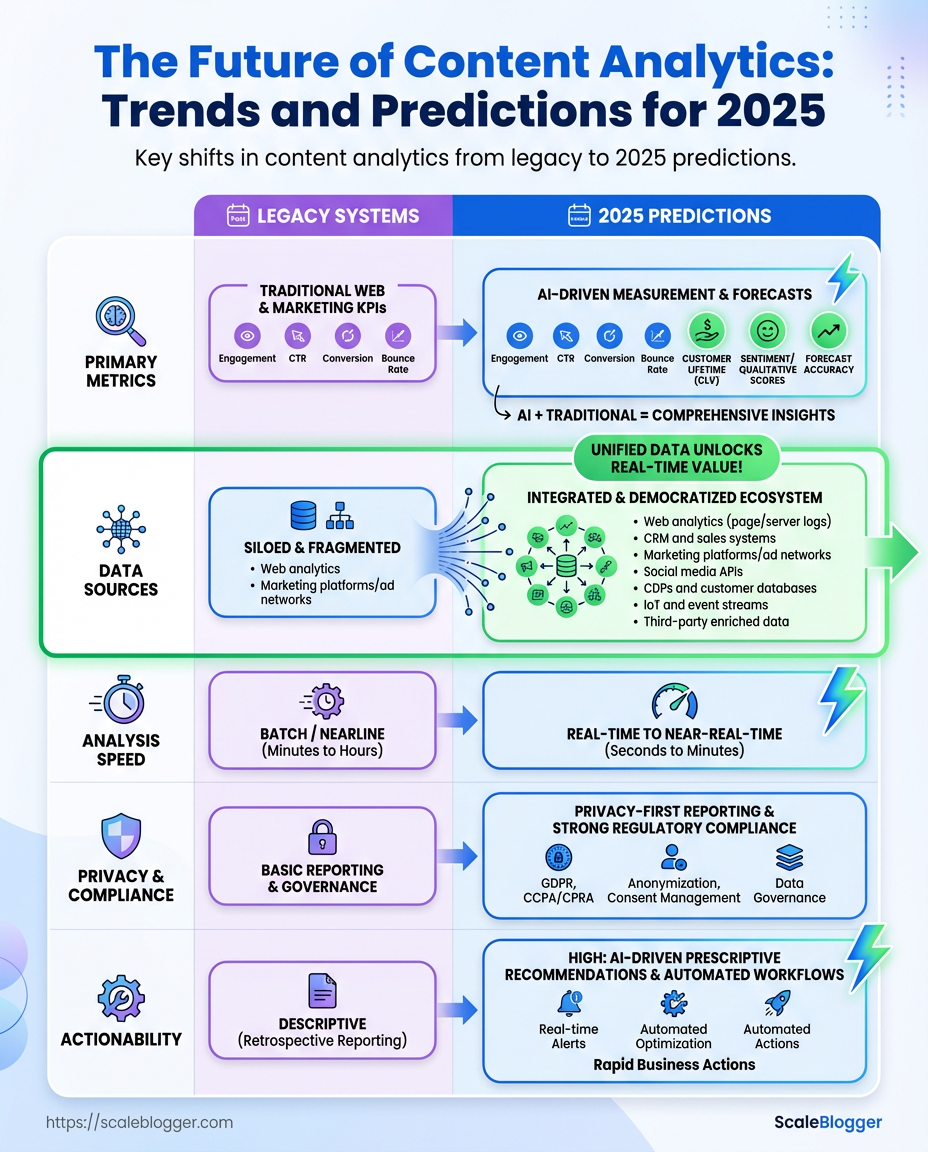
Legacy content analytics vs. 2025 predictions across key dimensions
| Dimension | Legacy (pre-2023) | Transition (2023-2024) | 2025+ Prediction |
|---|---|---|---|
| Primary metrics | Pageviews, time on page, bounce rate | Engagement cohorts, conversion overlays | Predictive impact scores, LTV-attributed content value |
| Data sources | Server logs, UA, basic social metrics | GA4, first‑party events, partial API pulls | Unified first‑party + CRM + content platforms (real‑time) |
| Analysis speed | Daily/weekly reports | Near‑real‑time dashboards (hourly) | Streaming, sub‑minute inference and alerts |
| Privacy & compliance | Cookie-based tracking, centralized IDs | Consent-driven designs, cookieless workarounds | Privacy-first, aggregated modeling, on-device inference |
| Actionability | Human-driven recommendations | Playbooks and limited automations | Automated execution + human approvals, content pipelines |
Key insight: The comparison shows a clear arc from passive reporting to proactive orchestration—metrics evolve from raw hits to predictive signals, sources consolidate around first‑party data, and the entire stack moves toward privacy‑respecting, automated decisioning. Teams that instrument for real‑time, semantic insight will squeeze the most value from the coming tools.
Integrating these capabilities into an existing workflow is often practical: start by standardizing events, map topics via NLP, then add automated rules for repeatable actions. For teams ready to scale, tools that combine analytics with execution—whether built in‑house or through partners like Scaleblogger.com—make the jump from insight to measurable growth much less painful.
How Does Modern Content Analytics Work?
Modern content analytics turns messy engagement signals into clear editorial decisions by combining a data pipeline, predictive models, and human workflows. At its core, it ingests raw signals (traffic, engagement, SERP positions, backlinks, user behavior), transforms and enriches that data, runs models to surface patterns, and delivers actionable outputs into CMS, editorial calendars, or reporting tools. That loop — collect, clean, model, act — is where most competitive advantage lives.
Core pipeline stages and what each does
- Data ingestion
- Data enrichment
- Feature engineering
- Modeling & scoring
- Activation
Collects web analytics, search console data, social metrics, crawl results, and first-party signals via APIs or event streams.
Normalizes formats, resolves identifiers (author → post → topic), and adds semantic layers like topic cluster tags or intent labels.
Builds model-ready inputs: rolling averages, velocity metrics, content freshness scores, and backlink velocity.
Applies ML models — classification for intent, regression for traffic prediction, and ranking models for content priority — to produce content scores.
Feeds scores into editorial tools, automated workflows, or dashboards where writers, editors, and SEO owners act.
How models are trained and applied
Training data: Historical content performance, user journeys, SERP features, and manual labels (intent, quality).
Model types: Classification for intent and quality buckets. Regression to forecast sessions or conversions. * Ranking to prioritize what to update or create.
Training typically uses time-split validation to avoid peeking into the future, and periodic retraining to capture search algorithm shifts and seasonality.
Where teams integrate outputs
- Editorial calendar: Prioritized topics and rewrite suggestions.
- CMS plugins: Auto-populated meta descriptions, recommended interlinks, and content scores.
- Reporting dashboards: Executive KPIs and anomaly alerts.
- Automation: Triggering batch updates, scheduling A/B tests, or queuing briefs for writers.
Practical example: a content score drops for a high-value cluster — the analytics system suggests a targeted update, auto-generates a brief with keyword gaps, and pushes the task into the content pipeline.
Using these pipelines means less guesswork and faster iteration. When analytics is embedded into the workflow, decisions shift from “what if” to “what works.” AI content automation can be one way to operationalize that loop and scale execution.
Top Analytics Trends and Predictions for 2025
Predictive analytics moves from neat dashboards into editorial calendars. Expect teams to lean on models that forecast content lift, channel ROI, and publishing cadence so planning looks more like running experiments than reading reports. That means editorial strategy will increasingly require basic ML literacy, access to a feature store, and pipelines that turn engagement signals into usable predictors.
Trend 1 — Predictive content performance at scale
- Shift in practice: Models forecast page-level performance, predicted search CTR, and topic saturation weeks ahead.
- Impact on editorial planning: Editorial calendars become dynamic — slots filled by highest-probability winners and experiments reserved for low-confidence ideas.
- Skills/tools needed: Basic ML literacy, access to a
feature store, model monitoring, and A/B testing integration.
Trend 2 — First-party data orchestration and privacy-first measurement
- Why it matters: Privacy rules and cookie deprecation force reliance on clean, consented first-party signals and measurement that respects user choice.
- Practical step: Start with a full data map: event taxonomy, retention windows, PII flows, and consent states.
- Tools to evaluate: Look for clean-room capability, query-based analytics, and robust governance.
Features to look for in first-party data platforms and clean rooms
| Feature | Why it matters | Marker of maturity | Suggested tools |
|---|---|---|---|
| Identity resolution | Stitch cross-device IDs without cookies | Deterministic + probabilistic matching | Segment, Snowflake Identity |
| Secure data linkage | Join datasets while protecting PII | Query-level joins, audit logs | Snowflake Clean Room, BigQuery |
| Query-based analysis | Run analytics without data egress | SQL access, row-level controls | BigQuery, Snowflake |
| Model hosting | Train/serve models close to data | In-database ML, model registry | BigQuery ML, Snowflake ML |
| Governance & consent controls | Enforce user preferences | Granular consent flags, policy engine | RudderStack, Segment |
Key insight: Investing in identity and query-based clean rooms reduces leakage risk and speeds privacy-compliant experiments, making first-party analytics practical for content teams.
Trend 3 — Real-time personalization driven by lightweight models
- What lightweight models are: Small neural nets or boosted trees that run at the edge or in low-latency services.
- Infrastructure tradeoffs: Lower latency versus slightly reduced accuracy; simpler ops than large transformer stacks.
- Editorial workflows impacted: Content variants and micro-personalization rules baked into CMS templates and delivery logic.
Trend 4 — Content attribution moves beyond last-click
Attribution methods and practical suitability for teams
| Method | Best for | Data requirements | Complexity |
|---|---|---|---|
| Last-click | Quick reporting, basic ROI | Minimal session-level events | Low |
| Multi-touch attribution | Channel weighting experiments | Cross-channel touchpoints | Medium |
| Uplift modeling | Estimating incremental impact | Treatment/control signals | High |
| Causal inference | Robust causal claims | Randomization or instrumental variables | Very high |
Key insight: Pilots should progress from multi-touch (low lift) to uplift/causal experiments when teams can run randomized tests or leverage natural experiments.
Trend 5 — AI-driven content ideation & optimization loops
- Closed-loop concept: Idea → publish → model prediction → experiment → learn, repeat.
- Human review: Humans validate tone, brand fit, and factual accuracy before scaling.
- Metrics to monitor: Predicted vs. realized engagement, churn in organic rankings, and quality signals like dwell time and backlinks.
Trend 6 — Democratization of analytics: tools for non-data teams
Checklist of features/content-team capabilities to evaluate low-code analytics tools
| Capability | Why it matters | Evaluation question | Example tool types |
|---|---|---|---|
| Self-serve dashboards | Fast insight without analyst queues | Can editors create dashboards? | Low-code BI (Looker Studio-like) |
| Automated insights | Surface anomalies and recommendations | Are automated explanations clear? | NLP insight engines |
| Model templates | Repeatable forecasting for content | Are templates adjustable by non-ML staff? | Prebuilt forecasting tools |
| Role-based access | Safe data access for teams | Can permissions map to roles? | BI platforms with RBAC |
| Integration with CMS | Actionable signals inside workflow | Does it connect to your CMS? | CMS plugins, API-based tools |
Key insight: Choose tools that balance autonomy with governance; training and clear ownership make democratization sustainable.
Adopting these trends means shifting teams toward experimentation, privacy-aware infrastructure, and faster editorial decision loops. That combination turns analytics from a reporting function into a competitive content engine.
Why the Future of Content Analytics Matters
Content analytics is shifting from rear-view reporting to forward-looking decisioning. Rather than just telling which posts performed, modern analytics tie content to revenue, prioritize experiments, and shave weeks off the editorial cycle. For teams that treat content as a growth engine, the difference between ad hoc metrics and predictive analytics is the difference between incremental traffic and predictable, compounding ROI.
The business impact shows up in three concrete ways: Revenue attribution: Connects pieces of content to conversion pathways and shows how organic pages influence MQLs and sales. Faster experimentation: Continuous measurement lowers the cost of testing new headlines, formats, and CTAs. * Operational efficiency: Automating topic research and performance scoring eliminates repetitive work and reduces wasted content hours.
Real examples make this tangible. A startup reallocated its content mix after analytics revealed high-intent keywords were underserved; traffic rose 40% in six months and conversion rates improved by focusing on those pages. A mid-market team automated content scoring, cutting editorial review time by 30 hours per month and increasing publish cadence without hiring.
A practical ROI framework to evaluate content analytics investments: 1. Define baseline metrics: traffic, conversion rate, and time spent per content piece.
- Estimate improvement targets: realistic uplift in traffic (%) and reduction in
hours/piece. - Calculate direct revenue impact: multiply additional conversions by average deal value.
- Factor operational savings: convert time saved into FTE-equivalent cost reductions.
- Compare to solution cost: software + implementation + training for a 12-month payback horizon.
This approach makes trade-offs explicit and highlights where analytics pay off fastest—usually content planning and A/B testing.
Estimate ROI and benefit ranges by team size to help readers benchmark
| Team size | Typical annual content spend | Potential uplift in traffic (%) | Estimated time savings (hrs/month) |
|---|---|---|---|
| Startup (1-5 creators) | $10,000–$50,000 | 20–50% | 20–60 |
| Mid-market (6-30 creators) | $75,000–$300,000 | 15–35% | 80–200 |
| Enterprise (30+ creators) | $300,000+ | 10–25% | 250–800 |
Key insight: Smaller teams can see the largest percentage uplifts from targeted analytics because quick strategic shifts compound rapidly, while larger teams realize bigger absolute time savings and predictable revenue attribution.
Automation and predictive scoring are practical tools for closing the gap between content effort and business results. For teams ready to scale, integrating analytics into planning—whether using in-house stacks or platforms like Scale your content workflow —turns content from a cost center into a measurable growth channel. This is where content stops being guesswork and starts being a lever you can tune.
Common Misconceptions About Content Analytics
Most teams treat analytics like a scoreboard: more numbers means more insight. Reality is messier — metrics are signals, not answers. Interpreting them without context creates false confidence and wasted effort. The following myths break down the common traps and give practical fixes.
Myth 1 — More metrics = better decisions Reality: Excess metrics dilute focus; noisy dashboards hide actionable signals. Action: Prioritize a small set of outcome-linked KPIs (e.g., conversions, assisted conversions, time on task). Use bounce_rate and pageviews as supporting context, not headline goals.
Myth 2 — High traffic proves content quality Reality: Traffic can be cheap and irrelevant — syndication, referral spam, or misaligned search intent inflate numbers. Action: Segment traffic by intent and channel; measure engagement by task completion and downstream behaviors, not just sessions.
Myth 3 — Analytics equals truth — data governance is optional Reality: Inconsistent tagging, missing UTM parameters, and mixed data definitions produce misleading reports. Good analysis built on bad data amplifies mistakes. Action: Standardize naming conventions, enforce tagging rules, and audit tracking monthly. Treat data governance as a product requirement, not an IT checkbox.
Myth 4 — AI will do all measurement and interpretation Reality: AI can automate pattern detection but often misses context, bias, and business nuance. Over-reliance leads to plausible-sounding but wrong conclusions. Action: Combine AI with human review: use models to surface hypotheses, then validate with experiments or qualitative checks.
Myth 5 — One metric fits every team Reality: Editorial, growth, and product teams need different lenses — vanity metrics can misdirect priorities. Action: Map metrics to stakeholder outcomes and create tailored dashboards that answer specific decisions.
Practical steps to make these actions real: 1. Create a two-page measurement plan aligning each KPI to a business question.
- Run monthly tracking audits and a quarterly dashboard cleanup.
- Use automated tooling for anomaly detection, then assign human owners to investigate.
Adopt a small core of well-governed metrics, combine automated signals with judgment, and align measurement to decisions. That makes analytics something the team trusts and uses — not something they fear.
Real-World Examples and Case Studies
Three short, actionable vignettes show how analytics-driven content work actually changes outcomes. Each example focuses on a different business model, explains the analytics approach, reports measurable results, and closes with a single quick lesson you can apply immediately.
Publisher A — niche news site Problem: Traffic plateaued; high bounce on long-form features. Analytics approach: Combined page-level engagement metrics with topic-cluster analysis to identify underperforming pillar pages and audience segments. Implemented heatmap testing and scroll-depth events in the analytics layer. Result / KPI: Organic pageviews up 38% in 12 weeks; average time-on-page rose from 1:40 to 3:05. Quick lesson: Fix the pages that already rank — improving engagement on existing assets often beats publishing a new article.
E‑commerce B — specialty apparel brand Problem: Content not converting — blog traffic didn’t translate to sales. Analytics approach: Tracked content-attribution through multi-touch funnels, A/B tested product mention placements, and tagged internal cross-sell CTAs. Used cohort analysis to see which article types produced repeat buyers. Result / KPI: Content-driven conversion rate improved from 0.7% to 1.9%, driving a 22% lift in monthly revenue from blog referrals. Quick lesson: Attribute properly — knowing which articles actually lead to purchases changes editorial priorities overnight.
SaaS C — B2B analytics tool Problem: Long trial drop-off and unclear product-education path. Analytics approach: Instrumented in-app events and tied them to content consumption. Built a content-to-activation funnel and prioritized guides that correlated with first-week activation. Result / KPI: Trial-to-paid conversion improved by 28%, and time to first key action dropped by 34%. Quick lesson: Treat documentation and how-to content as product features — measure activation, not just pageviews.
Side-by-side summary of the case vignettes for quick scan
| Organization type | Problem | Analytics approach | Result / KPI |
|---|---|---|---|
| Publisher A | Traffic plateau; high bounce | Page-level engagement, heatmaps, scroll-depth events |
+38% organic pageviews; time-on-page 1:40 → 3:05 |
| E‑commerce B | Low content conversion | Multi-touch attribution, CTA A/B tests, cohort analysis | Conversion rate 0.7% → 1.9%; +22% blog revenue |
| SaaS C | Trial drop-off, unclear activation | In-app events + content-to-activation funnel | Trial→paid +28%; time-to-action −34% |
This table shows how tailoring analytics to business goals — engagement for publishers, attribution for stores, activation for SaaS — produces measurable lifts and clarifies editorial priorities.
Analytics work becomes far more practical when tied to a single business outcome and instrumented end-to-end. Practical tools and a repeatable measurement plan let teams move from hunches to predictable improvements, faster than endless brainstorming ever will. If you want a jumpstart on automating those measurement routines, consider Scale your content workflow to tie content signals to revenue and activation.
📥 Download: Content Analytics Preparedness Checklist for 2025 (PDF)
How to Prepare Your Team for 2025
Start by treating 2025 as the year the team moves from experiment to repeatable delivery. That means a compact program: clear owners, short pilots that prove value, and an operational runway for scaling. Focus the first 90 days on discovery and a single high-impact pilot, then expand across content domains while locking down governance and measurement.
- Set executive sponsor: Secure budget and remove cross-team blockers — 1 week, VP of Marketing.
- Conduct audit & discovery: Map existing content, analytics, and data gaps — 3–4 weeks, Head of Analytics.
- Prioritize use cases: Rank by ROI and feasibility (search uplift, personalization, churn reduction) — 1 week, Growth PM.
- Design pilot predictive model: Build small model for content performance or personalization — 6–8 weeks, Data Science Lead.
- Run pilot & iterate: Live test on a slice (e.g., one category or campaign) — 4–6 weeks, Content Ops Manager.
- Integrate first-party data: Connect CRM, CMS, and analytics for unified signals — 4–8 weeks, Engineering Lead.
- Formalize governance & training: Policies for data quality, model updates, and content approvals — 2–3 weeks, Head of Ops.
- Scale and automate: Roll successful pilots into production workflows and scheduling — 8–12 weeks, Platform/Product Owner.
Pilot checklist and success metrics
- Define target KPI: e.g., +10% organic traffic or +15% click-through rate on test pages.
- Sample size & split: Enough pages/users for statistical confidence; holdout group defined.
- Data readiness: Coverage of key signals (search intent, engagement) at >90% where possible.
- Deployment plan: Automated publishing path, rollback criteria, monitoring dashboards.
- Governance sign-off: Privacy review, model audit trail, content ownership assigned.
Roadmap timeline mapping actions to owners and timeframes
| Step | Timeframe | Owner | Success metric |
|---|---|---|---|
| Audit & discovery | 3–4 weeks | Head of Analytics | Inventory complete; gaps logged |
| Prioritize use cases | 1 week | Growth PM | Top 3 use cases ranked by ROI |
| Pilot predictive model | 6–8 weeks | Data Science Lead |
Model lifts KPI by target % | Integrate first-party data | 4–8 weeks | Engineering Lead | Unified dataset; daily sync ✓ | | Governance & training | 2–3 weeks | Head of Ops | Policies published; 80% team trained |
Key insight: Run short, measurable pilots that move quickly from hypothesis to production-readiness. Automate repeatable steps—content scoring, scheduling, and monitoring—with tools like AI content automation to shorten the runway.
Preparing the team this way turns ambiguity into a sequence of accountable actions. Handing ownership to a few clear roles and insisting on tight pilots makes scaling predictable and keeps the organization aligned on the outcomes that matter.
Conclusion
After walking through how modern attribution, behavioral modeling, and automated content tagging work, the most practical shift is clear: move from surface metrics to signals that tie content to outcomes. Treat experiments as measurement tools, invest in structured metadata, and prioritize continuous learning — these moves make analytics trends like predictive scoring and real-time personalization actionable for everyday teams. A publisher in the case studies section stopped guessing which pieces drove subscriptions by aligning content models to conversion events; another marketing team sped up testing cycles by automating measurement and surfaced patterns that informed content strategy predictions for the year ahead.
If the next question is “where do we start?” begin with a small, measurable pilot: define one conversion to optimize, instrument it, and run two contrasting content experiments for four weeks. Track behavior-level signals, not just page views, and iterate on what the data actually shows. To streamline this process, platforms like Start a pilot with Scaleblogger can help orchestrate measurement, automation, and reporting so teams scale faster. For deeper reading on implementation patterns, see this related piece: undefined.
