Marketing teams often lose momentum because content hits are scheduled by guesswork rather than evidence. When publishing decisions ignore performance signals, campaigns miss audience windows and waste resources. Industry research shows that tying `analytics` to editorial planning reduces wasted effort and uncovers predictable content wins.
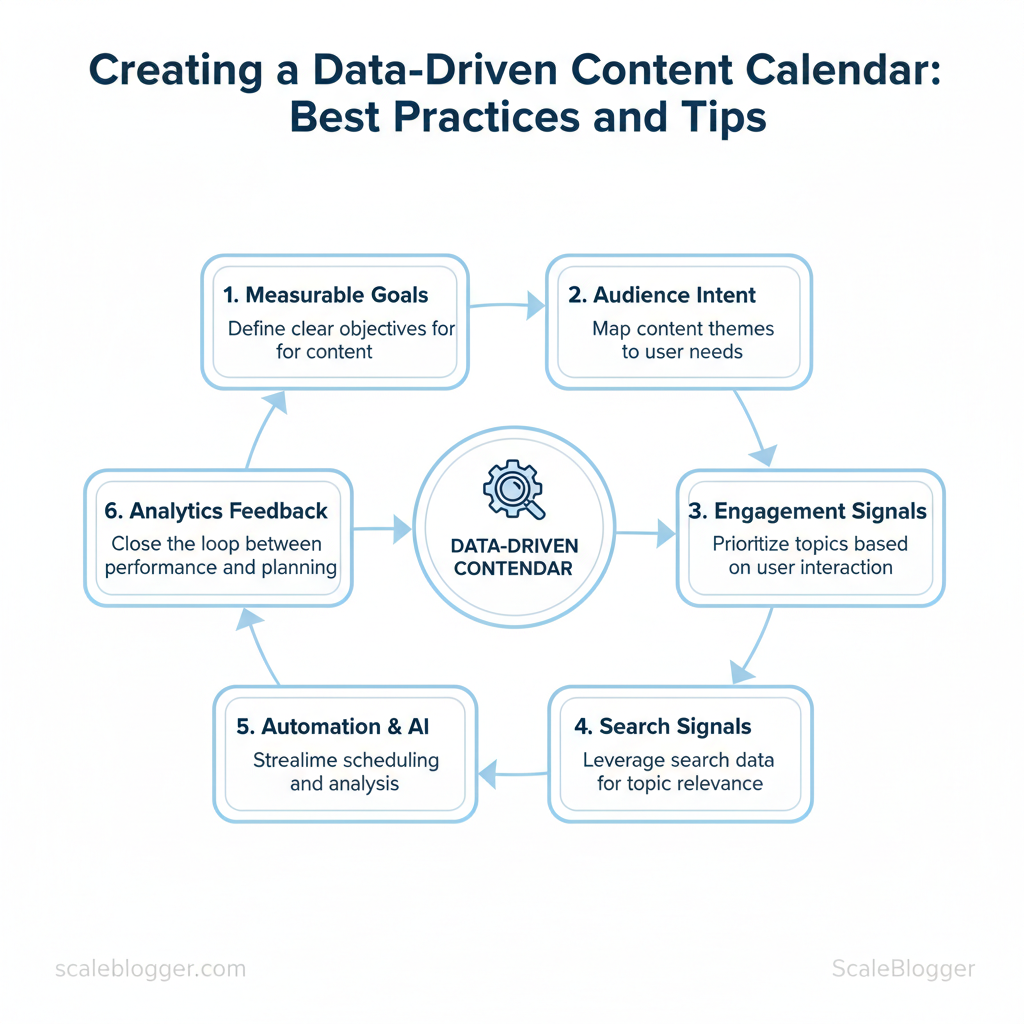
A data-driven content calendar turns sporadic posting into a repeatable engine. Start with measurable goals, map content themes to audience intent, and use `engagement` and `search` signals to prioritize topics. Integrating automation and AI keeps scheduling tactical rather than manual, while analytics for content planning closes the loop between distribution and performance.
Picture a product marketing team that shifted to weekly data checks, slashed time spent on scheduling, and increased high-value conversions by focusing on intent-driven topics. Tools that combine reporting, workflow, and automation make that shift practical at scale — and Scaleblogger sits at the center of that stack for teams ready to automate planning and publishing.
- How to link editorial themes to measurable KPIs
- Practical steps for using `engagement` and search data to prioritize topics
- Content scheduling strategies that reduce manual effort and increase ROI
- Tips for automating recurring tasks without losing editorial control
Foundations of a Data-Driven Content Calendar
A data-driven content calendar uses measurable inputs to prioritize what to publish and when, instead of guessing based on gut or rigid cadence. Start by mapping the signals that predict value — audience intent, past performance, and seasonality — then convert those signals into a repeatable prioritization process so the team consistently spends time on the highest-return work.
Prerequisites
- Access to historical performance: pageviews, engagement, conversions, and acquisition source.
- Keyword and intent data: search volume, query intent tags, and competitor gap analysis.
- Calendar system: spreadsheet, project management board, or scheduling tool with custom fields.
- Stakeholder agreement: cadence, review windows, and success KPIs.
- Analytics platform: GA4 or equivalent for traffic/conversion signals.
- Keyword research: any keyword tool with intent tagging.
- Scheduling: editorial calendar in a CMS or PM tool.
- Optional: AI-assisted topic scoring like `AI content automation` to speed topic triage.
Starter template (example) “`yaml title: “Targeted long-form tutorial” keyword: “how to X” intent: “transactional” priority_score: 48 publish_window: “Q3 – Aug” owner: “content_lead” success_kpi: “organic conversions +15% in 90 days” “`
- Historical performance: prefer formats that previously drove conversions (e.g., long-form guides).
- Seasonality: schedule evergreen updates before peak demand months.
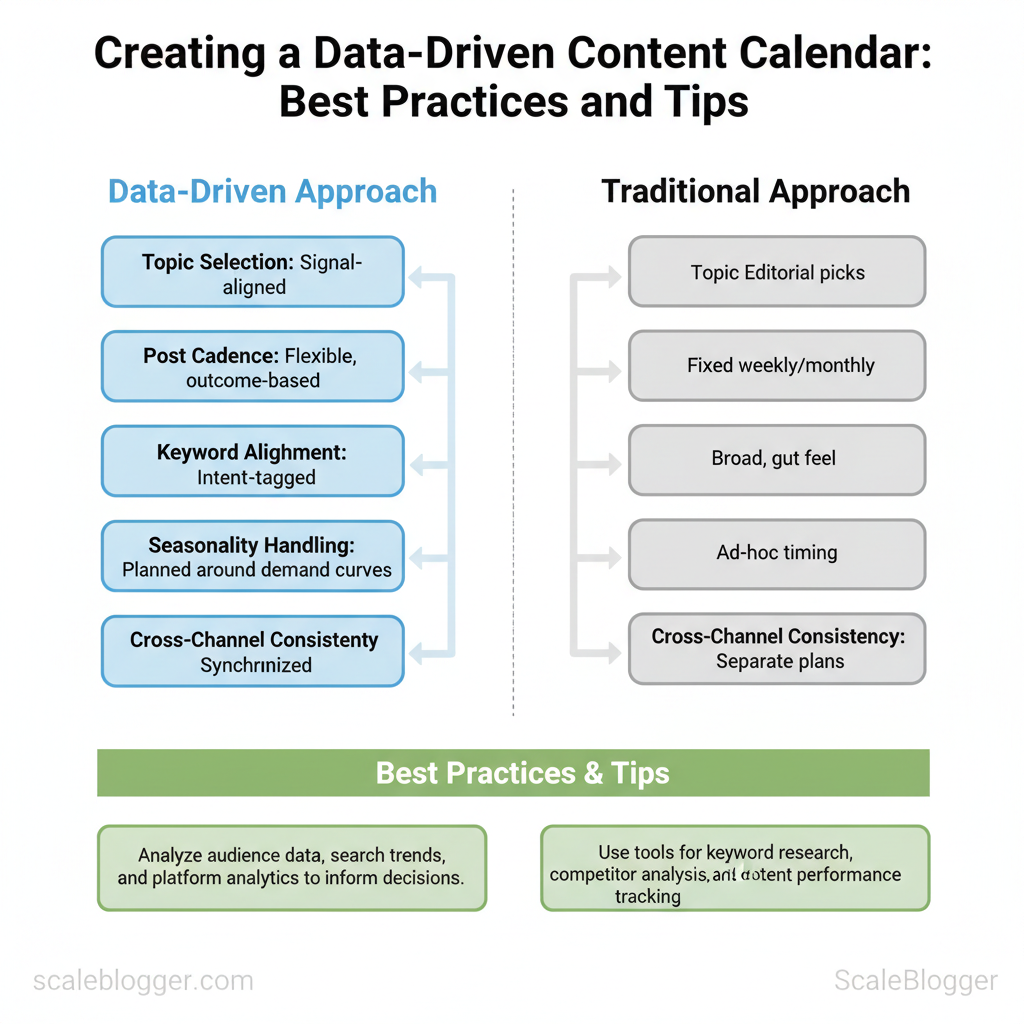
| Element | Traditional Approach | Data-Driven Approach | Impact / Notes |
|---|---|---|---|
| Topic selection | Editorial picks or trending topics | Signal-aligned (intent + performance) | Higher relevance, lower wasted effort |
| Post cadence | Fixed weekly/monthly | Flexible, outcome-based | Improves ROI per publish |
| Keyword alignment | Broad keywords, gut feel | Intent-tagged keywords | Better CTR and conversion fit |
| Seasonality handling | Ad-hoc timing | Planned around demand curves | Captures peak traffic windows |
| Cross-channel consistency | Separate plans per channel | Synchronized messaging & repurposing | Amplifies reach, reduces duplication |
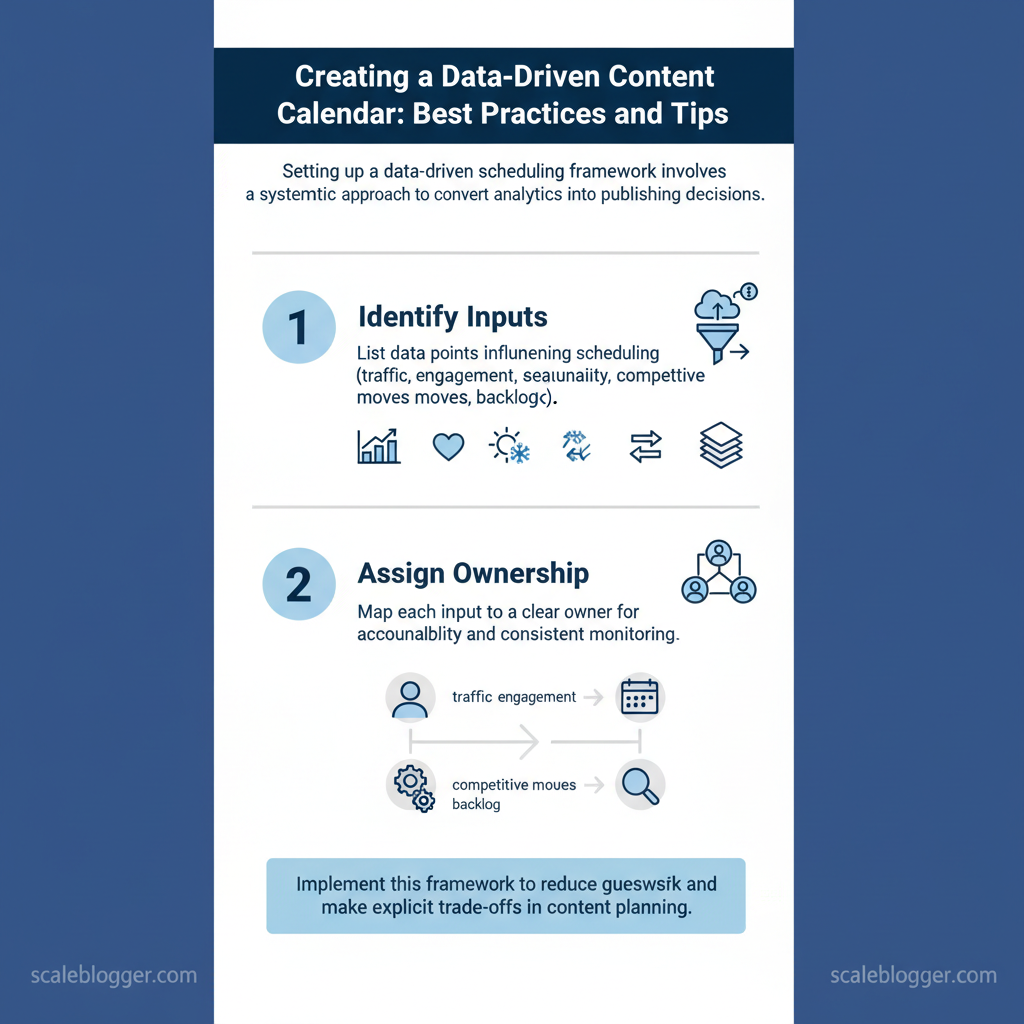
Setting Up a Data-Driven Scheduling Framework
Start by treating the content calendar as a decision system: feed it consistent signals, assign clear owners, and schedule regular cadence windows for updates. A reliable framework converts raw analytics into publishing decisions, reduces guesswork, and makes trade-offs explicit across SEO, social, and product teams.
Prerequisites and tools
- Prerequisite: Baseline analytics access (GA4), CMS reporting (WordPress/Contentful), social platform insights (Meta Insights, X Analytics), and a shared calendar (Google Calendar/Notion).
Step-by-step setup
Ownership, accountability and RACI
- Responsible: Content Analyst (data pulls, weekly signals)
- Accountable: Head of Content (final schedule sign-off)
- Consulted: SEO Lead, Social Manager, Product Marketing
- Informed: Writers, Editors, Executive sponsor
- `organic traffic` — weekly change (%)
- `CTR` — search impressions vs clicks
- `engagement rate` — average time on page or social interactions
- `conversion rate` — micro-conversions per content piece
- `velocity` — backlog items published per sprint
| Input Type | Source | Owner | Update Frequency | Notes |
|---|---|---|---|---|
| Traffic signals | GA4 reports (page-level) | Content Analyst | Weekly | Use `page path` + weekly % delta |
| Engagement metrics | Meta Insights, X Analytics, GA4 | Social Manager | Weekly | Prioritize posts with >1.5x baseline engagement |
| Seasonality cues | Historical CMS exports (12 months) | Product Marketing | Quarterly | Mark seasonal peaks & campaign windows |
| Competitor insights | Public content feeds, SEMrush alerts | SEO Lead | Monthly | Track new format wins and topic gaps |
| Content backlog status | CMS (WordPress/Contentful) | Content Ops | Daily | Flag ready-to-publish, blocked, needs review |
When implemented, this framework shortens decision cycles and lets teams respond to signal changes without disrupting creators or quality. For teams wanting to scale, consider adding an automated content scoring layer—Scaleblogger.com’s AI-powered content pipeline is a practical option to automate scoring and scheduling decisions.
Analytics for content planning: collecting, interpreting, acting
Start by collecting clean, channel-specific metrics and use simple decision rules that map directly to the editorial calendar. Good analytics answers come from narrow questions: which topics retain readers, which titles drive clicks, and which posts reliably convert visitors into returners. Build pipelines that capture those signals, then convert them into calendar actions that increase topical coverage where performance is already proven.
- Impact check: measure change in sessions and return visits before/after a publish or update.
- Click health: monitor CTRs for pages ranking in positions 3–10; low CTR with decent rank signals poor title/description fit.
- Engagement decay: if average time on page drops month-over-month, run a content quality audit.
| Metric | Benchmark | Thresholds | Calendar Action |
|---|---|---|---|
| Engagement rate | 2–5% typical for long-form | <1% low / 1–3% average / >3% high | Low → rework CTA + restructure; Avg → A/B title; High → spin-off topic |
| Average time on page | 90–180 seconds | <60s low / 60–150s average / >150s high | Low → simplify intro + add visuals; Avg → add deeper sections; High → create series |
| CTR (search) | 2–6% overall (varies by rank) | <1.5% low / 1.5–4% avg / >4% high | Low → rewrite title/meta; Avg → test schema; High → scale promotion |
| Return visits | 20–35% repeat visitors | <15% low / 15–30% avg / >30% high | Low → add newsletter opt-in/related links; Avg → nurture with leads; High → prioritize gated offers |
| Keyword rank | Top 10 goal for target terms | >20 poor / 11–20 weak / 1–10 strong | Poor → optimize on-page + backlinks; Weak → internal linking; Strong → expand cluster |
Example decision-rule: if a post has CTR <1.5% AND rank ≤10, schedule a title rewrite within one week and run a paid social CTA test the following month. Use automation to convert that rule into a calendar task.
Understanding these patterns turns analytics from a reporting exercise into a practical content engine. When executed well, analytics-driven rules reduce guesswork and keep the team focused on edits and topics that move metrics. Consider automating repetitive checks with AI tools or platforms like Scaleblogger.com to scale the pipeline and free editorial bandwidth.
Audience alignment and global relevance
Audience alignment begins with mapping topic ideas directly to intent signals so every piece of content answers a real user need—across markets. Start by identifying whether a topic satisfies informational, commercial, transactional, or navigational intent, then layer region-specific behavior (language, search patterns, seasonal demand). Use the mapping below as a working template that feeds the editorial calendar and an analytics-driven iteration loop.
| Topic | Intent Signal | Region Considerations | Calendar Status |
|---|---|---|---|
| How to use data APIs | Informational → Developer intent (tutorials, code snippets) | US/EU: English docs, `OAuth` examples; APAC: localized SDKs, `rate limit` notes | Planned Q2 — Evergreen series |
| Best practices for localization | Commercial → Mid-funnel (product comparisons, vendor research) | EMEA: GDPR guidance; LATAM: Spanish/Portuguese examples; Asia: L10N tools | Drafted — Publish Q3 |
| Seasonal topic windows | Transactional & Informational (purchase timing, gift guides) | Northern vs Southern Hemisphere season shifts; Ramadan/Diwali windows | Live calendar — quarterly review |
| Evergreen vs trending balance | Informational → Strategy content (how-to, benchmarks) | Global baseline with regional adaptations for trending spikes | Ongoing — monthly updates |
Practical examples: convert a US-facing API tutorial into APAC-friendly versions by adding Java/Kotlin snippets and local timezone examples; convert an evergreen strategy post into a transactional asset by adding regional vendor comparisons.
Industry teams use a fast feedback loop—analytics to calendar—to keep relevance high without reworking every asset. Scaleblogger.com integrates these steps into an AI-powered content pipeline that automates tagging and calendar updates, helping scale localized variants while preserving intent alignment. Understanding these practices lets teams produce globally relevant content that actually maps to what users search for and when they need it.
Operationalizing the calendar with automation
Automating the editorial calendar turns planning into a repeatable machine: ingest signals, apply deterministic rules, queue publishable assets, and continuously monitor outcomes. Start by mapping the lifecycle from idea to live post, then encode the decision points so teams move at machine speed without losing editorial judgment. The approach below lays out phases, rule-based scheduling logic, a publishing pipeline blueprint, and monitoring/alerts that keep humans focused on exceptions rather than routine.
Phased automation and governance
- Phase segmentation: Break the calendar into discrete automation phases (ingest → schedule → publish → monitor → scale).
- Role definitions: Assign clear owners for each gate to avoid handoffs becoming delays.
- Rule templates: Capture scheduling rules as codified templates (e.g., `priority = traffic_score > 70 AND freshness = true`).
- Governance guardrails: Define editable thresholds, escalation paths, and a review cadence for rule changes.
- Auditability: Log decisions for every automated action to support retroactive analysis.
Publishing pipeline overview
- Ingest: Content briefs, AI drafts, and SERP data flow into a central queue.
- Validate: Automated QA checks for duplicates, broken links, and schema markup.
- Approve: Human editor approves or requests revision; approval moves item to the scheduler.
- Publish: Scheduled posts are pushed via API to CMS with `canonical`, `meta`, and structured data set.
- Post-publish: Auto-deploy social snippets and refresh evergreen dates when performance thresholds met.
- Real-time alerts: Failures during publishing, spikes/drops in traffic, or crawl errors trigger Slack/Email alerts.
- Performance dashboards: Daily KPIs (impressions, clicks, time on page) feed a control chart for trend detection.
- Automated remediation: If a post drops >40% week-over-week, trigger a `reoptimize` workflow.
Industry analysis shows automated remediation reduces manual triage time and improves iteration velocity.
| Phase | Key Activities | Owners | Timeline (weeks) | Success Criteria |
|---|---|---|---|---|
| Phase 1: Data ingestion | Collect briefs, API pulls (SERP, GA4), content tagging | Data Engineer | 2 | All signals available ✓ |
| Phase 2: Scheduling rules | Build ruleset, weight signals, simulate runs | Product + Editor | 3 | Simulation match >80% ✓ |
| Phase 3: Publishing queue | CMS API integration, QA checks, approval gates | DevOps + Editor | 2 | 95% successful deploys ✓ |
| Phase 4: Monitoring & optimization | Dashboards, alerts, remediation workflows | Analytics | 3 | Alert latency <15min ✓ |
| Phase 5: Review & scale | Rule tuning, SLA update, horizontal rollout | Growth Lead | 4 | 20% throughput increase ✓ |
When implemented correctly, automation shifts time from coordination to creation, allowing teams to iterate faster and focus on high-value editorial work. Consider augmenting the pipeline with AI-powered scoring and use tools like Scaleblogger.com to scale your content workflow where appropriate.
📥 Download: Data-Driven Content Calendar Checklist (PDF)
Measurement, iteration, and continuous improvement
Continuous improvement starts with a tight feedback loop: measure what matters, run small experiments, review outcomes regularly, and codify learnings so the next cycle is faster and safer. Establish a quarterly review cadence, conduct focused post-mortems after major experiments, and keep a living playbook of results and decisions. That discipline turns sporadic fixes into predictable growth in traffic, engagement, and conversions.
What to do and when
Post-mortem template (copy into your repo) “`markdown Title: Objective: Hypothesis: Metric(s) tracked (`CTR`, `time_on_page`, `organic_sessions`): Start / End dates: Result vs. expected (numbers + visualization): Root cause analysis: Decisions (stop/scale/iterate): Owner + follow-up due date: Knowledge base link: “`
Experiment design basics
- Define a clear hypothesis: One sentence connecting change → expected metric movement.
- Limit variables: Change one factor at a time to keep learnings causal.
- Power and duration: Run until you reach meaningful sample sizes or pre-defined timebox.
- Control and tracking: Use `UTM` parameters and experiment flags to isolate traffic.
- Living playbook: Centralize post-mortems, templates, and experiment logs.
- Weekly highlights: Share 2–3 concise wins or failures to spread learning.
- Reusable assets: Save templates, snippets, and `structured_data` examples for re-use.
Quarterly reviews make it possible to iterate strategically without chaos — they create cadence, not bureaucracy.
| Criterion | Measurement | Decision Trigger | Calendar Action |
|---|---|---|---|
| Content diversity | Topic mix ratio, % new vs. refreshed | <30% new topics | Schedule ideation sprint in quarter |
| Topic saturation | Search intent overlap, declining CTR | CTR drop ≥10% month-over-month | Add gap analysis + topic pruning |
| Format performance | Video vs. long-form engagement | Video watch-time > read-time | Pilot more short-form episodes |
| Cross-channel alignment | Referral mix, social lift | Organic down, paid up | Sync editorial + paid calendar |
| Localization effectiveness | Localized CTR, conversions | Region CR < global CR by 20% | Prioritize translations + hreflang audit |
Conclusion
Across the steps above, the most important shifts are practical: tie publishing decisions to performance signals, build a repeatable cadence that privileges audience windows over intuition, and automate low-value tasks so teams focus on creative amplification. Teams that re-prioritized existing assets based on engagement metrics reclaimed months of editorial effort and saw click-through and retention lift; similarly, a product marketing team that introduced a weekly signal review reduced wasted launches by half. Common questions — how often to reweight the calendar, what signals matter most, who owns the loop — resolve around governance: set a short review cadence, prioritize conversion and engagement metrics, and assign a single owner to close the feedback loop.
– Reweight calendars weekly based on top three signals. – Automate routine tasks (scheduling, tagging, reporting) to free creative capacity. – Assign one owner to act on signal recommendations and lock the publishing decision.
For the next step, audit one channel this week: run a 30-day signal review, re-prioritize three pieces, and measure lift. To streamline this process, platforms like Launch your data-driven calendar with Scaleblogger can automate signal collection and calendar actions, letting teams move from guesswork to measurable momentum.
