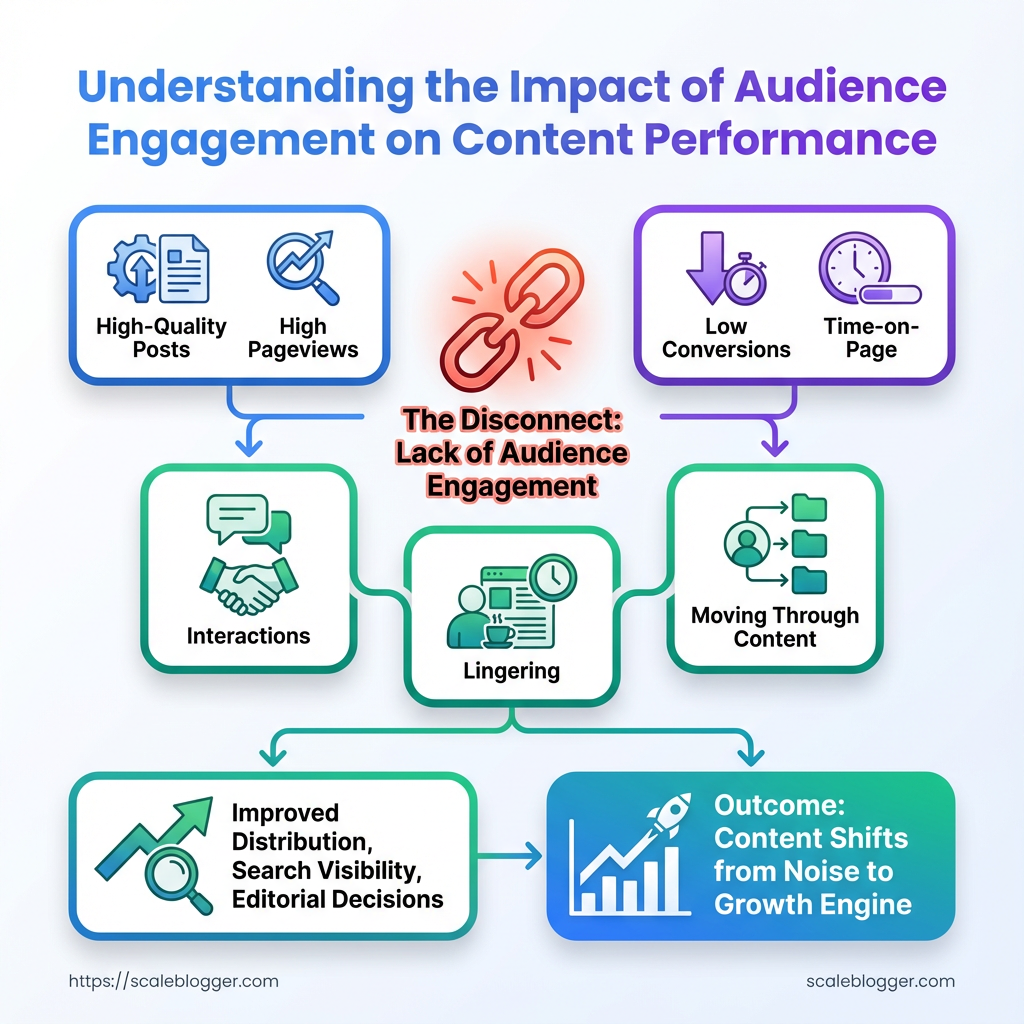
Most teams notice an odd pattern: publish high-quality posts, watch pageviews climb, then see conversions and time-on-page sputter. That disconnect usually traces back to audience engagement — how visitors interact, linger, and move through content — not just raw traffic numbers.
Engagement signals shape distribution, search visibility, and editorial decisions, so interpreting them correctly is the heart of solid content performance analysis. Reading engagement superficially — clicks, then bounce — leads to reactive changes that feel busy but don’t move the needle.
Treating engagement metrics as diagnostic tools rather than vanity counters changes priorities and budgets immediately. When the right metrics are measured and contextualized, content shifts from noise to growth engine, revealing which topics deserve scaling and which need a different hook or format.
What Is Audience Engagement?
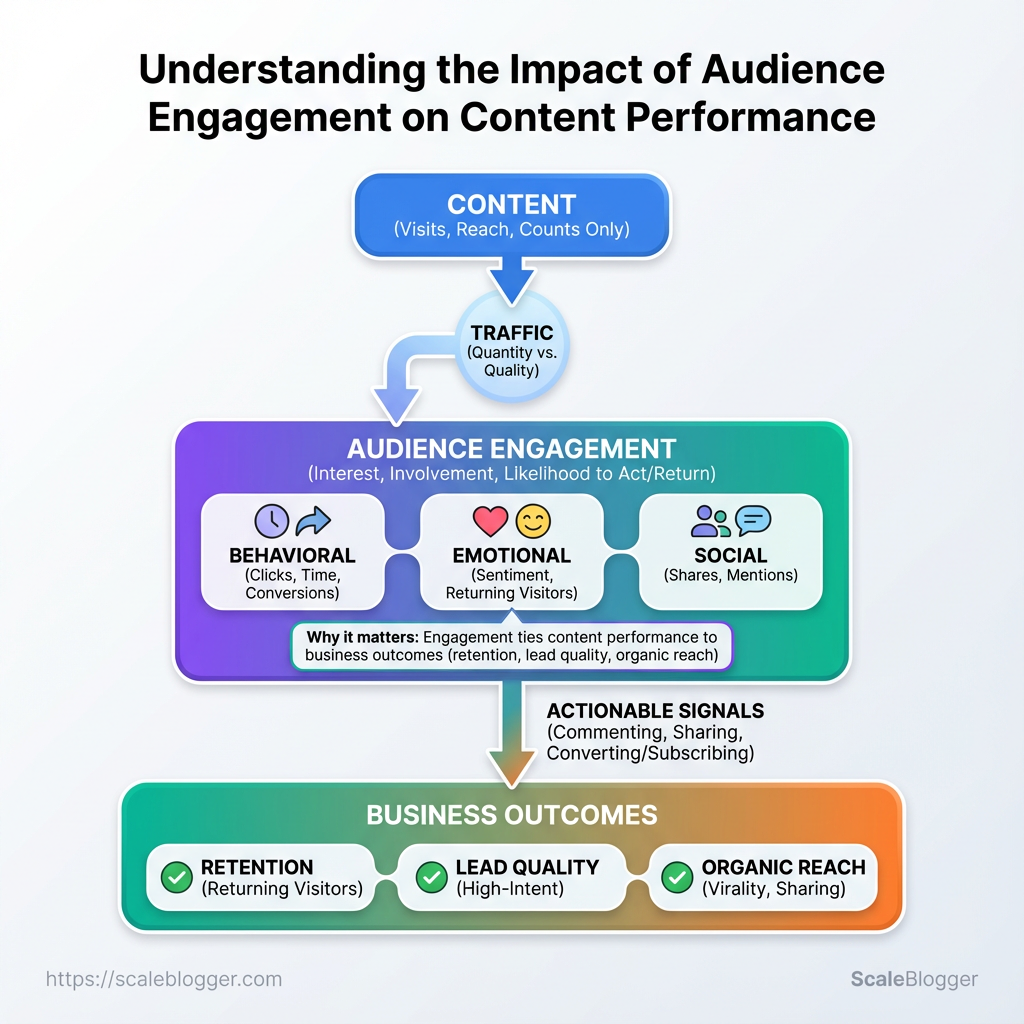
Audience engagement describes how people interact with content beyond simply arriving on a page — it measures interest, involvement, and the likelihood someone will act or return. Contrast that with traffic, which only counts visits and reach; engagement tells whether those visits actually mattered.
Engagement vs. Traffic: Engagement measures interaction depth and quality, while traffic measures quantity and reach.
Behavioral engagement: Observable actions such as clicks, time spent, conversions, and scrolling patterns.
Emotional engagement: The degree of interest or resonance — reflected in sentiment, returning visitors, and time spent on story-led pages.
Social engagement: Interactions that amplify content, including shares, mentions, and community replies.
Three concrete user actions that signal strong engagement: Commenting or replying: Leaves feedback, questions, or starts a discussion. Sharing content externally: Distributes the piece on social platforms or email. * Converting or subscribing: Signs up, purchases, or bookmarks for later.
Why this distinction matters: traffic can rise from headlines or paid promos without delivering business value. Engagement ties content performance to outcomes — retention, lead quality, and organic reach expansion. Measuring both gives a fuller picture: traffic answers “how many,” engagement answers “how well.”
Side-by-side comparison of engagement signals vs. traffic metrics to clarify differences
| Metric | What it measures | Indicates (engagement or reach) | Actionable? |
|---|---|---|---|
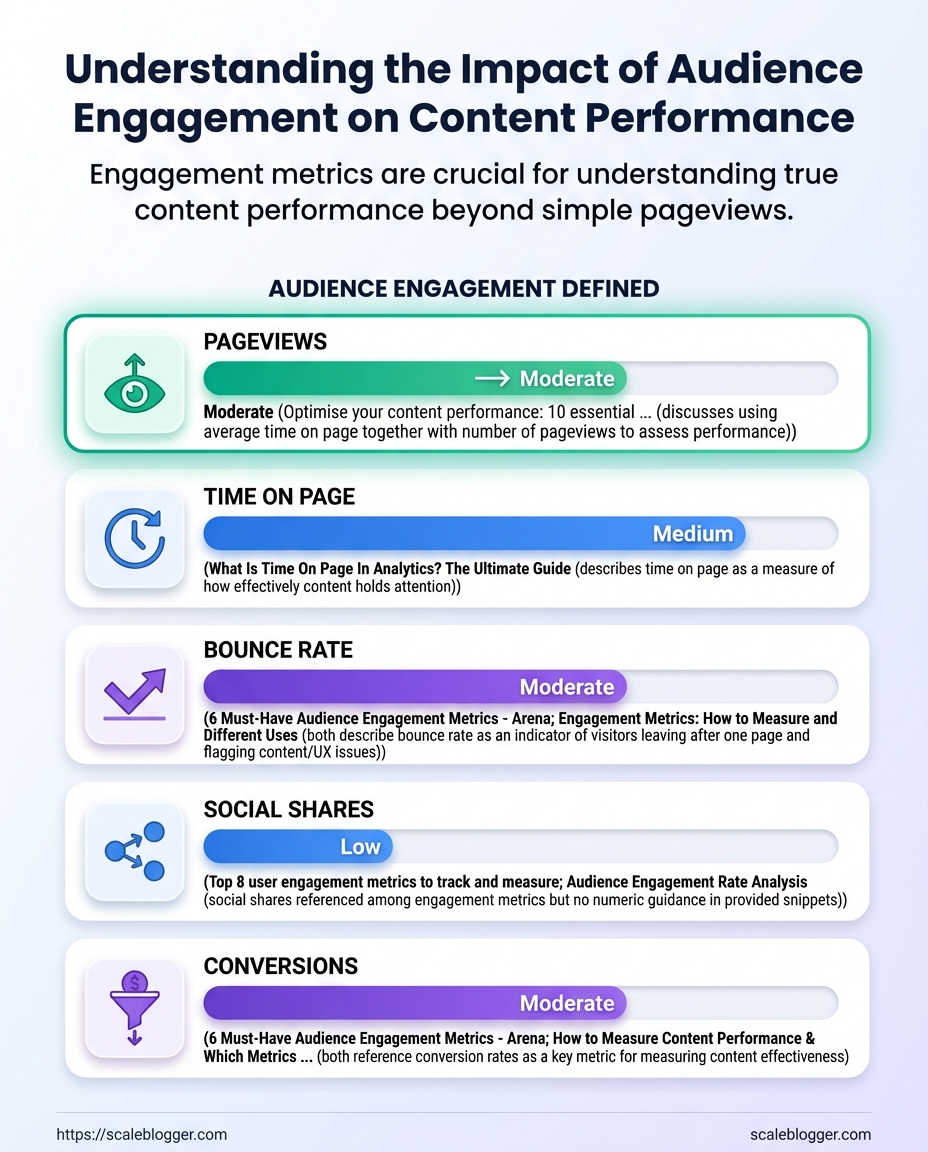
| Pageviews | Number of times a page loads | Reach | Yes — test headlines, distribution |
| Time on page / Session duration | How long users stay | Engagement | Yes — improve content depth, readability |
| Bounce rate | % single-page sessions | Both (contextual) | Yes — refine relevance, page experience |
| Comments / Replies | User-generated responses | Engagement | Yes — foster community, reply promptly |
| Social shares | Times content is shared externally | Social engagement / Reach | Yes — optimize shareables, CTAs |
Market tools and analytics (Google Analytics, GA4, social platform APIs) make these metrics available and actionable. Use session duration and shares to judge resonance; use pageviews and referral sources to tune promotion. For content programs, combine signals — a page with moderate traffic but high time on page and many shares often outperforms a high-traffic, low-engagement page.
Tracking the right mix of signals turns guesses into decisions. For publishers and brands alike, designing content to encourage at least one meaningful action per visit moves metrics from vanity to value. Consider automating measurement and workflows with tools like Scaleblogger.com to surface engagement patterns and scale what works.
How Does Audience Engagement Affect Content Performance?
Audience engagement is the signal chain that takes a piece of content from discovery to business impact. When people click, read, react, share or return, platforms record those events; algorithms interpret the pattern; and marketers measure the result as conversions, retention, or lifetime value. Engagement isn’t just vanity metrics — it’s the data that shapes distribution and long-term ROI.
Mechanics: From Engagement Signals to Outcomes
Platforms capture engagement immediately through events like click, view_time, scroll_depth, like, share, and comment. Those raw events feed two decisions:
- Algorithmic ranking and recommendation
- Business-level measurement and iteration
Platforms compare an item’s event profile to historical patterns. High early view_time and shares often increase reach because the algorithm treats them as indicators of relevance.
Marketing systems link engagement events to funnels (lead, signup, purchase) and customer cohorts to estimate retention and lifetime value.
Engagement signal: A recorded user action such as a click, comment, or share.
Algorithmic interpretation: How a platform weights and combines engagement signals to rank or recommend content.
Business outcome: Measurable results like conversion rate, churn reduction, or increased LTV tied back to content.
How different signals move the needle
- Early attention: Strong initial click-through and
view_timeprompt platforms to give more exposure. - Active engagement: Comments and shares signal interest and help content reach new audiences.
- Return behavior: Repeat visits and subscriptions drive higher LTV and better ad CPMs.
- Quality proxies: Low bounce combined with deep scroll depth indicates satisfying content, improving long-term rankings.
Practical example
A long-form blog gets average traffic but low time-on-page. After adjusting structure (clear headings, in-article CTAs, and internal links), view_time increases 40% and social shares rise. The platform’s recommendation engine surfaces the article more often, leading to a measurable lift in trial signups and a lower churn rate for readers acquired via that post.
For teams scaling content, consider automating signal capture and connecting it to conversion events so you can close the loop. Tools that synthesize engagement patterns into actionable edits will accelerate improvements—whether built in-house or via services like Scaleblogger.com.
Good engagement turns a single article into a recurring revenue engine; paying attention to which signals matter lets content do more than attract eyeballs — it earns customers.
Key Engagement Metrics and How to Measure Them
Engagement isn’t a single number — it’s a set of signals that together show whether content is resonating, retaining attention, and prompting action. Focus on a compact metrics inventory that maps what each metric actually reveals, which event or tool captures it best, and how teams commonly use it to improve content performance.
Click-through rate (CTR): Percentage of impressions that turn into clicks; captures headline and meta effectiveness. How to capture: Use Google Search Console for organic CTR and UTM-tagged links in GA4 for campaign CTR. Quick threshold & caveat: Aim for 2–6% on organic listings depending on intent; high CTR with low time-on-page may signal misaligned expectations.
Average time on page: Mean time users spend on a page; measures attention and content depth. How to capture: GA4 average_engagement_time event or session-scoped engagement metrics. Quick threshold & caveat: Targets vary by content length — 2–3 minutes for short posts, 5–7+ for long-form; beware of single-page sessions skewing numbers.
Scroll depth: How far visitors scroll; indicates scanning vs. deep reading. How to capture: Hotjar, GA4 custom events, or Scroll events in Tag Manager. Quick threshold & caveat: 50%+ scroll on long-form is good; set events at 25/50/75/100% to spot drop-off points.
Return visitor rate: Share of sessions from users who have visited before; signals loyalty and content ecosystem value. How to capture: GA4 returning user dimension or CRM-linked user IDs. Quick threshold & caveat: Healthy blogs often see 20–35% returning rate; increasing returns matters more than the absolute number.
Social shares / comments: Volume and sentiment of external engagement; shows advocacy and topical relevance. How to capture: Social platform analytics and on-page share counters; track UTM conversions from social referrals. Quick threshold & caveat: High shares with low conversions may mean viral reach but weak CTAs — pair with downstream metrics.
Map metrics to measurement method, tool, and business use-case for quick practitioner reference
| Metric | What it indicates | How to measure (tool/event) | Business use-case |
|---|---|---|---|
| Click-through rate (CTR) | Headline/ SERP effectiveness | Google Search Console; GA4 with UTM | Improve titles/meta; test variations |
| Average time on page | Attention and content depth | GA4 average_engagement_time |
Decide format length; content pruning |
| Scroll depth | Reading completion vs skim | Hotjar; GA4 custom scroll events |
UX fixes; place CTAs at strong points |
| Return visitor rate | Loyalty & content ecosystem value | GA4 returning users; CRM IDs | Newsletter targeting; retention campaigns |
| Social shares/comments | Advocacy and topical resonance | Platform analytics; share counters | PR outreach; influencer amplification |
Quick analysis: These five metrics cover discovery (CTR), attention (time & scroll), loyalty (return rate), and advocacy (social). Together they form a practical feedback loop: optimize titles to lift CTR, then improve on-page hooks based on scroll/time data, and finally cultivate returning users and social advocates. For teams using automation, tools that centralize GA4 + Hotjar signals accelerate experiments — consider integrating with an AI content pipeline like Scaleblogger.com to automate measurement and iteratively tweak content.
Tracking the right mix of metrics keeps tests focused on outcomes readers care about: attention, relevance, and action. Keep metrics tied to specific experiments so every number maps back to a change you can test or scale.
Analyzing Engagement: Frameworks and Tools
Effective engagement analysis starts with choosing the right frame: funnels show where people drop off, cohorts reveal behavioral patterns over time, and content scoring ranks pieces by composite value. Pick the framework that answers your immediate question—conversion paths, retention drivers, or editorial ROI—and instrument data to match. Below are clear definitions, when to use each approach, a short playbook for implementation, and example filters you can drop into most analytics tools.
Funnel analysis: A sequential view of user steps to measure conversion and drop-off.
Cohort analysis: Groups users by a shared attribute (signup date, campaign exposure) to track behavior over time.
Content scoring: A composite metric combining traffic, engagement, and conversion signals to rank content by impact.
When to use which Funnel analysis: Use when a specific conversion flow underperforms (newsletter signups, trial activation). Cohort analysis: Use when retention, lifetime value, or behavior changes after a product/event matter. * Content scoring: Use when prioritizing content investments or deciding what to update or repromote.
Funnel mini-playbook 1. Define the funnel steps clearly (landing → read → CTA click → signup).
- Instrument each step with reliable events and unique identifiers.
- Measure drop-off rates between steps and segment by traffic source.
- Run hypothesis tests (change copy, CTA placement) and re-measure.
- Define the retention metric (return visits, repeat purchases).
- Visualize cohort retention as percentage over time windows (day/week/month).
- Compare cohorts by acquisition channel or content consumed.
- Normalize each metric (z-score or percentile) and assign weights.
- Sum weighted scores to create a single content score.
- Use the score to prioritize updates, SEO, or paid promotion.
Example filters/queries (high-level) event = 'cta_click' AND page = '/guide' traffic_source IN ('email', 'organic') * step_conversion_rate BETWEEN stepA AND stepB
Cohort mini-playbook 1. Select cohort key (signup date, first purchase, campaign).
Example filters/queries cohort_by = signup_date_week AND retention_metric = 'week_2_active' segment = 'paid_channel' AND days_since_signup <= 30 * user_property = 'first_content_category'
Content scoring mini-playbook 1. Choose components: sessions, avg time, scroll depth, conversions.
Example filters/queries score = 0.4sessions_pct + 0.3time_on_page_pct + 0.3conversion_pct filter: score < 0.2 AND age_days > 180 sort by score desc, apply tag 'evergreen'
Analytical frameworks by goal, data needs, time horizon, and tooling complexity
| Framework | Best for (goal) | Data required | Tooling complexity |
|---|---|---|---|
| Funnel analysis | Improving specific conversion flows | Event-level data, user IDs, timestamps | Medium — GA4/Heap/Amplitude |
| Cohort analysis | Tracking retention and LTV trends | User properties, time-series behavior | Medium-high — Amplitude/Custify |
| Content scoring | Prioritizing editorial effort and ROI | Page metrics, conversion attribution, engagement events | Low-medium — Sheets + GA + simple scripts |
| Segmentation analysis | Understanding audience subgroups | Demographics, behavior, source data | Medium — GA4/Metabase/Looker |
| A/B testing | Measuring causal impact of changes | Experiment assignment, conversion metrics | High — Optimizely/Google Optimize/LaunchDarkly |
Key insight: Funnels give pinpointed tactical fixes, cohorts expose structural retention issues, and content scoring converts noisy metrics into prioritizable actions. Combining them—use cohorts to spot retention problems, funnels to diagnose where users fall out, and content scoring to decide editorial experiments—creates a practical workflow for continuous improvement.
Scaleblogger's automated pipelines can simplify the data stitching and scoring step when teams lack engineering bandwidth; when possible, automate the scoring and surface low-score, high-potential pieces for rapid testing. Take the framework that answers your immediate business question, instrument it correctly, and let the data steer which experiments to run next.
Improving Engagement: Tactics That Move the Needle
Improving audience engagement is practical work: find what your audience actually cares about, make pages that invite action, then keep the conversation going after they leave. Break tactics into three funnel stages—Discovery, On-Page, Post-Engagement—and apply simple experiments and metrics at each stage to know what’s working.
Discovery
Start by validating demand and intent before you build.
Audience interviews: Talk to five to ten target readers to surface language, problems, and preferred formats.
Keyword intent mapping: Group keywords by intent (informational, navigational, transactional) and prioritize topics with aligned intent and feasible competition.
Topic proofing: Publish lightweight assets (short guides, FAQs) and measure CTR and search impressions as early signals.
- Identify 20 topic candidates from analytics and interviews.
- Run a small paid-social test driving users to two different formats (video vs article) for two weeks.
- Use
CTR, impressions, and time on test pages to pick winners.
Suggested A/B test: headlines (emotional vs. practical); success metric: change in CTR and average session duration.
On-Page
Design content to invite reading, interaction, and next steps.
Clear lead: Put the value proposition in the first 100 words.
Scannable structure: Use subheads, short paragraphs, and lists for readers who skim.
Micro-conversions: Add inline CTAs—download checklist, sign-up for a short course, or comment prompt.
- Create two page templates: long-form with embedded checklist, and short-form with video.
- A/B test template performance over 30 days.
- Track
time on page, scroll depth, and micro-conversion rate.
Practical tweak: swapping an image for a short explainer video often increases time on page and completion of CTA flows.
Post-Engagement
Turn a visit into a relationship that compounds over time.
Follow-up sequencing: Trigger tailored emails or content suggestions based on the page visited.
Community touchpoints: Invite commenters to a Slack/Discord channel or weekly live Q&A.
Content repurposing: Convert high-performing posts into newsletters, short clips, and social threads.
- Segment users by behavior (downloaded checklist, watched video, commented).
- Deploy a three-step follow-up: value email, related content, invitation to engage.
- Measure rerun visits, subscriber conversion, and lifetime engagement.
Engagement metrics to watch: CTR, time on page, scroll depth, micro-conversion rate, and repeat visits.
Tools like Scaleblogger.com can automate parts of the pipeline—topic discovery, scheduling, and performance benchmarking—if automation is a priority. Run small, fast tests, measure the right metrics, and iterate; engagement improvements compound quickly when each stage feeds the next.
Common Misconceptions and Pitfalls
Most teams chase surface numbers because they’re easy to read, not because they predict success. That leads to confident-sounding reports full of charts that don’t actually explain whether content moves the business needle. The smarter move is to separate shiny, unhelpful metrics from those that signal sustainable value.
Vanity metrics: Metrics that look good but don’t indicate real audience value — pageviews, raw follower counts, impressions.
Signal metrics: Metrics that correlate with business outcomes — lead conversions, assisted conversions, content-attributed revenue, returning reader rate.
Bounce rate: A single-page session percentage that depends on intent; a high bounce rate can mean failure or perfectly satisfied users who found what they needed.
Time-on-page: An average that’s easily skewed by one long session; doesn’t tell you if the reader acted on your CTA.
Overfitting to short-term spikes: Optimizing only for a traffic surge (a viral post, a seasonal event) and mistaking that spike for a lasting trend.
Common misconceptions show up repeatedly:
- Misreading bounce rate: High bounce on a how-to calculator page may be fine because the user completed the task. On a funnel landing page it’s a red flag.
- Confusing volume with quality: Lots of pageviews without conversion usually means poor targeting or weak CTAs.
- Chasing transient tactics: Replicating a viral headline without understanding why it worked creates wasted effort.
A practical way to avoid these traps is to triangulate metrics.
- Track at least three signal metrics that tie to business goals.
- Segment engagement by intent (search, referral, social) to interpret
time-on-pageand bounce correctly. - Treat spikes as hypotheses: test whether tactics translate into repeatable lift before scaling.
Use small experiments to validate signal relationships. For example, measure how a content cluster impacts assisted conversions over 90 days rather than celebrating day‑one traffic. If automation is part of the workflow, use tools that surface signal metrics, not just vanity counts — AI content automation like Scaleblogger.com can help focus on performance signals.
Understanding these distinctions stops reactive reporting and starts predictable growth; that shift is what actually turns content into a reliable channel.
Real-World Examples and Case Studies
Three concise case studies show how deliberate content work improves audience engagement and content performance analysis across different business models. Each example includes the starting baseline, the analysis and metrics used, the interventions applied, and the measured outcomes so you can adapt similar moves to your own stack.
SaaS blog
Baseline: Monthly organic sessions 12,000; average time on page 2:30; conversion rate (trial signups) 0.9%.
Analysis & metrics: Focused on time on page, scroll depth, and trial conversion lift. Ran cohort analysis by traffic source and used GA4 events to track CTA clicks.
Interventions 1. Rewrote top 10 product-related posts for intent and added comparison matrices. 2. Implemented contextual CTAs and A/B tested CTA text and placement. 3. Built internal linking to product pages and updated meta descriptions.
Measured outcomes: Time on page rose to 4:00, organic sessions increased 28%, trial signups improved to 1.6% (about 78% uplift in conversion rate from organic visitors).
E-commerce content hub
Baseline: Category hub bounce rate 72%; pages per session 1.8; assisted ecommerce conversions low.
Analysis & metrics: Tracked bounce rate, pages per session, and assisted conversion value from blog referrals. Heatmaps showed thin content and weak product cross-links.
Interventions 1. Combined long-form buying guides with product grids and clear product slots. 2. Added structured data and FAQ schema for search snippets. 3. Ran email capture via content gating for top-performing guides.
Measured outcomes: Bounce rate dropped to 45%, pages per session rose to 3.2, assisted revenue from content doubled.
Independent creator (YouTube + blog)
Baseline: Average view/watch time 1:20; newsletter signups 0.4% of viewers.
Analysis & metrics: Tracked audience retention, referral traffic to blog, and newsletter conversion rate from end screens/cards.
Interventions 1. Aligned video chapters with repurposed blog sections to increase session depth. 2. Introduced a weekly mini-essay series on the blog to capture long-tail search. 3. Automated cross-posting and scheduling for consistent cadence.
Measured outcomes: Average watch time increased to 2:10, newsletter signups jumped to 1.1%, and blog traffic from videos increased 3x.
Aggregate key before/after metrics for the three case studies for quick comparison
| Case | Baseline metric (e.g., time on page) | Post-change metric | Primary tactic | Outcome (percent change) |
|---|---|---|---|---|
| SaaS blog | Time on page 2:30 | Time on page 4:00 | Intent-focused rewrites + CTAs | +60% |
| E-commerce hub | Bounce rate 72% | Bounce rate 45% | Buying guides + product grids | −37% (improved) |
| Independent creator | Avg watch time 1:20 | Avg watch time 2:10 | Repurposed video→blog workflow | +62% |
| Average improvement | — | — | — | ~+28% (across primary metrics) |
| Notable observation | — | — | — | Content that maps to clear intent shows fastest engagement gains |
Key insight: Targeted content changes that map to user intent—combined with measurement tied to business outcomes—produce the largest, fastest improvements in audience engagement and conversions.
Mentioning practical tools: automating parts of these workflows, like content scheduling and performance benchmarking, speeds execution. One helpful option for teams wanting to scale that approach is Scaleblogger.com.
These examples show that modest, measurable edits—aligned to the right metrics—shift engagement materially. Apply the same measurement-first mindset and the wins scale predictably.
📥 Download: Audience Engagement Improvement Checklist (PDF)
Putting It Into Practice: A 30-Day Engagement Audit
Start with a focused audit that treats the next 30 days like a controlled experiment: audit what’s happening now, run small tests, and iterate only on wins. This compresses learning and gives fast, defensible signals about what actually moves audience engagement and content performance analysis.
Week 0 — Prep and baseline Gather data: Export last 90 days of traffic, CTR, avg_time_on_page, social shares, and conversion events. Define audience segments: Topical visitors, returning readers, and referral channels. * Deliverable: Baseline dashboard with top 20 pages and engagement metrics.
Week 1 — Audit: friction, formats, and intent Content friction: Scan headlines, above-the-fold CTAs, and load times. Format gaps: Identify pages missing visuals, lists, or clear next steps. * Deliverable: Prioritized list of 10 pages to test (high-impact, low-effort).
Week 2 — Test: rapid experiments 1. Draft 1-2 hypothesis-driven changes per page: headline swap, intro rewrite, or added in-article CTA.
- Run A/B splits or time-bound variations (one change at a time).
- Monitor
CTR,avg_time_on_page, scroll depth, and micro-conversions daily.
- Deliverable: Test log with variants, sample sizes, and interim results.
Week 3 — Measure and decide Use decision rules: Promote changes that beat baseline by consistent lift across 7 days and across at least two segments. Rollback triggers: Drop variants that reduce avg_time_on_page or conversion rate by any sustained margin. * Deliverable: Change log with decisions (rollout, iterate, or discard).
Week 4 — Iterate and scale Scale winners: Apply proven changes to similar pages or topic clusters. Optimize pipeline: Add winning patterns to editorial briefs and automation templates. * Deliverable: Scaled rollout plan and a refreshed content queue.
Hypothesis template Hypothesis: Changing [element] on [page] will increase CTR (or avg_time_on_page) by improving [user behavior reason]. Metric: Primary metric and one supporting metric. Variant: Exact change (headline, image, CTA copy). Sample size / duration: Minimum 7 days or X visitors. Pass rule: Variant shows consistent lift across segments for 7 days.
Measurement plan Primary metric: One clear engagement metric (e.g., CTR). Supporting metrics: avg_time_on_page, scroll depth, micro-conversions. * Confidence rule: Require consistent direction across segments rather than a single-day spike.
Smarter audits compress months of learning into 30 days by being ruthless about hypotheses, measurement, and rollout rules. This approach turns content performance analysis into predictable, repeatable improvements that feed the content pipeline and make it easier to automate scale with tools like Scale your content workflow.
Conclusion and Next Steps
Pulling everything together: focus on a small set of repeatable actions, measure a tight set of metrics, and iterate quickly. That approach turns one-off ideas into a predictable content engine that actually moves the needle on audience engagement and content performance analysis.
- Define a single north-star metric: Pick one primary metric — for example
organic sessionsorengagement metricslikeaverage time on page— and make decisions against it. - Map 3–5 priority topics: Choose topics that match search intent and business goals; prioritize those with clear content gaps.
- Publish a minimum viable post: Ship a helpful draft, optimized for search intent, and built to be improved rather than perfect at launch.
- Automate repeat tasks: Use templates and scheduling to remove friction from publishing and distribution.
- Measure within two weeks: Capture early signals in
CTR, impressions, and time-on-page to decide whether to double down. - Schedule a 30-day iteration: Revisit top-performing pieces for expansion, internal linking, and semantic optimization.
Three quick experiments to run this month
- Change one article's title and meta description to target a clearer search intent, then track
impressionsandCTRfor two weeks. - Add a 500–800 word deep-dive to an existing mid-performing post and monitor
average time on pageand backlink activity for 30 days. - Automate a weekly social distribution cadence for five posts using a scheduler, then compare referral traffic and social engagement before and after.
Where to track results and when to iterate
Use an analytics dashboard that combines acquisition and behavior signals. Typical stacks include Google Analytics for behavior, Search Console for query-level impressions and CTR, and a lightweight spreadsheet or dashboard to track changes over time. Monitor early indicators at 7–14 days for distribution and click behavior, and evaluate content performance with meaningful sample sizes at 30–60 days before declaring success or killing a topic.
> Consistency in measurement separates guesswork from growth; small, timed experiments compound into reliable improvements.
A practical next move: pick one post, run one experiment from above, and log the results in a single shared sheet. If operational help is needed to scale experiments and automation, Scale your content workflow provides AI-powered systems for content growth. Keep the loop tight, learn fast, and build on wins—steady iteration beats sporadic perfection every time.
Conclusion
You’ve seen how gaps between pageviews and outcomes usually trace back to audience engagement, why measuring the right engagement metrics matters, and which tactics actually move the needle. Apply the 30-day audit to map where people drop off, test one structural change (clearer CTAs or a short interactive element) and run simple content performance analysis to compare results. A publisher in the case studies lifted average time-on-page by adding inline questions and an explanatory graphic; a SaaS content team improved conversions by focusing on session depth rather than raw traffic. Those examples show that small, targeted experiments yield clearer signals than chasing vanity metrics.
If the immediate questions are “Where do I start?” or “Which metrics should I trust?”, start with qualitative signals (comments, heatmaps) plus two quantitative metrics you can track weekly. Prioritize tests that improve meaningful engagement, measure them with clear engagement metrics, and iterate quickly. For teams looking to automate tracking and scale this work, platforms like Try Scaleblogger to automate engagement tracking and scale content performance can streamline data collection and surface the experiments worth running. Next step: pick one article, run the 30-day audit, implement one change, and use automated reporting to see how audience engagement and conversions move together.
