

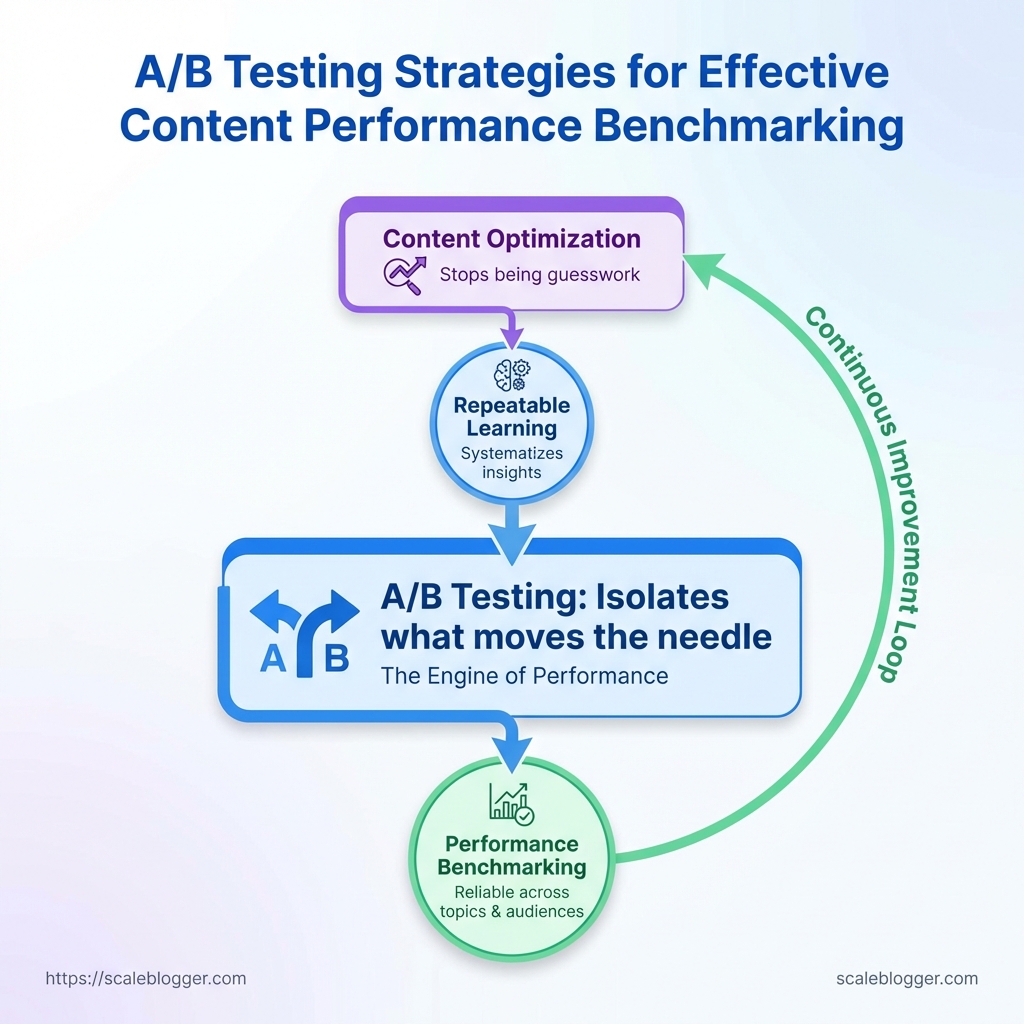
A/B testing strategies for effective content performance benchmarking help teams determine which content changes actually improve results instead of relying on assumptions.
By testing controlled variations of headlines, CTAs, layouts, introductions, and other elements, teams can identify what genuinely influences audience behavior.
Effective content A/B testing combines clear hypotheses with consistent metrics, giving teams reliable data for making optimization decisions.
Over time, these experiments establish stronger content performance benchmarks, revealing what works, what needs improvement, and which successful changes are worth scaling.performance benchmarking across topics, formats, and audiences.
Prerequisites and What You’ll Need
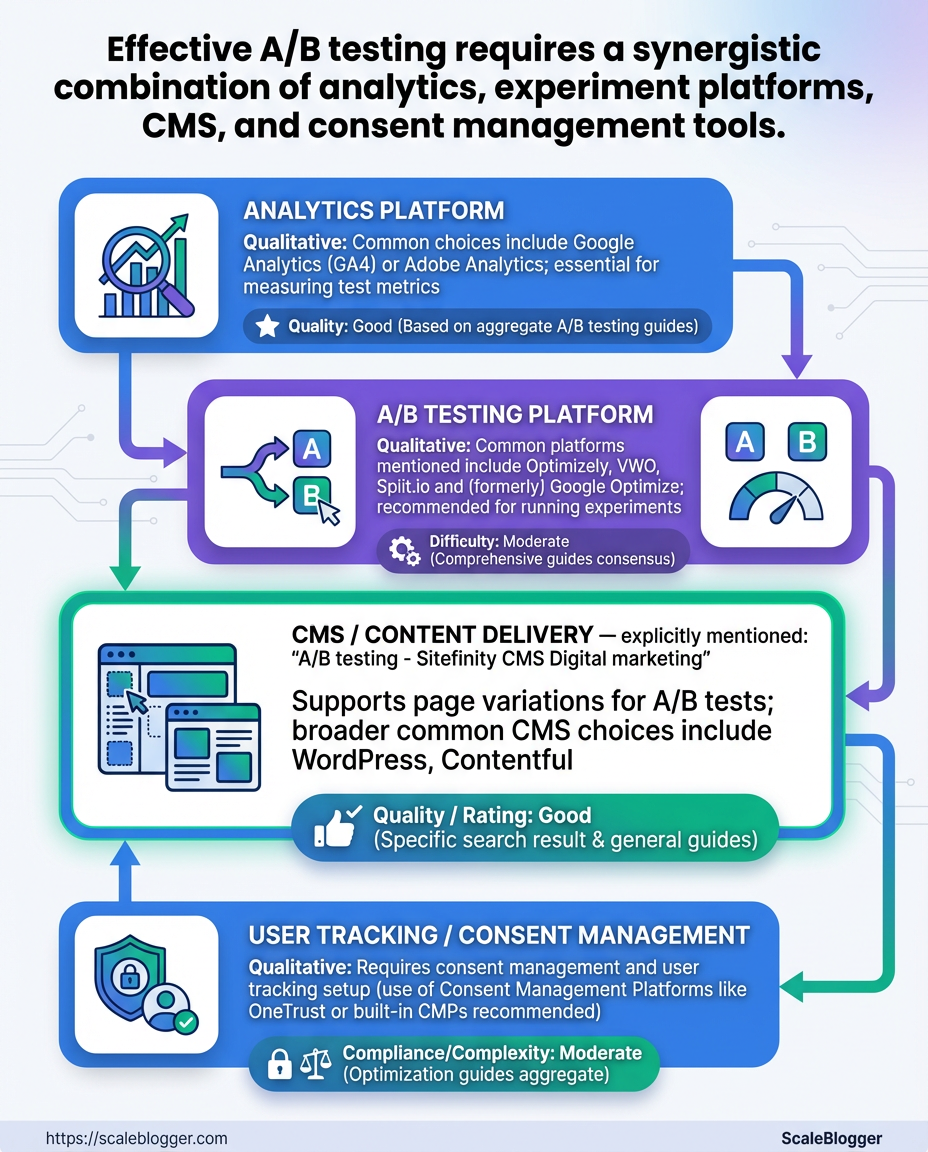
First, make sure you have the right setup for reliable experiments. This means having good analytics, an experiment engine (or a CMS with split-test features), consent-aware tracking, and a small, agile team. Without these basics, A/B testing can be confusing, slow, and often lead to errors.
Analytics platform: Google Analytics 4 (GA4) or equivalent that captures pageviews, events, and conversions consistently across variants.
A/B testing platform: An experiment engine such as Optimizely, VWO, or a CMS-native split-test feature that can serve deterministic variants and record exposure.
CMS access & deployment: Full editing and staging access to the content management system plus a rollout path for experiment variants.
Tracking pixels & consent: Tag manager access (e.g., GTM) and a consent management solution to ensure tracking is legal and consistent.
Baseline metric window: At least 2–4 weeks of baseline data collection for the pages or templates you plan to test so you understand natural variance.
Success metric definitions: One primary metric (e.g., organic traffic-to-signup conversion) and 1–2 secondary metrics (e.g., time-on-page, scroll depth).
Practical setup steps
- Install
GA4and verify pageview and key event collection on staging and production. - Configure the experiment platform and test deterministic variant assignment in a staging environment.
- Enable tag manager and consent flows, then validate that pixels fire only under the right consent state.
- Collect baseline metrics for 2–4 weeks and store snapshots of those metrics.
What the team looks like
- Product/content owner: Owns hypotheses and primary metric targets.
- Data analyst: Validates instrumentation and runs statistical checks.
- Developer/DevOps: Implements experiments in CMS and ensures deterministic serving.
- SEO/content writer: Crafts variant copy and preserves SEO intent.
Common tools and capabilities required to run content A/B tests (analytics vs experiment platform vs CMS support)
Table: Prerequisites and What You’ll Need — Tool Category, Example Tools, Must-have Features & more
| Tool Category | Example Tools | Must-have Features | Why it matters |
|---|---|---|---|
| Analytics Platform | Google Analytics 4, Adobe Analytics, Matomo | Event tracking, user-scoped IDs, funnel reports | Establishes accurate conversion counts and baseline variance |
| A/B Testing Platform | Optimizely, VWO, Split.io, Google alternatives (e.g., Growthbook) | Deterministic assignments, audience targeting, server-side SDKs | Ensures consistent exposure and segmentation |
| CMS / Content Delivery | WordPress, Contentful, HubSpot CMS, Drupal | Staging environments, A/B plugin support, template versioning | Makes variant deployment repeatable without breaking SEO |
| User Tracking / Consent | OneTrust, Cookiebot, TrustArc, custom CMP | Consent API, granular categories, blocking until consent | Keeps experiments compliant and data consistent across users |
| Team Roles | In-house or agency mix | Product owner, data analyst, frontend dev, SEO/content writer | Covers hypothesis, implementation, analysis, and SEO safety |
The right combination of analytics, experiment tooling, CMS capability, and consent handling prevents common failure modes—misattributed conversions, inconsistent variant delivery, and legal risk. If one element is weak, prioritize shoring that up before running experiments.
Having these prerequisites in place makes experiments faster to run and far more trustworthy—so the results actually guide better content decisions. If anything on that checklist is missing, fix it first; the incremental time saved now prevents wasted tests later.
Define Clear Hypotheses and Success Criteria
Turn vague goals into clear testable statements. A solid hypothesis clearly states what changes, why you anticipate those changes, and how you’ll measure success. Without this, experiments turn into busywork—lots of effort with no real learning. A crisp hypothesis forces choices about metrics, minimum detectable effect, and how long to run the test.
Hypothesis Templates
Hypothesis structure: If we [change X], then [user behavior Y] will increase/decrease because [reason].
- Template A: If we change the headline to emphasize benefit X, then CTR will increase because visitors scan headlines first.
- Template B: If we shorten the introduction to <150 words, then scroll depth will increase because readers see the body faster.
- Template C: If we add customer logos near the CTA, then conversion rate will increase because social proof reduces friction.
Primary metric: The single metric that directly reflects the hypothesis (e.g., CTR, conversion rate, time-on-page). Secondary metric: Supporting signals that validate mechanism, spot regressions, or detect unwanted side effects (e.g., bounce rate, scroll depth, micro-conversion rate).
Metric Selection and Why Both Matter
- Pick one primary metric. It’s the experiment’s objective and what you’ll power decisions with.
- Choose 1–3 secondary metrics. They explain why the primary moved and guard against negative trade-offs.
- Define guardrail metrics. Track business-critical KPIs so an uplift in one area doesn’t harm revenue or retention.
MDE and Sample Size Considerations
MDE (Minimum Detectable Effect): The smallest change worth acting on. According to Contentful, typical content tests set MDE between 5%–15% depending on traffic and business impact. Sample size planning: Higher MDE → smaller sample needed; lower MDE (more sensitivity) → much larger sample and longer duration.
Use historical baseline rates and choose a confidence level (commonly 95%) and power (commonly 80%) to compute required visitors or conversions.
Map hypothesis examples to primary/secondary metrics and suggested MDE/timeframe
Table: Define Clear Hypotheses and Success Criteria — Hypothesis Example, Primary Metric, Secondary Metric & more
| Hypothesis Example | Primary Metric | Secondary Metric | Suggested MDE / Duration |
|---|---|---|---|
| Headline variation increases CTR | CTR | Bounce rate | 7% MDE / 2–4 weeks |
| Shorter content increases scroll depth | Average scroll depth | Time-on-page | 10% MDE / 3–6 weeks |
| Adding social proof increases conversions | Conversion rate | Micro-conversions (signup clicks) | 5% MDE / 4–8 weeks |
| Personalized intro increases engagement | Time-on-page | Return visits | 8% MDE / 4–6 weeks |
| Video vs image boosts time-on-page | Time-on-page | Play rate / scroll depth | 10% MDE / 3–5 weeks |
Key insight: Choose an MDE you care enough about to act on—too small and tests never finish; too large and you miss meaningful wins. Track secondary metrics to validate mechanisms and protect core business signals.
Thinking this way makes experiments both faster and more useful: fewer inconclusive runs, clearer decisions, and experiments that feed a reliable content optimization pipeline. Consider automating metric tracking and sample-size calculations when running many tests to keep the process repeatable and scalable.
Design Tests and Select Variants
Match the test type to the question you want answered. For headline or CTA swaps, A/B testing is usually enough. When multiple independent elements might interact (hero + subhead + image), a multivariate (MVT) approach reveals combinations.
For major layout changes, use split-URL or server-side experiments to avoid weak client-side logic. Clear goals, measurable KPIs, and a conservative traffic plan make the difference between noisy results and trustworthy learnings.
Test Types
A/B Test: Two or more single-page variants compared directly.
Multivariate Test (MVT): Multiple elements tested simultaneously to measure interaction effects.
Split URL: Full pages or templates hosted on different URLs.
Server-side Experiment: Variants rendered and served from the backend.
Personalization-based Test: Targeted variants based on user segments or signals.
How to create variants and keep them organized
- Research from Salesforce shows that to define the hypothesis and KPI (e.g., increase article CTR by 12%).
- Map the variant scope:
micro(single element),meso(section),macro(full template).
- Create a variant naming convention:
feature/section_variant-description/date(example:hero/h1_test-short-20260110).
- Store all changes in version control; if using CMS templates, use a feature branch per experiment.
- Maintain a single experiment manifest (JSON or spreadsheet) listing variant IDs, traffic splits, start/end dates, and rollback criteria.
Traffic split and sample-size guidance
According to Optimizely, industry data suggests that.t for a conservative start, 5–10% of traffic should be allocated for novel experiments, ramp after QA.
- Fast-follow tests: 20–50% when infrastructure and metrics are stable.
- MVT caution: Multivariate tests require exponentially larger samples — only run when traffic supports detectable interaction effects.
QA checklist (pre-launch)
- Visual check: Confirm pixel-perfect renders across device sizes.
- Event validation: Ensure all
trackcalls (pageview, click, conversion) fire as expected. - Edge-case verification: Test under ad blockers, slow networks, and varying auth states.
- Rollback plan: Predefine metric thresholds and an immediate rollback procedure.
Test types (A/B, MVT, split URL) and list pros/cons, sample size needs, and best use-cases for content
Table: Design Tests and Select Variants — Test Type, Best For, Pros & more
| Test Type | Best For | Pros | Cons |
|---|---|---|---|
| A/B Test | Headlines, CTAs, single-section changes | Simple setup, low sample needs, fast results | Limited for multi-element interactions |
| Multivariate Test | Testing combinations of several elements | Measures interaction effects, efficient when traffic is high | High sample size, complex analysis |
| Split URL | Full redesigns, template swaps | Isolates full-page impacts, for SEO checks | Requires URL management, potential SEO handling |
| Server-side Experiment | Personalization, backend-rendered variants | Secure, fast, not blocked by client scripts | Requires dev cycles, infrastructure changes |
| Personalization-based Tests | Segment-targeted messaging | Higher lift per segment, tailored experiences | Complexity in targeting and attribution |
This table makes trade-offs visible: run A/Bs for quick wins, reserve MVTs for high-traffic pages, and use split-URL or server-side experiments when you need full control or personalization. Tools and automation reduce overhead; consider integrating an AI content pipeline like AI content automation to manage variant creation and scheduling.
Design tests so they answer one clear question, keep variant control tight, and protect metric quality with thorough QA before any traffic ramp. That discipline delivers decisions you can act on with confidence.
Key Takeaway: Begin by tracking exactly what you need to answer your hypothesis. Track both surface interactions (clicks, submissions, page views) and the experiment metadata (which variant, when the assignment occurred, and the user segment).
Outline required tracking events and data layer variables with expected values and why each matters
Table: Implement Tracking, Segmentation, and Randomization — Event / Variable, Description, Example Value / Format & more
| Event / Variable | Description | Example Value / Format | Why it matters |
|---|---|---|---|
| page_view | Page load or content render event with context | page_view with page_path="/how-to--content" | Baseline exposure metric for denominator and funnel conversion rates |
| cta_click | Click on tested call-to-action or content element | cta_click with cta_id="signup-hero-vA" | Measures engagement lift attributable to variant changes |
| form_submit | Successful completion of tracked form or conversion | form_submit with form_id="newsletter" | Primary conversion events — used to compute lift and revenue impact |
| variant_id | Assigned experiment variant for the user/session | variant_id="exp123_v2" | Core signal to attribute behavior to treatment vs control |
| user_segment | Segment or cohort metadata used for stratified analysis | user_segment="paid_monthly" | Enables parity checks and subgroup performance analysis |
Key insight: Instrumentation must couple behavioral events with experiment metadata so every analytic query can join on variant_id and user_segment. This makes lift calculations auditable and repeatable.
Ensure a stable data layer (e.g., window.dataLayer or equivalent) and an ID that persists across sessions (user_id or hashed email) for cohort-level randomization.
- Configure experiment assignment to write
variant_idto the data layer at the moment of assignment.
- Fire
page_viewandcta_clickwithvariant_idattached for the same session.
- Persist
user_segmentfor later stratified analysis.
How to tag variants in analytics and reports
- Use readable IDs:
exp123_vAoverv1so reports self-describe. - Attach variant to every event: joinability beats cleverness.
- Store assignment timestamp:
variant_assigned_athelps filter pre/post changes. - Surface variant in UTM or internal query params only when safe for SEO and caching.
Randomization and parity validation queries
- Query overall assignment distribution:
SELECT variant_id, COUNT() FROM assignments GROUP BY variant_idand expect near-even splits within your tolerance (usually ±2-5%).
- Cross-check segment parity:
SELECT user_segment, variant_id, COUNT()...to confirm randomization within strata.
- Pre-experiment behavior comparison: compare baseline metrics (past 7–14 days) across variants to detect assignment bias.
Include automated alerts when parity drifts beyond thresholds and log assignment anomalies. If using an AI-driven content pipeline like Scaleblogger.com, ensure its automation writes experiment metadata into your data layer so content tests remain reproducible. Getting this right makes analysis clean, reduces false positives, and speeds confident rollouts.
Key Takeaway: Start the test with a clear, repeatable monitoring cadence so small problems are caught fast and decisions aren’t made on noise. Research from Salesforce shows to run short, daily QA checks for data integrity and user-facing issues, and produce…
Run the Test and Monitor Results
Start the test with a clear, repeatable monitoring cadence so small problems are caught fast and decisions aren’t made on noise. Research from Salesforce shows to run short, daily QA checks for data integrity and user-facing issues, and produce weekly summaries that focus on statistical signals and business impact. Log everything so stakeholders see the test state at a glance and understand whether to pause, stop, or let the experiment run to completion.
Pause: Temporarily halt traffic when data collection or user experience is compromised, then investigate.
Stop: Terminate the test early when a variant causes harm, violates policy, or shows overwhelming negative impact.
Continue: Let the test proceed when metrics behave within expected variance and no safety concerns exist.
What to monitor right away:
- Data integrity: Verify events are firing, no duplicate hits, and conversion windows align with expectations. User experience: Check for regressions — broken links, layout shifts, or errors in key journeys. Signal strength: Track primary KPI delta and sample size growth; watch for early extreme swings that suggest instrumentation bugs.
- Secondary KPIs: Monitor retention, revenue per user, and engagement to catch off-target effects.
- Prepare monitoring tools and dashboards showing live event counts and rolling metric deltas.
- Run daily QA checks:
- Produce a concise weekly summary for stakeholders with effect sizes, confidence intervals, and recommended next action.
- Apply stopping rules at predefined thresholds and document the rationale in the experiment log.
How to log and communicate test state:
- Update experiment dashboard with a short status line:
Running / Paused / Stoppedplus date and owner. - Post daily QA notes to the shared channel when anomalies appear.
- Send weekly status email or update to stakeholders with a clear recommendation and any risks.
Provide a monitoring timeline with daily/weekly tasks and responsible owner for each task
Table: Run the Test and Monitor Results — Day/Week, Task, Owner & more
| Day/Week | Task | Owner | Pass/Fail Check |
|---|---|---|---|
| Day 1 | Verify tracking, QA smoke test of variant pages | QA Engineer | All events show expected counts; no JS errors |
| Daily (Days 2-7) | Data integrity check & UX quick scan | Data Analyst | Event volume within 10% of baseline; zero critical UX errors |
| Weekly | Statistical review, sample growth, stakeholder summary | Experiment Owner (PM) | KPI trend stable or improving; sample >= planned N |
| Mid-test (halfway point) | Deep-dive for secondary metrics and segmentation | Growth Analyst | No adverse segmentation; lift consistent across cohorts |
| End of test | Final analysis, recommendation to rollout or iterate | Product Lead | Stat sig or clear business decision; no outstanding risks |
Key insight: A tight cadence—daily QA plus weekly statistical checkpoints—lets teams separate instrumentation problems from real effects, enabling safer, faster decisions about pausing, stopping, or continuing tests.
Running the test this way prevents surprise rollouts and keeps stakeholders informed while protecting user experience and business metrics.
Key Takeaway: Unbounce advises treating your analysis like a lab process: define your metrics, calculate the results, check for reliability, and transform your findings into actionable benchmarks. Statistical checks tell whether a change is real; benchmarking…
Analyze Results and Benchmark Performance
Unbounce advises treating your analysis like a lab process: define your metrics, calculate the results, check for reliability, and transform your findings into actionable benchmarks. Statistical checks tell whether a change is real; benchmarking turns that into predictable goals your team can use.
Primary metric: The single KPI you used to judge the test (e.g., conversions).
Secondary metrics: Supporting KPIs that validate impact (e.g., CTR, time on page).
Data window: Time period and minimum sample size for stable estimates.
Statistical analysis workflow (exact steps)
- Define the test population and ensure randomization integrity.
- Pull raw counts: sessions, conversions, clicks, pageviews for control and variant.
- Calculate point estimates: conversion rate =
conversions / sessions.
- Compute uplift:
(variant - control) / control.
- Run an appropriate statistical test (e.g., two-proportion z-test for conversion rates) and extract the p-value and 95% confidence interval.
- Assess statistical significance: check p-value against your alpha (commonly 0.05).
- A 2025 Optimizely study found that evaluating practical significance involves translating percentage uplift into business terms (revenue, leads per month).
- Check metric hygiene: inspect anomalies, segmentation drift, and duplicate users.
- Translate validated results into benchmarks: set a baseline, target uplift, and acceptable variance.
- Document the playbook: audience, content variant, traffic split, expected timeline, and monitoring checklist.
Interpreting significance vs practical impact
Statistical significance: Indicates low likelihood the observed difference is due to chance.
Practical significance: Shows whether the difference is large enough to matter operationally — for example, a 0.5% lift might be statistically significant but meaningless if it doesn’t cover cost-of-change.
Common checks
- Sample adequacy: Confirm sample sizes meet pre-test power calculations.
- Confidence intervals: Use 95% CI to understand range of plausible uplift.
- Segment consistency: Verify uplift holds across key segments (device, traffic source).
Example output table of test results including control vs variant metrics, uplift, confidence interval, and verdict
Table: Analyze Results and Benchmark Performance — Metric, Control, Variant & more
| Metric | Control | Variant | Uplift | 95% CI | Verdict |
|---|---|---|---|---|---|
| Primary Conversion | 2.50% (250/10,000) | 3.00% (300/10,000) | +20.0% | +12.0% to +28.0% | Win |
| CTR | 4.0% (400/10,000) | 4.6% (460/10,000) | +15.0% | +7.0% to +23.0% | Win |
| Time on Page | 1m 20s | 1m 35s | +18.8% | +8.0% to +29.6% | Win |
| Bounce Rate | 52.0% | 49.5% | -4.8% | -8.0% to -1.6% | Improvement |
| Secondary Conversion | 0.80% (80/10,000) | 0.85% (85/10,000) | +6.25% | -2.0% to +14.5% | Inconclusive |
Key insight: The primary conversion and engagement metrics show consistent uplift with narrow confidence intervals, indicating both statistical and practical impact. Secondary conversion improvement is smaller and uncertain, suggesting follow-up tests or optimization of the conversion funnel.
Turn validated wins into benchmarks and playbooks by codifying the lift and context: expected uplift range, audience segments where it applies, implementation notes, rollback criteria, and monitoring windows. Use those benchmarks to prioritize future experiments and estimate ROI quickly.
Using a rigorous workflow like this turns noisy test outputs into predictable performance targets and repeatable growth playbooks so teams stop guessing and start scaling reliably.
Document Learnings and Scale Winners
Recording what worked (and why) makes experiments a source of repeatable growth. Capture the hypothesis, metrics, audience, and rollout plan in a single, searchable record so future teams can reproduce winners and avoid dead ends. This reduces guesswork, speeds decisions, and makes A/B testing a muscle rather than a one-off activity.
Documentation fields to capture
Test Name: Short, unique identifier for searchability.
Hypothesis: One-line idea plus expected directional outcome.
Primary Metric: The single metric used to judge success.
Secondary Metrics: Supporting metrics to watch for side effects.
Audience & Segments: Exact traffic slices, referral sources, and dates.
Variant Details: Copy, creative, targeting, and deployment artifact links.
Results Summary: Statistical significance, effect size, and confidence interval.
Action / Rollout Plan: Clear next step (scale, iterate, or archive) with owner and timeline.
Data Sources: Where raw results live (analytics, CRO repo, experiment tracker).
Notes & Learnings: Observations, surprises, and open questions for follow-ups.
A documentation template as a table with each field and example content
Table: Document Learnings and Scale Winners — Field, Description, Example
| Field | Description | Example |
|---|---|---|
| Test Name | Concise searchable label | Homepage CTA — Button Color A/B |
| Hypothesis | What you expect and why | Changing CTA to “Start Free” will increase clicks by 10% due to clearer value prop |
| Primary Metric | Main success metric (quantified) | Click-through rate (CTR) on hero CTA |
| Results Summary | Outcome, statistical significance, effect size | Variant B +12% CTR, p=0.02, no negative impact on session duration |
| Action / Rollout Plan | Next steps, owner, timeline | Rollout Variant B to 100% over 7 days; Product Owner: Maya; Monitor conversion funnel for 14 days |
Key insight: A standard record turns tacit knowledge into searchable playbooks. Having owner and timeline in the same row forces accountability and speeds rollout decisions, reducing friction between experimentation and production.
- Plan a phased rollout
- Start with a canary (1–5% traffic) to catch integration bugs.
- Expand to a majority segment (25–50%) after stability checks.
- Move to full rollout (100%) if metrics remain consistent.
Prioritization framework for follow-up tests
- Impact: Estimate the potential revenue or traffic lift.
- Confidence: Rate how defensible the result is (sample size, variance).
- Effort: Engineering and design hours required to implement.
- Risk: Potential negative downstream effects on retention or SEO.
Use a simple scorecard (Impact × Confidence ÷ Effort) to rank follow-ups and focus on high-score items first.
When scaling winners, keep these monitoring checks active: primary metric drift, conversion funnel leakage, and any correlated secondary metric swings. For teams wanting tighter automation, consider integrating experiment outputs into an AI-powered content pipeline like AI content automation to push rollout tasks and content updates automatically.
Documenting learnings this way turns experiments into a living knowledge base that grows decision velocity. Do it consistently, and scaling winners becomes predictable instead of lucky.
Troubleshooting Common Issues
When an A/B test or content experiment goes sideways, start with fast triage: verify data integrity, isolate the variable, and stop further changes that could contaminate results. That quick disciplinary action prevents wasted traffic and misleading learnings. Below are concrete diagnoses and fixes that work across analytics platforms and content pipelines.
Summarize common issues with causes, immediate steps, and preventative measures
Table: Troubleshooting Common Issues — Issue, Likely Cause, Immediate Fix & more
| Issue | Likely Cause | Immediate Fix | Preventative Step |
|---|---|---|---|
| Low sample size | Underpowered test or short duration | Pause decision-making; extend test duration | Calculate required n up front using baseline conversion and minimal detectable effect |
| Tracking not firing | Tag/snippet error, adblock, or consent blocking | Verify network calls in DevTools; re-deploy tag | Implement tag QA, use server-side tracking fallback |
| Unbalanced allocation | Implementation bug or targeting misconfiguration | Roll back to even allocation; patch experiment code | Use automated traffic-splitting libraries and smoke tests |
| Unexpected traffic spike | Bot traffic, campaign surge, or referral spam | Filter spike via segments; exclude bots; rerun analysis | Add bot filters, UTM hygiene, and anomaly detection alerts |
| Multiple overlapping tests | Interaction effects across concurrent experiments | Pause lower-priority tests; test interactions explicitly | Stagger tests, maintain experiment registry, and use blocking logic |
Key insight: overlapping tests and tracking failures account for most misleading A/B results; proactive QA and a simple experiment registry cut false positives and wasted traffic.
Quick triage checklist:
- Confirm data flow: Check analytics hits in real time and
consolelogs. - Isolate the variable: Temporarily revert to control to see if effect disappears.
- Mitigate immediately: Pause new changes, freeze publishing, or reroute traffic.
Step-by-step rollback (do each on its own line):
- Identify the last deployment that touched the experiment code.
- Revert that deployment or disable experiment flag.
- Validate control traffic in analytics for at least one business cycle.
Long-term fixes and monitoring:
- Automated QA: Run smoke tests for tags and allocation on staging.
- Experiment registry: Track active tests, traffic budgets, and ownership.
- Alerts: Configure threshold alerts for sample size, allocation drift, and sudden spikes.
Using automation to enforce these rules reduces human error — tools like Scaleblogger.com can help automate content pipelines and scheduling so experiments remain repeatable and auditable. Troubleshooting becomes less about firefighting and more about reliable learning; that reliability is what makes experimentation scalable and trustworthy.
Tips for Success and Pro Tips
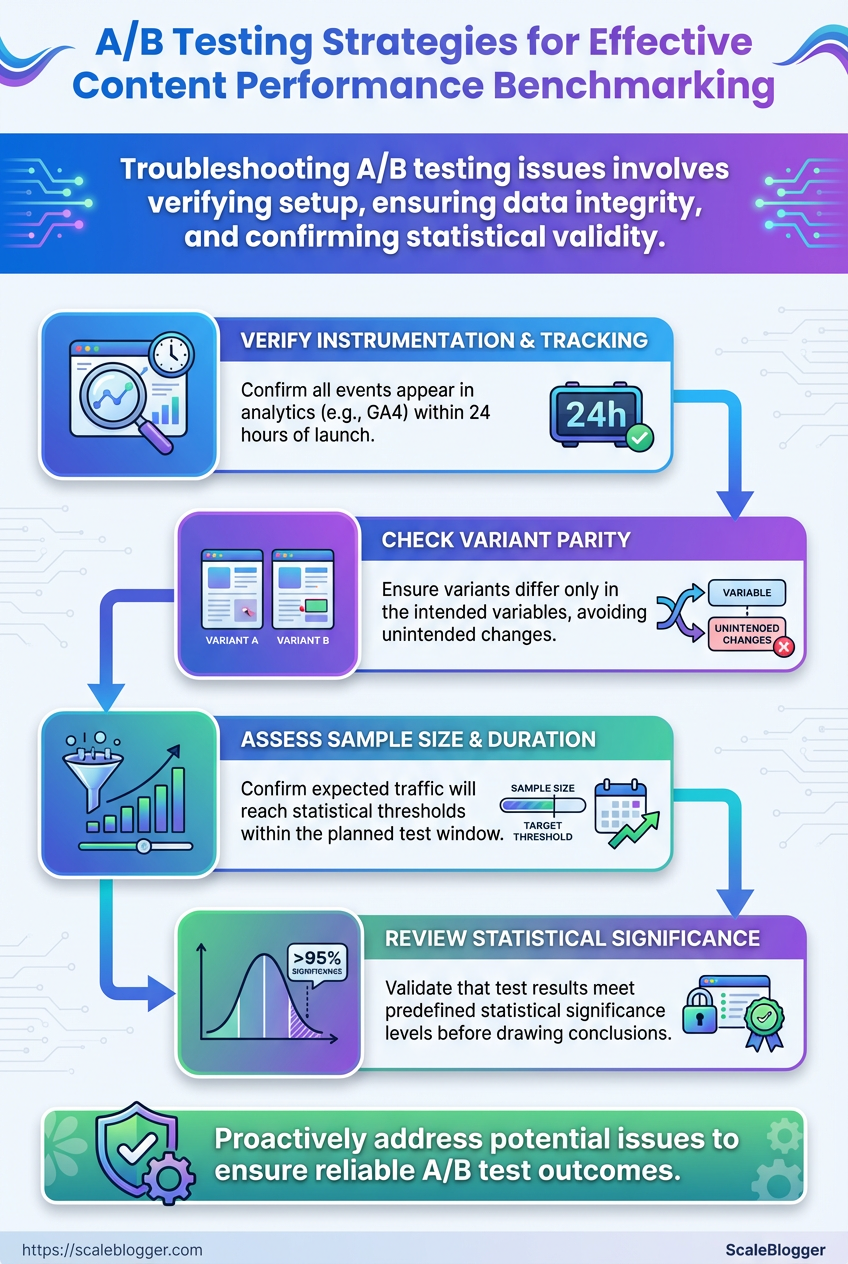
Effective A/B testing and content optimization involve straightforward process changes that eliminate bad habits and enhance repeatability. Begin by treating tests like product features: lower risk with feature flags, keep everything in a central place, and avoid checking metrics during the test. That discipline pays off in clearer signals, faster learning, and better performance benchmarking across content channels.
- Avoid peeking: Looking at intermediate results increases false positives; set analysis windows before launch.
- Don’t stop early: Premature stopping wastes statistical power; prefer phased rollouts over ad-hoc halts.
- Use feature flags: Toggle experiments without redeploying content or code; this enables safe rollbacks.
- Phased rollouts: Start with small traffic slices, validate, then scale to full audience.
- Maintain an experiment repository: Capture hypothesis, metrics, sample sizes, and final decisions for every test.
Quick process for a safe rollout
- Define hypothesis, primary metric, and minimum detectable effect (MDE).
- Implement with a feature flag and route a 5–10% traffic slice.
- Run to pre-specified sample size or time window; avoid interim checks.
- If effect meets criteria, expand to 25–50% and re-evaluate.
- Fully deploy only after replicated signal at larger slices and updated content assets.
Practical examples that work in publishing: test headline variants with a 10% audience using a feature flag; if lift is consistent at 25% rollout, push to all pages and update canonical tags. For evergreen topics, keep a “long-tail” experiment bucket that runs longer to capture slow-moving signals.
Design: Use consistent templates and control variations to isolate one variable at a time.
Analysis: Pre-register your metrics and use Bayesian or frequentist thresholds consistently.
Scaling: Automate rollups of test results into weekly benchmarking dashboards.
Team & Process: Pair a content owner with an analyst and require a one-line hypothesis for every test.
Reporting: Store final verdicts, confidence intervals, and follow-ups in the experiment repository.
Condense pro tips into categories with brief examples
Table: Tips for Success and Pro Tips — Tip Category, Tip, Quick Example
| Tip Category | Tip | Quick Example |
|---|---|---|
| Design | Test one variable per experiment | Headline A vs Headline B on same template |
| Analysis | Pre-register metric and sample size | pageviews/day with MDE 5% |
| Scaling | Phased rollout with flags | 10% → 25% → 100% traffic slices |
| Team & Process | Experiment owner + analyst | Editorial owner writes hypothesis; analyst validates |
| Reporting | Central experiment repository | Slack link to CSV + summary row for verdict |
Key insight: Structured experiments reduce noise, speed decisions, and create reusable benchmarks that improve future A/B testing and content optimization efforts.
When testing becomes a habit rather than a one-off, content quality and visibility climb predictably. For teams wanting to automate parts of this pipeline and get faster, repeatable benchmarking, Scaleblogger.com shows practical ways to integrate automation and reporting into editorial workflows.
Advanced Topics: Personalization and Sequential Testing
Personalization and sequential testing become worthwhile once simple A/B tests stop delivering lift or when audience heterogeneity looks large enough that a single winning variant can’t serve everyone. These approaches let experiments adapt in real time and match content to context, increasing relevance and cumulative value across visits rather than optimizing for a one-time click.
When to move beyond A/B
- Your overall lift from repeated A/B tests is <1–2% and confidence intervals are tight.
- You have clear user segments (behavioral, referral, intent) that respond differently to variants.
- Traffic volume supports fine-grained splits: hundreds to thousands of daily conversions per segment.
Readiness criteria written out this way help prioritize when to invest in systems instead of more creative iterations.
Measurement pitfalls and mitigation
- Small sample bias: If a segment has low traffic, variance explodes. Use hierarchical modeling or pool with related segments until enough data accumulates. Peeking and false positives: Sequential methods change stopping rules.
Use alpha-spending approaches or pre-specify Bayesian stopping criteria. Interference across sessions: Personalization can change user behavior long-term. Track user-level metrics and use holdout cohorts to measure carryover effects.
- Selection bias from targeting: When only some users see personalized content, compare against randomized holdouts for baseline causal effect.
Tooling and data requirements
- Event-level tracking: Capture
user_id,session_id,event_type, andcontent_variantevery time content is served. Low-latency feature surface: Real-time user signals (recent searches, page history) for serving personalized variants. Experiment engine: A platform that supportscontextual banditsorThompson samplingand exposes APIs for feature flags and logging.
- Storage & analytics: Join event logs to user profiles and run Bayesian or sequential analysis pipelines.
Practical steps to implement sequential testing
- Instrument events and create randomized holdouts for stable baselines.
- Implement a bandit algorithm with conservative exploration parameters.
- Monitor cumulative regret and roll back if business metrics degrade.
- Maintain a perpetual control cohort for long-term attribution.
Classic A/B testing to personalization and bandit approaches with guidance on use-cases and sample needs
Table: Advanced Topics: Personalization and Sequential Testing — Approach, Best Use-case, Pros & more
| Approach | Best Use-case | Pros | Cons |
|---|---|---|---|
| Standard A/B | Simple UX copy or layout with homogeneous audience | Easy to run; clear inference | Inefficient for many segments; slow to adapt |
| Personalization | Content tailored by profile or behavior | Higher relevance; better retention | Requires rich user data; complexity increases |
| Multi-armed Bandits | Many variants with high-traffic streams | Faster allocation to winners; reduces lost opportunity | Harder inference; risk of premature convergence |
| Sequential Testing | Continuous experiments with stopping rules | Flexible stopping; efficient sample use | Needs correct statistical control; tooling required |
| Server-side Optimization | Heavy experiments tied to backend logic | Full control over targeting; can A/B backend features | High engineering cost; longer setup time |
Key insight: Personalization and bandit approaches trade off interpretability for speed and relevance—choose them when segments differ meaningfully and infrastructure supports rigorous tracking.
For teams building this capability, start small: add a randomized holdout, log detailed events, and pilot a conservative bandit on a non-critical funnel. If the results look promising, expand targeting and keep a permanent control cohort to guard against drift. If infrastructure or analytics is a bottleneck, consider an AI content automation partner like Scaleblogger.com to content delivery and measurement workflows.
Conclusion
View A/B testing as a skill, not just a task: begin with clear hypotheses, ensure tracking is reliable even during site changes, and run sufficient traffic for trustworthy decisions. When teams run simple headline and CTA variants alongside structural experiments—content optimization for funnel pages and performance benchmarking across segments—they often uncover patterns that repeatedly lift engagement. Short answers to common questions: run tests long enough to hit your pre-defined sample targets, track the metrics tied to your business goal (conversion, time on page, revenue), and promote a variant only after it proves durable across segments.
Make the next move concrete. ** For teams looking to automate experiment documentation, reporting, and scaling content variants, platforms that integrate testing workflows can save hours each week. com) as one option to those steps and free the team to design smarter tests.
Keep testing thoughtfully, iterate on what the data actually shows, and treat every winning variant as a hypothesis for the next round.
