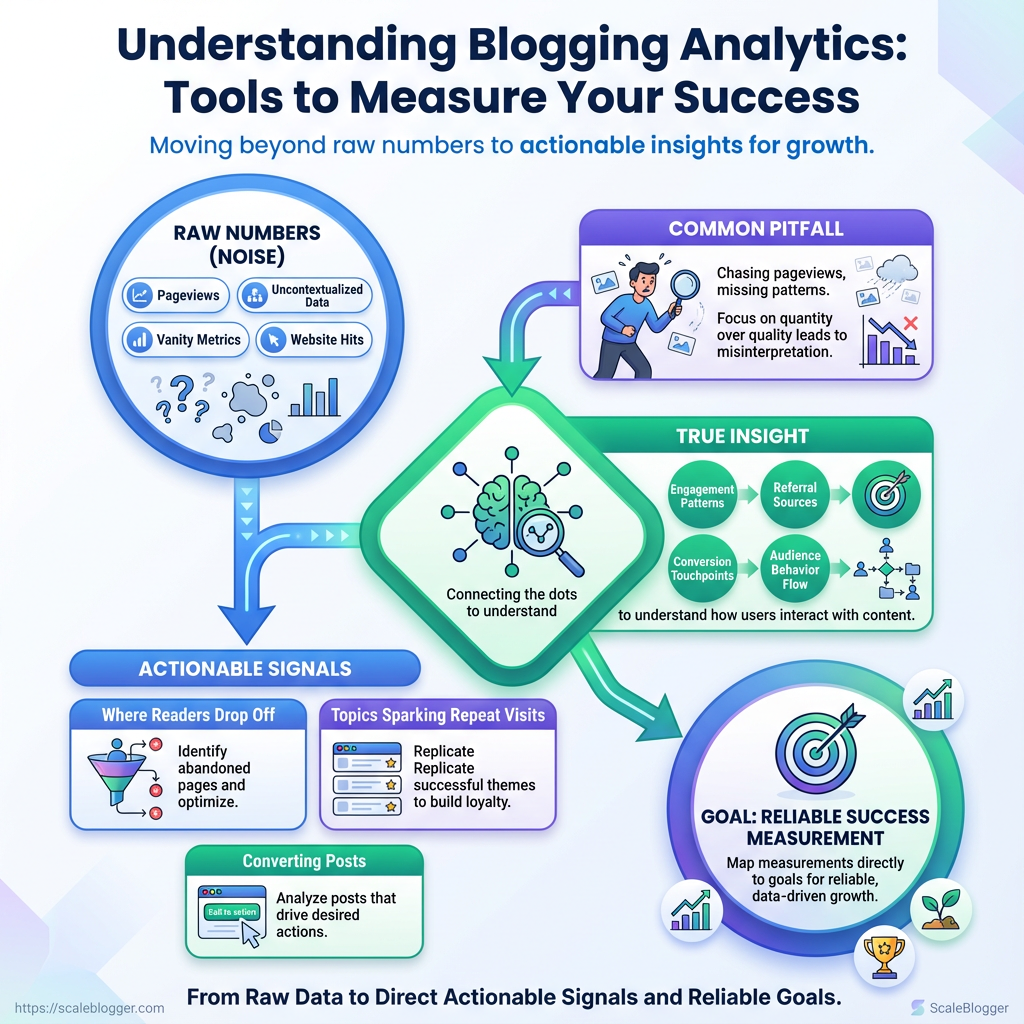
You publish consistently, tweak headlines, and still can’t tell which posts actually move the needle — just a jumble of pageviews and guesses. Blogging analytics should turn that noise into signals, not add another spreadsheet to your to-do list.
Most teams confuse raw numbers with insight: chasing pageviews while missing engagement patterns, referral sources, and conversion touchpoints that truly show how you’re able to track blog performance. The right tools reveal where readers drop off, which topics spark repeat visits, and which posts convert casual visitors into subscribers.
Start by choosing measurements that map directly to goals so you can reliably measure blog success without second-guessing. Try Scaleblogger to automate blog analytics workflows
What You’ll Need (Prerequisites)
Start by getting the basic accounts, permissions, and a tiny technical setup out of the way — this prevents bottlenecks once you begin measuring and optimizing blog performance. At minimum, secure the right account access, install tracking snippets cleanly, and confirm someone on the team can read analytics and manipulate simple spreadsheets. Those three things unlock almost every useful insight from blogging analytics tools and let you move from noise to actionable trends.
- Account names & permissions: Make sure you’ll have an email tied to the business Google Workspace, or a stable account the team agrees to use for analytics and search tools.
- Technical setup items: Prepare to add
GA4measurement ID, a Google Search Console verification token, and optionally a Google Tag Manager container snippet to the site header. - Skills required: Someone needs comfort with basic analytics concepts (sessions, events, conversion), and spreadsheet skills sufficient to write simple
SUM,IF, and pivoting.
Google Analytics 4: A property created and connected to the site; measurement ID (format G-XXXXXXX) available.
Google Search Console: Verified ownership of the site (DNS or HTML verification), access to performance reports and URL inspection.
Tag Manager (optional): Container ID (format GTM-XXXXXX) if you prefer tag management and non-developer snippet updates.
CMS admin access: Admin-level login to your content management system for adding scripts to the header or installing plugins.
Spreadsheet & basic formulas: Access to Google Sheets or Excel and ability to use basic formulas and create pivot tables.
- Confirm who will own each account and add them with the minimum permission set required.
- Add the tracking snippets to your site header or via Tag Manager.
- Verify Search Console ownership and link it to GA4 where possible.
Practical tips
Use a shared credential manager or Google Workspace group address for long-term stability. If deploying tags via Tag Manager, keep one naming convention for events (e.g., blog_read_time, cta_click) to avoid analysis friction later. When testing the tracking, open a private browser tab and check real-time reports to validate hits.
Summarize prerequisites, why they matter, and minimum setup time
| Prerequisite | Why it’s needed | Minimum access/skill | Estimated setup time |
|---|---|---|---|
| Google Analytics 4 | Core traffic, engagement, and conversion metrics | Editor access to GA4; basic analytics literacy | 15–45 minutes |
| Google Search Console | Search performance, indexing, and query data | Site verification ability; understand clicks/impressions | 10–30 minutes |
| Tag Manager (optional) | Easier event deployment and version control | Container admin; basic tag/event logic | 30–60 minutes |
| CMS admin access | Install snippets or plugins and troubleshoot rendering | CMS admin; ability to edit header/theme files | 10–30 minutes |
| Spreadsheet & basic formulas | Aggregate, analyze, and visualize exports from tools | Comfortable with SUM, IF, pivot tables |
30–90 minutes |
Key insight: These five prerequisites cover identity, measurement, deployment, and analysis. Getting them right up front typically removes 80% of the common blockers when tracking blog performance with blogging analytics tools.
If the team wants to accelerate setup and automate reporting, Scaleblogger.com provides AI-powered pipelines that link these exact prerequisites into repeatable workflows. Having these basics in place usually means quick wins within the first week rather than months of chasing data.
How to Set Up Core Tracking (Step-by-step)
Start by prioritizing a clean, testable tracking foundation: a verified GA4 property, a connected Search Console, and a Tag Manager container that fires reliable events. This setup makes blog performance measurable, repeatable, and easy to troubleshoot when traffic or conversion signals shift.
Google account: Active account with owner access to the site and DNS or hosting access for verification.
Site access: Ability to edit head template or install a Tag Manager container in your CMS.
Tools & materials
Google Analytics 4 (GA4): For event-driven analytics. Google Search Console (GSC): For search performance and sitemap coverage. Google Tag Manager (GTM): For centralized tag and event management. A staging site or GTM preview mode: For safe testing.
Install and verify Google Analytics 4
- Create a GA4 property and add a data stream for your website in the Google Analytics UI.
- Copy the
Measurement ID(looks likeG-XXXXXXXXXX) from the data stream. - If using Tag Manager: create a new
GA4 Configurationtag, paste theMeasurement ID, set trigger toAll Pages, save and publish. - If using CMS header: paste the GA4
gtag.jssnippet into the siteheadtemplate and deploy. - Verify installation by opening GA4
Realtimeand visiting your site in an incognito tab; you should see your active user appear within seconds.
Configure Google Search Console and sitemaps
- Add your site to GSC and verify ownership — DNS TXT is most robust; HTML file upload works if you control hosting.
- In GSC, submit
https://yourdomain.com/sitemap.xmlfrom the Sitemaps panel. - Check
Coverageafter 24–72 hours and resolve anyExcludedpages caused bynoindexor crawl errors. - Enable Search Console email alerts so crawl issues surface quickly.
Tag Management and event tracking
- Identify priority events to track (start small: pageviews, scrolls, CTA clicks, signups, outbound clicks).
- Create tags and triggers in GTM:
- Add
GA4 Eventtags for each event. - Use triggers such as
Click - All Elements,Scroll Depth, or custom DOM-ready variables. - Test with GTM Preview and validate event payloads appear in GA4 DebugView with expected parameters like
link_url,scroll_percent, andnewsletter_source. - Once validated, publish the GTM container and monitor event counts in GA4 before mapping to conversions.
Common event types, why track them, and recommended triggers
| Event Type | Why Track | Recommended Trigger | Conversion Mapping |
|---|---|---|---|
| Page View | Baseline engagement metric | All Pages trigger | No (baseline) |
| Scroll Depth | Measures content consumption | Scroll Depth 50% / 75% | Micro-conversion |
| CTA Click | Measures interaction with CTAs | Click – All Elements with CSS selector | Primary or micro |
| Newsletter Signup | Lead capture effectiveness | Form Submission or DOM Element visibility | Primary conversion |
| Outbound Link Click | Referral/resource effectiveness | Click – Just Links with target="_blank" |
Micro-conversion |
Key insight: Tracking a mix of engagement and conversion events gives a clearer funnel picture — pageviews show reach, scrolls show content resonance, and clicks/signups map to business outcomes. Prioritize events that map to revenue or lead-generation and validate payloads in GTM Preview and GA4 DebugView before publishing.
Putting these pieces together gives reliable, actionable signals about what content actually moves readers toward your goals. With GA4, GSC, and GTM wired correctly, measuring blog performance becomes a repeatable process that surfaces where to focus optimization next.
Essential Metrics to Track (Step-by-step)
Start by focusing on the metrics that directly show whether content is attracting the right people, keeping them engaged, and driving business outcomes. Track acquisition first, then layer engagement signals, then tie those to conversions so every optimization has a measurable ROI.
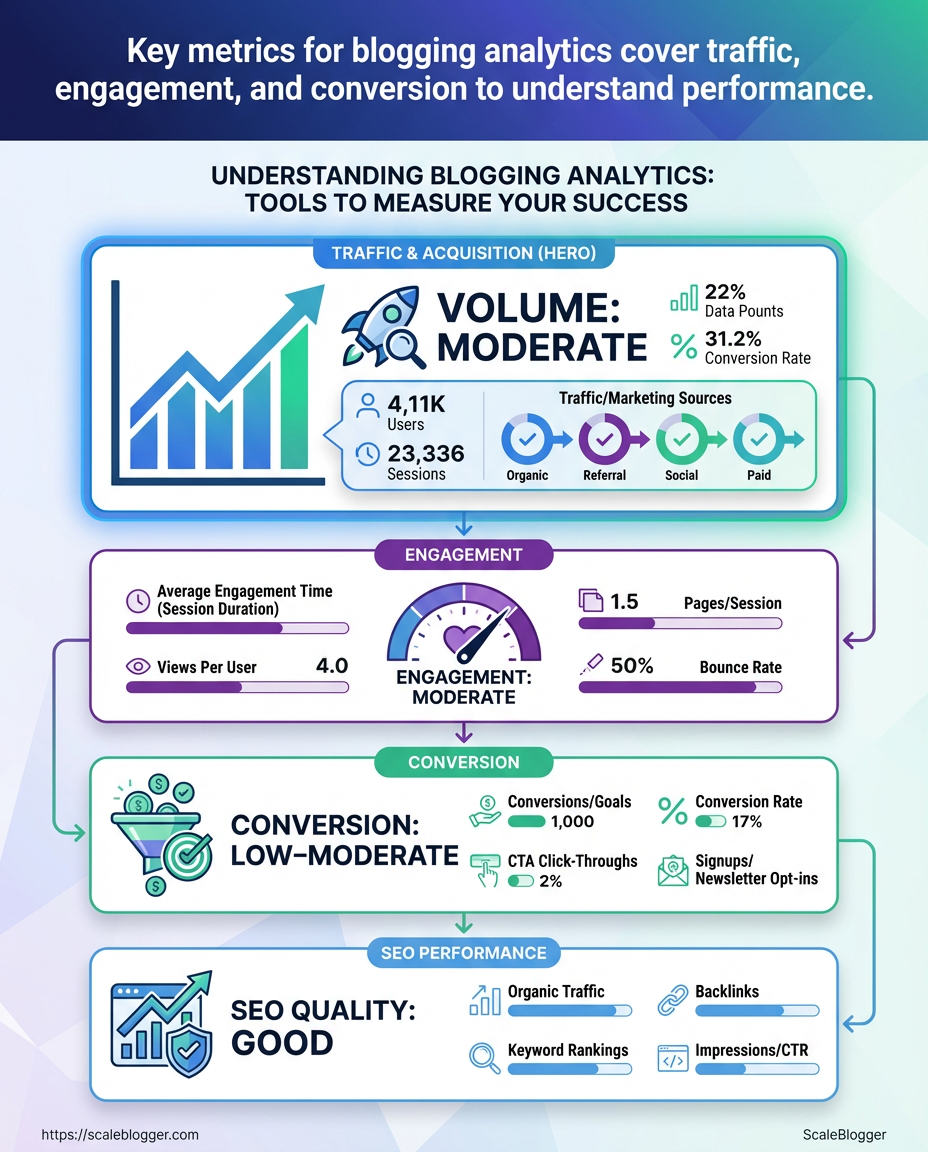
Traffic & Acquisition Metrics
Users: Total unique visitors over a period. Sessions: Visits (useful for trend comparisons). Source/Medium: Where traffic came from (google/organic, newsletter/email). Campaign: Identify UTM-tagged campaigns.
- Open your analytics acquisition reports and filter by
Source/MediumandCampaign. - Segment by organic, referral, social, and paid channels to spot shifts quickly.
- When channel traffic drops, check landing-page-specific metrics and recent tag/CMS changes before assuming SEO loss.
Actionable responses: Traffic dip from organic: Run a quick SERP and index check, refresh title/meta, and audit recent backlinks. Social spike with low time-on-page: Improve above-the-fold content and internal links to deeper posts. * Paid campaigns underperforming: Review landing page relevance and UTM correctness.
Engagement & Content Metrics
Measure engagement to decide which posts to double down on and which to prune.
Average time on page: Reader attention length. Scroll depth: How far users read. Bounce rate / engaged sessions: Quality of visits. Pages per session: Depth of exploration.
Sample custom report configuration:
Prioritization matrix: metrics → recommended action for content
| Metric Condition | Interpretation | Recommended Action | Expected Impact |
|---|---|---|---|
| High traffic, high engagement | Content resonates and attracts relevant users | Scale with topic cluster and internal links | Increased conversions and organic growth |
| High traffic, low engagement | Headlines or referrals attracting wrong intent | Update intro, clarify intent, add TL;DR and links | Better retention, lower bounce |
| Low traffic, high engagement | Niche but valuable content | Promote via newsletters and internal linking | Traffic lift with strong conversion potential |
| Low traffic, low engagement | Content underperforming on both fronts | Either rewrite for intent or retire/merge | Frees resources for higher ROI pieces |
| High conversions, low traffic | Small audience drives results | Amplify via paid and SEO optimizations | More leads with similar conversion rate |
Key insight: This matrix turns raw metrics into prioritized actions—promote winners, fix misaligned pieces, and consolidate weak performers.
Conversion & Revenue Attribution
Conversion event: A tracked action (newsletter signup, demo request). Goal: Business outcome tied to an event. UTM standard: utm_source, utm_medium, utm_campaign, utm_term, utm_content.
- Define and instrument conversion events with consistent naming.
- Apply strict UTM rules across campaigns to keep attribution clean.
- Use multi-channel attribution reports to see blog influence on assisted conversions; treat last-click as a quick check, not the whole truth.
Tie conversions back to content by mapping landing pages to conversion paths and reporting on assisted conversions monthly. Tools like Scaleblogger.com can automate parts of this pipeline and surface content-to-revenue links. Tracking these three layers makes optimization decisions evidence-based and repeatable.
How to Build a Blog Analytics Dashboard (Step-by-step)
Start by picking the handful of metrics that actually move the business needle, then wire reliable data sources to them and validate every calculated metric. The right dashboard reduces guesswork: it shows whether content drives traffic, keeps readers engaged, and converts into leads. Below is a practical, sequential way to go from KPI selection to a tested dashboard you can trust.
Access to GA4: Viewer or Editor rights for the property you’ll pull metrics from.
Search Console access: Permission to export search performance for landing pages and queries.
CRM export permission: Ability to export lead records or connect via API.
Tools & materials
Dashboard tool: Looker Studio or equivalent with connectors for GA4 and Search Console. Spreadsheet: Google Sheets for staging and lightweight calculations. Account credentials: Service account or OAuth ready for connectors.
Map KPIs to data sources and refresh cadence
| KPI | Data Source | Update Frequency | Why it matters |
|---|---|---|---|
| Organic Users | GA4 | Daily | Measures organic reach and top-of-funnel growth |
| Average Engagement Time | GA4 | Daily | Signals content relevance and depth of attention |
| Blog-sourced Leads | CRM export / GA4 conversions | Daily to weekly | Tracks bottom-of-funnel impact from content |
| Top Landing Pages | Search Console + GA4 | Daily | Reveals which pages rank and drive clicks |
| CTA Conversion Rate | GA4 events / CRM export | Daily | Shows how well CTAs convert readers into leads |
Key insight: Mapping KPIs to specific sources prevents later confusion about where a number came from and sets expectations for data latency. Use GA4 for behavioral metrics, Search Console for search visibility, and CRM exports for revenue or lead validation.
- Define KPIs and map to outcomes.
- Assign each KPI to a primary data source and a fallback source.
- Create a connector plan: which APIs, service account, and refresh cadence.
- Build the dashboard skeleton: title, date range control, and top-line KPIs.
- Add charts and tables: time series for trends, bar table for landing pages, and a segment filter (organic traffic only).
- Create calculated metrics:
Blog Conversion Rate = blog_signups / organic_usersand test with sample data. - Configure filters and segments:
Traffic Source = organic,Page Path contains /blog/. - Validate against raw exports: reconcile totals for users, sessions, and leads.
Connector setup and permissions matter early. Create a service account for Looker Studio or grant OAuth to the dashboard owner, then ensure GA4 and Search Console APIs are enabled. When building calculated metrics, keep formulas simple and document them in a notes pane. Testing should include at least three checks: match daily totals with GA4 export, compare landing page clicks with Search Console, and reconcile leads with CRM exports.
If wiring automation, consider linking with Scaleblogger.com for content performance benchmarking and automated reporting. A clean, validated dashboard saves hours of manual checking and turns content data into repeatable decisions.
Operational Workflow: Weekly and Monthly Tracking Routine (Step-by-step)
Start the week by looking for signs that something changed — traffic dips, sudden keyword rank shifts, or campaign CTR drops — then prioritize fixes that protect ranking and conversions. The cadence below keeps checks light and repeatable so the team can spot anomalies early and reserve deep analysis for monthly and quarterly cycles.
Weekly Checks: fast anomaly detection and top-content review
- Check baseline metrics (daily sessions, conversions, bounce) in
GA4and compare to the previous week. - Run a quick content snapshot:
- Top-performing posts: Review top 10 by sessions; note any new entrants.
- Engagement flags: Identify posts with >20% drop in avg. time on page.
- Traffic source shifts: Spot if organic vs paid mix changed.
- Campaign performance snapshot:
- Paid campaigns: Confirm spend pacing and CPA vs target.
- Email sends: Check open and click rates; pause poorly performing variants.
- Social posts: Note posts that over/under-perform and save creative for reuse.
- Quick action log: open issues get a 48–72 hour owner and a single-sentence remediation plan.
Tools & materials
Analytics platform: GA4 or equivalent.
Content list: Export of top 100 posts by traffic.
Owner: Content ops lead or growth marketer.
Monthly and Quarterly Deep Dives: funnels, cohorts, and experiments
- Monthly funnel and cohort analysis:
- Traffic-to-lead: Measure conversion rates by channel and landing page.
- Cohort retention: Track first-month engagement of new organic cohorts.
- Content origin: Map top-converting posts to intents and traffic sources.
- Quarterly experiment planning:
- Hypothesis template: If we optimize X (title + CTA) for intent Y, then conversion will increase Z%.
- Design: A/B variant, sample size estimate, success metric, and run length.
- Prioritization: Use ICE (impact, confidence, ease) scores.
- Archive and repurpose underperformers:
- Archive criteria: posts with <100 sessions/mo and no backlinks.
- Repurpose options: merge with related post, convert to pillar section, or refresh with new data.
Include automation where possible — scheduling weekly exports and setting alert thresholds reduces manual busywork. For teams scaling content pipelines, tools like Scaleblogger.com help automate scheduling, scoring, and repurposing at scale.
Weekly/Monthly/Quarterly tasks with estimated time and owner
| Cadence | Task | Estimated Time | Recommended Owner |
|---|---|---|---|
| Weekly | Baseline metric check & anomaly log | 30 minutes | Content Ops Lead |
| Bi-weekly | Top-content creative review | 45 minutes | Content Editor |
| Monthly | Funnel & cohort deep-dive report | 3 hours | Growth Analyst |
| Quarterly | Experiment planning + prioritization | 4 hours | Head of Growth |
| Ad-hoc analysis | Backlink or technical SEO audit (triggered) | 2–6 hours | SEO Specialist |
Key insight: A tight weekly loop prevents small problems from becoming larger failures, while monthly and quarterly reviews allocate time for meaningful improvements — experiments, repurposing, and funnel fixes — that actually move business metrics.
Keeping this routine consistent makes performance predictable and decision-making faster; treat weekly checks as health triage and monthly/quarterly work as surgery.
Troubleshooting Common Issues
Start by assuming the data pipeline is honest but noisy: missing or zero data usually points to implementation gaps, duplicated events come from double-firing or multiple tagging layers, and bad interpretation comes from mixing UA and GA4 concepts. Work methodically: confirm collection, validate processing, then re-check reports before acting on insights.
Common Tracking Failures and Fixes
- Check for missing or zero data
- Stop and confirm the tracking snippet is present on the page and firing.
- Use the browser console or
chrome://inspectand theNetworktab to look forcollectorg/collectcalls; if nothing appears, there’s an implementation gap. - If events exist in debug view but not in reports, inspect filter and data retention settings in the property.
- If a tag manager is used: verify containers aren’t published with paused triggers.
- If migrations happened: confirm measurement IDs match the environment (
devvsprod). - If single-page app: ensure
history.pushStateor virtual pageviews are instrumented.
- Resolve duplicate or inflated event counts
- Identify events firing more than once using the real-time or debug stream.
- Trace the source: duplicate triggers in Tag Manager, inline scripts plus GTM, or analytics plugins on CMS themes.
- Remove redundant listeners or add guards like
if (window.hasFired) return;around event code. - Filter spam and bot traffic
- Enable known bot filtering: Turn on bot filtering where available and exclude traffic by suspicious hostname.
- Use server-side filtering: Route events through a validation layer to drop obvious spam before they land in GA4.
- Apply hostname and referrer rules: Exclude hits where the hostname isn’t your domain or referrer looks malicious.
Data Quality and Interpretation Errors
Clarify metric definitions and common misinterpretations
| Metric | GA4 Definition | Common Misinterpretation | Quick Check |
|---|---|---|---|
| Users | Distinct user identifiers (device+ID signals) deduplicated over time | Treated as exact people rather than device/ID approximations | Compare Total users vs New users and check user_id implementation |
| Sessions | Grouped user interactions within a timeframe (session_start events) | Assuming UA session rules — GA4 sessions are started differently | Look for session_start events in debug stream |
| Engagement Time | Time the app/page was in foreground and had activity | Interpreting as precise dwell time like UA’s time on page | Verify user_engagement events and compute averages carefully |
| Bounce Rate | Not native in GA4; often derived from engagement metrics | Using UA-style bounce rate leads to misleading comparisons | Use engagement_rate inverse or configure a comparable metric |
| Conversions | Events marked as conversion in GA4 | Expecting UA goal behavior without checking event parameters | Confirm event naming and that events are toggled as conversions |
Validation checklist before decisions
- Check implementation: Confirm measurement IDs, GTM containers, and SDK versions.
- Verify schema: Ensure event names and parameters match reporting queries.
- Reconcile environments: Compare dev/stage/prod to rule out environment leakage.
If debugging gets tedious, consider automating validation and monitoring; Scaleblogger.com offers pipelines that surface tracking drift and alert on anomalous metric changes. Fixing tracking issues quickly protects decision quality and keeps content strategy grounded in reality.
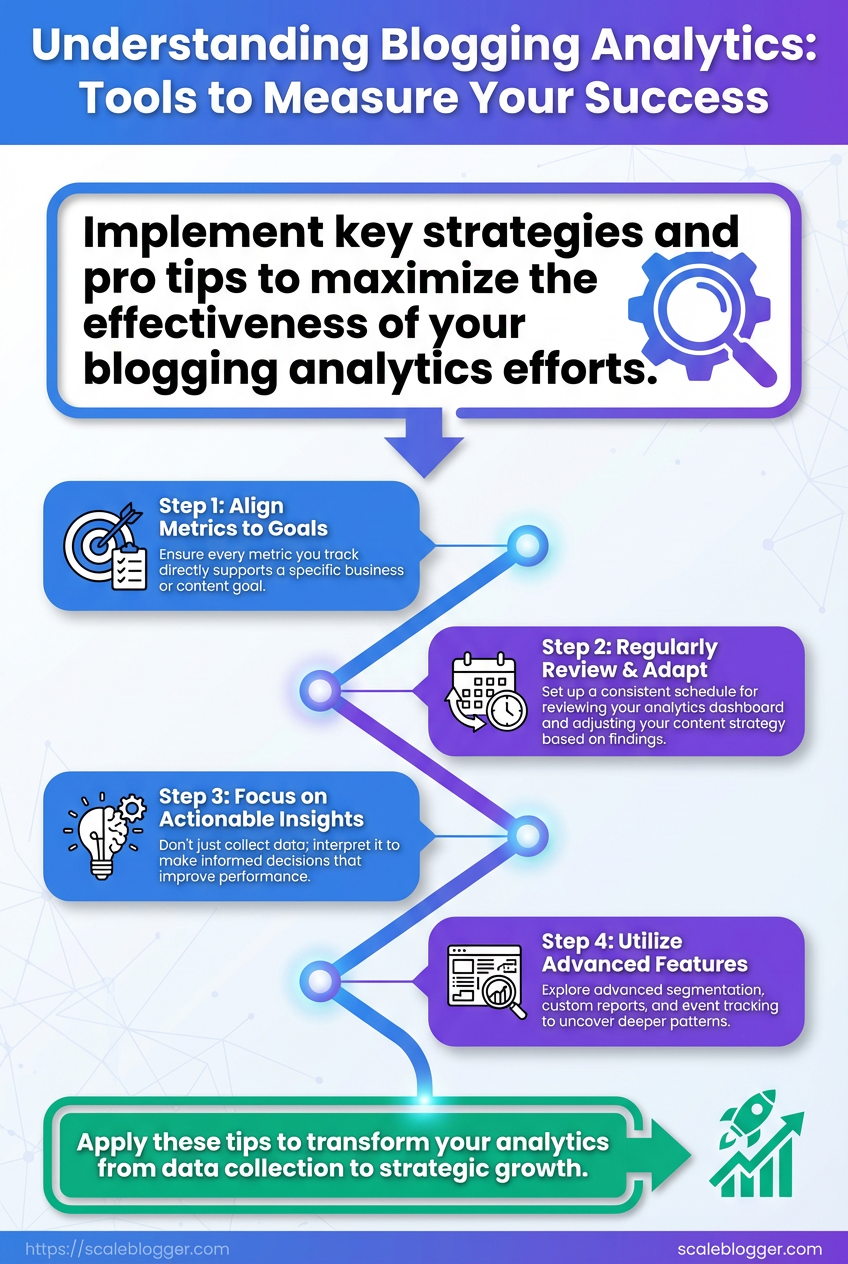
Tips for Success & Pro Tips
Start by treating measurement and automation as products: design them, iterate, and guard them against entropy. Consistent tracking plus fast anomaly detection is what separates guesswork from reliable growth signals.
Practical UTM naming conventions and enforcement
UTM policy: Use a single canonical pattern for all campaigns to avoid split metrics. Example pattern: utm_source, utm_medium, utm_campaign, utm_term, utm_content.
- Consistent casing: Use all lowercase.
- Delimiter rule: Use hyphens (
-) not underscores (_) for multiword values. - Campaign granularity: Keep
utm_campaignhigh-level and useutm_contentfor variants.
- Create a shared
utmtemplate document and store it in your CMS. - Add a pre-publish checklist item that verifies UTM use.
- Enforce via automation — see automation tips below.
Automation and alerts for anomalies
Automation scales vigilance. Push common checks into scheduled jobs and alert on deviations so human attention goes where it matters.
- Automated validation: Run a daily scan to catch missing or malformed
utmparameters. - Anomaly alerts: Trigger alerts for sudden drops or spikes in key metrics (pageviews, conversions).
- Contextual routing: Send anomalies about organic traffic to the SEO owner, and paid-traffic anomalies to the ads manager.
- Set up a lightweight monitoring rule that compares a rolling 7-day average versus the previous period.
- Configure alerts with a short description, suspected cause, and first-action checklist.
- Triage and annotate incidents in your analytics workspace to train future detection.
Test-and-learn approach to content changes
Testing reduces risk and builds conviction. Run small experiments, measure impact, then scale winners.
- Hypothesis-first: State the expected user behavior change before publishing.
- A/B small batches: Test headline or intro changes on 10–20% of traffic.
- Measure engagement: Track dwell time, scroll depth, and conversion rate together, not alone.
- Define success metrics and minimum detectable effect.
- Run the variant for a statistically sensible period (or until minimum sample size reached).
- Promote winning variants site-wide and document learnings.
Practical tooling and workflow
- Use templated checks: Store UTM templates and checklist items in your content workflow.
- Automate alerts: Use your analytics platform or an automation layer to notify the right owner.
- Benchmark regularly: Compare performance across content clusters to spot systemic issues.
For content teams, these practices reduce measurement noise and speed decisions. Follow them consistently and the signal-to-noise ratio in your blog analytics will improve noticeably.
📥 Download: Blogging Analytics Setup Checklist (PDF)
Appendix: Templates, Checklists & Resources
This appendix collects ready-to-use templates and checklists to speed up analytics, experiments, and content testing. Each template includes what it contains, how to import and customize, and a realistic time estimate so you can decide which to deploy first.
Google Analytics / GA4 account: Access to GA4 property and export permissions.
Spreadsheet access: Google Drive (Sheets/Docs) or equivalent.
Basic naming conventions: A short style guide for event and campaign names.
What each template contains and how to customize
Blog Analytics Dashboard (Looker Studio) Contains: pre-built charts for sessions, users, engagement rate, top posts, and UTM performance. How to import: open the Looker Studio template, connect to GA4 and your CSV for content metadata. Customize: swap date ranges, add segments, or replace charts with custom calculated metrics. Time to implement: ~45–90 minutes.
Event Naming Standard (CSV) Contains: columns for event_category, event_action, event_label, version. How to import: copy into your tracking plan and push to dev for GTM rules. Customize: add channel-specific suffixes or team prefixes. Time to implement: ~20–40 minutes.
Weekly Analytics Checklist (Google Sheet) Contains: checks for traffic anomalies, top referrers, content friction points, and A/B test status. How to import: duplicate sheet and set view-only permissions for stakeholders. Customize: add rows for platform-specific checks (e.g., newsletter opens). Time to implement: ~15–30 minutes.
UTM Builder (Spreadsheet) Contains: standardized UTM field inputs, auto-generated URLs, and validation rules. How to import: duplicate and use =CONCAT() formulas to assemble links. Customize: pre-fill campaign naming patterns and channel lists. Time to implement: ~10–20 minutes.
Experiment Hypothesis Template (Doc) Contains: hypothesis statement, primary metric, success criteria, sample size estimate, and rollout plan. How to import: copy to your docs folder and attach to tracking tickets. Customize: add risk assessment or rollback steps. Time to implement: ~10–25 minutes.
Inventory of templates and how to use them
| Template | Purpose | Format | Estimated Setup Time |
|---|---|---|---|
| Blog Analytics Dashboard (Looker Studio) | Visualize GA4 metrics, engagement, top content | Looker Studio report | 45–90 minutes |
| Event Naming Standard (CSV) | Consistent tracking across teams and tools | CSV | 20–40 minutes |
| Weekly Analytics Checklist (Google Sheet) | Routine checks to catch issues early | Google Sheet | 15–30 minutes |
| UTM Builder (Spreadsheet) | Create validated campaign links | Google Sheet | 10–20 minutes |
| Experiment Hypothesis Template (Doc) | Structure A/B tests with clear success metrics | Google Doc | 10–25 minutes |
Key insight: This inventory prioritizes fast wins (UTM builder, hypothesis doc) that minimize setup friction while the dashboard gives continuous value once connected. Start with naming and UTM discipline to ensure your tracking feeds actionable data into the dashboard and checklists.
Practical steps to get started
- Duplicate the UTM Builder and Event Naming CSV into your workspace.
- Run one content campaign using the UTM template and log results in the Weekly Analytics Checklist.
- Connect
GA4to the Blog Analytics Dashboard and validate one week of data.
For teams looking to automate the pipeline end-to-end, consider integrating an AI content automation platform like AI content automation to generate topic clusters and predict performance before publishing. These templates bridge the gap between measurement and action so tracking blog performance becomes an operational habit, not an afterthought.
Conclusion
You’ve gone from noisy pageview numbers to a repeatable workflow: pick the right metrics, wire up clean tracking, and review a focused dashboard weekly and monthly. That shift—tracking engagement quality, attribution paths, and conversion lift—turns guesswork into decisions. Remember the small team that re-prioritized three posts after A/B headline tracking and doubled leads from blog traffic; that’s the kind of return consistent measurement delivers. If data looks messy or results lag, start by validating event definitions and comparing a single post’s funnel end-to-end—often the problem is measurement, not the content.
Move forward with two clear actions: audit your current tracking this week and build a one-page dashboard that answers whether a post moves prospects. For teams wondering how quickly they’ll see impact, evidence suggests one month of clean weekly reviews surfaces meaningful trends; for messy data, expect a short cleanup sprint first. To streamline this process, platforms like Try Scaleblogger to automate blog analytics workflows can automate repetitive pulls and alert you to signal changes. For deeper reading on specific setup patterns, see undefined. Start small, iterate, and let tracking guide which posts earn more promotion and which deserve retirement.
