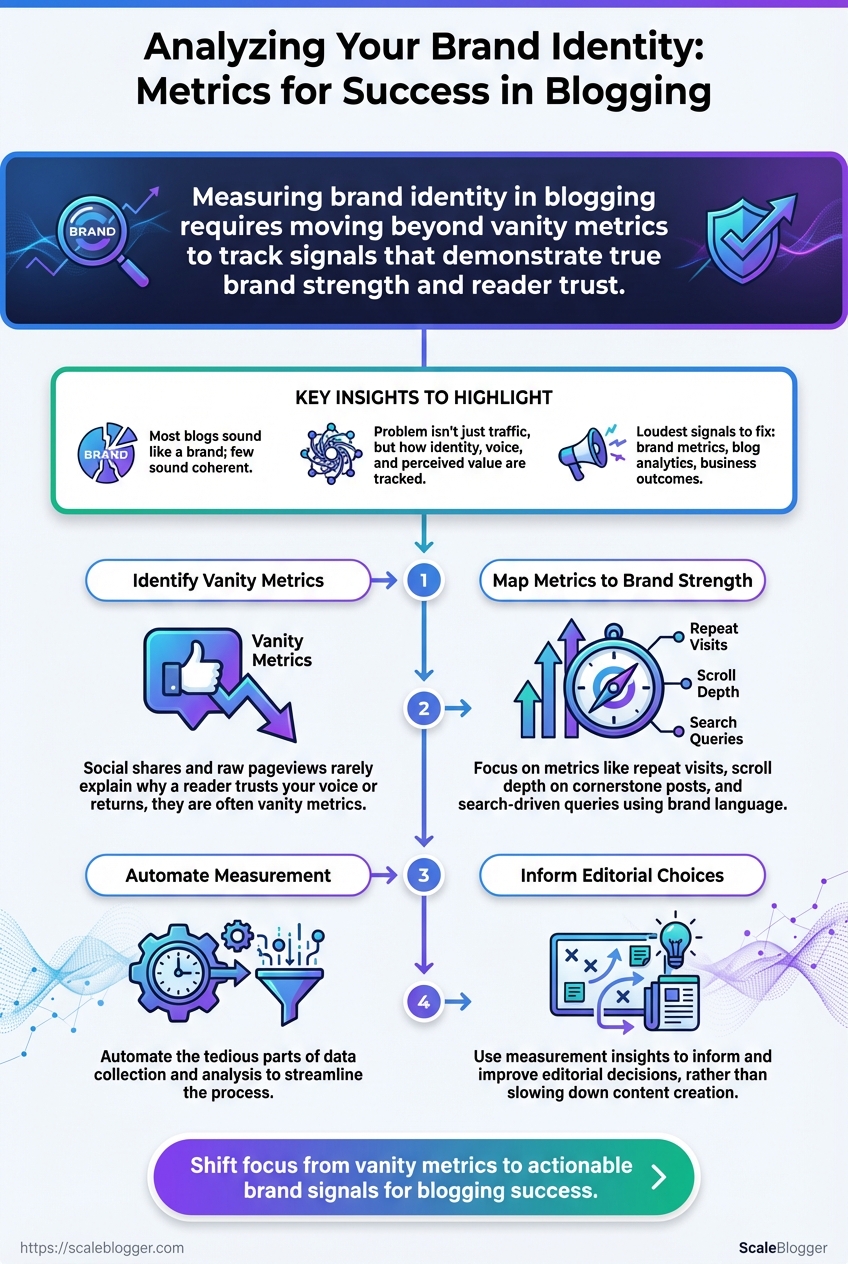
Most blogs sound like a brand because they publish regularly; few sound like a coherent brand because they measure what matters. When readers hesitate at your headline or bounce after two paragraphs, the problem isn’t traffic alone — it’s how you track identity, voice, and perceived value. The loudest signals to fix first are brand metrics, blog analytics, and the signals that tie them to real business outcomes.
Start by separating vanity from signal: social shares and raw pageviews rarely explain why a reader trusts your voice or returns. Instead, map metrics to moments that prove brand strength — repeat visits, scroll depth on cornerstone posts, search-driven queries using your brand language — and watch which content choices reinforce recognition.
Automate the tedious parts so measurement informs editorial choices rather than slowing them down. Automate your blog analytics and brand measurement with Scaleblogger (https://scaleblogger.com)
What You’ll Need (Prerequisites & Tools)
Start by ensuring the analytics and content foundations are in place — without clean data and a single content inventory, automation and measurement break down quickly. The essentials below are practical: account access, exportable content records, and lightweight technical skills so teams can map content to metrics and iterate.
Google Analytics 4 configured: A GA4 property with site data and basic events (page_view, conversions) mapped.
Google Search Console verified: Ownership verified for the domain so you can pull query, page, and indexing data.
Social platform analytics access: Admin or analyst access to Meta/Instagram Insights, LinkedIn Page Analytics, and X/Twitter Analytics.
Content inventory export (CSV): A spreadsheet with URL, title, publish date, category, primary keyword, internal links, and performance columns.
Basic spreadsheet skills: Comfort with filters, pivot tables, VLOOKUP/XLOOKUP, and simple formulas.
Tools & accounts to provision now
- Set up tracking: Ensure
gtag.jsorGoogle Tag Manageris deployed and firing on all pages. - Grant read/write access: Provide analysts with Viewer/Editor roles in GA4 and GSC, and Page Analyst roles on social platforms.
- Export formats: Request CSV/Excel exports for all dashboards so they can be merged into a master workbook.
- Content mapping: Use the inventory to tag content by intent and funnel stage before importing into any automation pipeline.
- Audit accounts in this order: GA4 → Search Console → Tag manager → Social analytics.
- Export a full content CSV and keep a dated snapshot for versioning.
- Share a single spreadsheet with controlled edit permissions.
Practical tip: When automating, map each content URL to a unique ID in the CSV so downstream systems (CMS, scheduling tools, AI pipelines) can reference the same key.
Essential analytics tools and why they’re needed for brand metrics
| Tool | Primary Use | Pro | Con |
|---|---|---|---|
| Google Analytics 4 | Site behavior, conversions, user journeys | Event-driven analytics, free | Learning curve; setup sensitive to tagging errors |
| Google Search Console | Search queries, indexing, CTR | Direct search query data, indexing issues | No click-level user behavior |
| Meta Insights (Facebook/Instagram) | Social engagement & ad metrics | Native ad metrics, audience breakdown | Platform-specific metrics, export limits |
| X/Twitter Analytics | Tweet performance, impressions | Real-time engagement signals | Limited historical exports |
| LinkedIn Analytics | B2B audience, engagement, leads | Strong for professional audiences | Less granular session data |
| Screaming Frog | Site crawl, SEO issues, redirects | Deep technical crawl, many export options | Desktop app; license for large sites |
| Ahrefs | Backlink profile, keyword research | Robust backlink index, keyword difficulty | Paid plans start higher |
| SEMrush | Keyword research, site audit, competitive intel | All-in-one SEO suite, reporting | Can be expensive at scale |
| Optimizely | A/B testing & personalization | Enterprise-grade experimentation | Costly for smaller teams |
| VWO | A/B testing, heatmaps | Easier onboarding for mid-market | Fewer integrations than Optimizely |
| Hotjar | Heatmaps, session recordings | Qualitative behavior insights | Sample-based; privacy considerations |
| Google Tag Manager | Tag management, event wiring | Centralized tag control, free | Misconfigurations cause data issues |
Key insight: These tools cover measurement, search visibility, social signal capture, technical SEO, qualitative behavior, and experimentation — the combination needed to track brand metrics effectively and feed automated content workflows.
Understanding these prerequisites and provisioning the right accounts removes the most common friction points when building an AI-powered content pipeline. When teams come equipped with a clean inventory and proper access, implementation moves faster and measurement stays reliable.
Define Brand Identity Goals and Signals
Start by turning brand adjectives into precise, trackable signals. Vague attributes like trustworthy or authoritative are useless unless translated into metrics teams can measure and improve. Define 3–5 core attributes, map each to measurable signals, capture current baselines, and set realistic target thresholds you can review monthly.
Translate attributes into signals (practical examples)
Attribute — Trustworthy
- Audience signal: percentage of repeat visitors from organic search
- Engagement signal: average time on page for cornerstone content
- Conversion signal: email sign-up rate on resource pages
Attribute — Authoritative
- Audience signal: number of external domains linking to pillar posts
- Engagement signal: share-to-view ratio across social platforms
- Performance signal: average SERP position for topic cluster keywords
Attribute — Helpful / Practical
- Engagement signal: scroll-depth >50% on how-to articles
- Conversion signal: resource downloads per 1,000 sessions
- Feedback signal: user-rated usefulness in on-page surveys
Attribute — Distinctive Voice
- Content signal: percentage of content pieces using brand lexicon
voice_tag - Engagement signal: comment sentiment score on opinion pieces
Step-by-step process to operationalize signals
- Select 3–5 brand attributes and document short definitions and business rationale.
- For each attribute, list 2–3 measurable signals (qualitative signals become proxies like sentiment score).
- Record baseline values using analytics: organic sessions, backlinks, time-on-page, conversion rates.
- Set target thresholds with timelines (example: increase backlinks to pillar posts by 40% in 12 months).
- Assign owners and reporting cadence (weekly dashboard, monthly review).
Measurement examples and practical notes
- Baseline example: Cornerstone article average time-on-page = 2:10 — target = 3:30 in 6 months.
- Tracking tip: Use
UTMtagging consistently to separate branded vs. non-branded traffic. - Tool suggestion: Automate dashboards to surface the signals; consider integrating an AI content pipeline to score content against brand signals (for example, Scaleblogger.com for automated content scoring and scheduling).
Trustworthy: A measurable, repeatable definition prevents debate and speeds decisions.
Defining signals this way turns brand strategy into operational work the team can execute and measure. When implemented, teams make consistent editorial choices without endless meetings.
Collect and Structure the Data
Begin by exporting canonical metrics from each data source and shaping them into a single, comparable dataset. Export the exact GA4 reports below, pull query-level data from Search Console to separate branded vs non-branded traffic, and combine social and CMS exports so every row represents one post with uniform columns. Normalization happens after collection so comparisons are fair across time, channel, and content types.
Which GA4 reports to export and why
- Export
Engagement > Pages and screensfor page-level metrics likepageviews,average_engagement_time, andreturning_users. - Export
Acquisition > User acquisitionto capture traffic source attribution per landing page. - Export
Eventsfor tracked interactions such asnewsletter_signuporcta_clickto measure on-page success.
How to isolate branded vs non-branded queries
- Export query-level data from Google Search Console
Performance > Querieswithpageandclickscolumns. - Create a branded keyword list (brand name + common misspellings and product names).
- Apply a filter: label queries that match the branded list as branded; everything else is non-branded.
- Aggregate clicks by
pageandbranded_flagto producebranded_queries_30dandnon_branded_queries_30d.
Normalization formulas for fair comparisons
Normalize by time: Normalized pageviews = pageviews_30d / days_live_in_30d Normalize by traffic volume: Share of channel = pageviews_from_channel / total_pageviews_site Engagement rate normalization: Adjusted engagement = avg_time_on_page (returning_users_30d / total_users_30d)
These formulas account for differing publish dates, site growth, and audience composition so that a post published yesterday isn’t unfairly penalized.
Practical checklist for collection
- Export cadence: weekly automated exports for GA4 and Search Console.
- Canonical key: use
post_idfrom CMS as the primary join field. - Data hygiene: deduplicate URLs, unify trailing slashes, and prefer canonical URLs.
Provide a downloadable master CSV schema and explain each column’s purpose
| post_id | url | title | publish_date | pageviews_30d | branded_queries_30d | avg_time_on_page | returning_users_30d | social_shares_30d |
|---|---|---|---|---|---|---|---|---|
| example_post_1 | https://site.com/post-1 | How to Measure X | 2025-08-01 | 3,420 | 120 | 00:03:24 | 310 | 42 |
| example_post_2 | https://site.com/post-2 | Guide to Y | 2025-07-15 | 1,880 | 18 | 00:02:10 | 95 | 14 |
| example_post_3 | https://site.com/post-3 | Advanced Z Tactics | 2025-06-02 | 5,210 | 45 | 00:04:12 | 720 | 88 |
| example_post_4 | https://site.com/post-4 | Trend Analysis Q | 2025-09-10 | 780 | 5 | 00:01:40 | 22 | 6 |
| example_post_5 | https://site.com/post-5 | Case Study R | 2025-05-20 | 9,600 | 420 | 00:05:30 | 1,450 | 230 |
Key insight: This schema makes join logic explicit—post_id ties CMS metadata to GA4, Search Console, and social exports. Including branded_queries_30d enables direct brand-vs-non-brand segmentation, while avg_time_on_page and returning_users_30d give normalized engagement signals that outperform raw pageviews for content quality analysis.
Understanding these principles helps teams move faster without sacrificing quality. When implemented correctly, this approach reduces overhead by making decisions at the team level.
Calculate Core Brand Metrics for Blogs
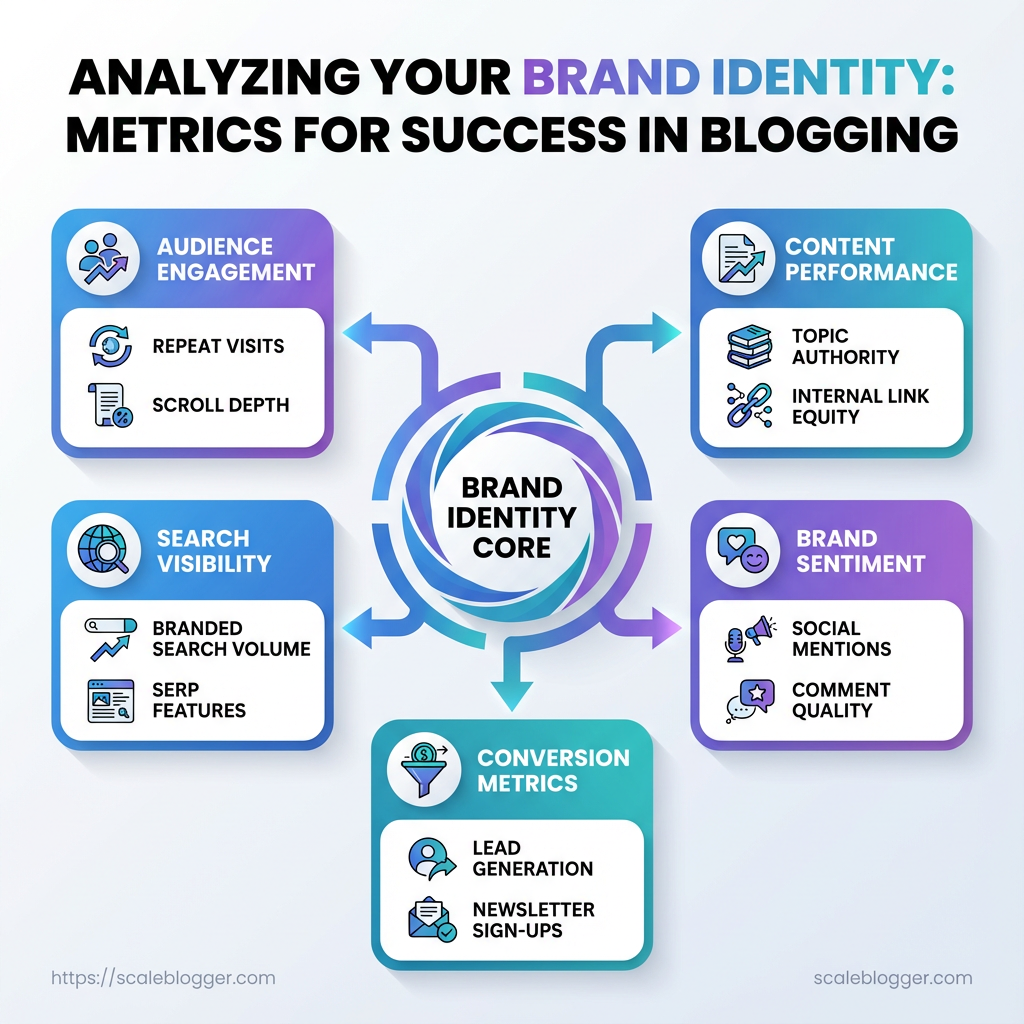
Start by measuring outcomes that map directly to how readers recognize and return to your brand. Metrics that matter for blogs are those that capture discoverability, affinity, attention quality, and executional consistency. Calculate them routinely, compare against historical baselines, and translate each into actions that reinforce brand voice and content positioning.
Branded Search Share: Proportion of search queries that explicitly include the brand name.
Branded Search Share: Calculate as Branded Queries / Total Site Queries 100. Example: if Search Console shows 2,000 branded queries and 50,000 total queries, 2,000 / 50,000 100 = 4%. How it ties to brand: rising branded share signals growing brand awareness and direct demand for your content.
Returning Visitor Rate: Percentage of sessions from returning users in GA4.
Returning Visitor Rate: Calculate as Returning Users / Total Users 100. Example: 4,500 returning users out of 20,000 total users → 4,500 / 20,000 100 = 22.5%. How it ties to brand: higher returning rates indicate sustained utility and reader loyalty—core signals of brand trust.
Share-per-View: Average number of shares per page view across social and on-site share buttons.
Share-per-View: Calculate as Total Shares / Page Views. Example: 300 shares across platforms divided by 150,000 page views → 300 / 150,000 = 0.002 shares/view. How it ties to brand: social amplification per view shows how compelling content is for readers to endorse the brand.
Avg Dwell Quality: Weighted measure combining average session duration and bounce-adjusted engagement events.
Avg Dwell Quality: Calculate as (Avg Session Duration Engagement Rate). Use Engagement Rate = Engaged Sessions / Total Sessions. Example: Avg session 90s, engagement rate 30% → 90 0.30 = 27 (quality score). How it ties to brand: captures whether the audience actually consumes and interacts with brand content versus skimming.
Consistency Index: Simple cadence and topical coverage score from a content audit.
Consistency Index: Calculate as (Published Pieces / Planned Pieces) Topic Coverage Score (0–1). Example: 18 of 24 planned posts = 0.75; topic coverage 0.9 → 0.75 0.9 = 0.675. How it ties to brand: execution consistency directly affects perceived authority and search relevance.
Metric Definitions and Formulas
Summarize each metric, the formula, data sources, and ideal benchmark guidance
| Metric | Formula | Primary Data Source | Benchmark Guidance |
|---|---|---|---|
| Branded Search Share | Branded Queries / Total Site Queries * 100 |
Search Console | Aim for steady growth; 3–8% common for niche B2B, 8–15% for established brands |
| Returning Visitor Rate | Returning Users / Total Users * 100 |
GA4 | Healthy blogs: 15–30% returning; >30% indicates strong loyalty |
| Share-per-View | Total Shares / Page Views |
Social exports + on-site share logs | Target increase over time; 0.002–0.01 common early, top content >0.02 |
| Avg Dwell Quality | Avg Session Duration * Engagement Rate |
GA4 engagement metrics | Higher is better; use historical baseline for target improvements |
| Consistency Index | (Published / Planned) * Topic Coverage |
Manual content audit + CMS | Aim >0.7; <0.5 signals process or resourcing issues |
Key insight: These metrics combine search visibility, behavioral engagement, social endorsement, and operational execution. Tracking them together highlights whether brand-strength comes from awareness, product-market fit in content, or repeatable publishing discipline.
Practical next steps: schedule a monthly pull from GA4 and Search Console, export social share totals, and run a quarterly manual content audit. Use the numbers to prioritize content that reinforces brand phrases, fosters repeat readership, and improves shareability. Understanding these calculations lets teams move faster without sacrificing signal quality, and it makes decisions defensible across editorial and growth stakeholders.
Scale your content workflow with automation where measurements repeat each month to free the team for creative work.
Analyze Results and Identify Brand Strengths & Weaknesses
Start by translating raw metrics into a narrative about where the brand gains attention and where it loses momentum. Look beyond vanity numbers: segment performance by channel, content type, audience cohort, and intent. That segmentation reveals patterns—what resonates with repeat visitors, which pieces convert casual readers, and which topics attract high-qualified traffic but fail to convert.
Diagnose using segmentation and comparative lenses
Segment by channel: Break out organic search, referral, social, and email to see which drives sustained engagement. Segment by content type: Compare how-to posts, long-form guides, and product pages perform on avg_time_on_page and bounce_rate. Segment by audience cohort: New vs returning visitors, device type, and acquisition source reveal different intent and friction points.
- High-CTR, low-conversion: Indicates interest but weak conversion funnel or misaligned CTA.
- High-engagement, low-traffic: Content worth amplifying—repurpose and expand.
- Low-engagement, high-traffic: Technical or relevancy issues; check load times and search intent match.
Convert insights into prioritized experiments
- List top 8 findings and map each to an objective and metric to move (
increase leads,reduce churn,improve form completion rate). - Score each experiment by impact (potential lift) and effort (development hours), then rank using an
impact/effortmatrix. - Design rapid A/B tests for the top 3 experiments with clear hypothesis, variant description, target audience, and duration.
- Implement tracking: ensure
conversion_rate,micro_conversions, andassisted_conversionare instrumented before launching tests.
Examples and quick wins
- Example — Topic cluster boost: Expand a high-performing pillar into three long-tail posts, link internally, and add a clear mid-funnel CTA to capture intent-driven leads. Measurable result: higher time-on-site and new leads from organic traffic.
- Example — CTA refinement: Replace a generic “Learn More” with context-specific CTAs on pages with high exit rates; track lift in click-through and downstream conversions.
Impact vs effort matrix: Create a simple 3×3 spreadsheet—rows for impact, columns for effort—to visually prioritize where to run experiments first.
This stage converts analytics into actionable experiments that isolate brand strengths and expose weaknesses to fix. When executed with disciplined tracking and rapid iteration, the analysis becomes the engine for measurable brand improvement and smarter content investments.
Scale your content workflow for automated benchmarking and performance tracking when scaling these experiments.
Run Tests and Iterate on Brand Signals
Start by framing a test as a discrete learning loop: a hypothesis tied to a measurable brand metric, a short timebox to run it, and a clear decision rule that dictates the next action. This keeps experiments from drifting into opinion-driven changes and forces alignment around observable shifts in brand signals like share of voice, referral sources, average session depth, or branded search lift. Use lightweight instrumentation up front so every test reports reliably.
Experiment Playbook and Measurement
- Formulate the hypothesis and metric.
- Create a one-sentence hypothesis that ties an action to a brand metric.
- Define the primary metric (
brand metric) and one safety metric to catch negative side effects. - Set a timebox and sampling rule (e.g.,
14 days, minimumn=500sessions or50 organic conversions). - Log experiment metadata: owner, start date, tracking IDs, and rollback criteria.
- Instrument and launch.
- Add
UTMtags and a feature-flag or A/B tool toggle. - Verify analytics events in a staging environment and run a smoke test for 48 hours.
- Publish with a controlled audience slice (e.g., 10–25%) to limit exposure.
- Monitor and collect.
- Track daily snapshots of the primary and safety metrics.
- Capture qualitative signals: user feedback, search console impressions, and backlink mentions.
- Maintain a running log of anomalies and external events (campaigns, algorithm updates).
- Analyze and decide.
- Use pre-registered success criteria (e.g., +12% branded search lift and no negative UX regressions).
- If criteria met, plan rollout and update the content playbook.
- If inconclusive, extend the timebox or adjust sample targeting.
- If negative, roll back and run a root-cause postmortem.
- Clear hypothesis: One-line statement linking change to metric.
- Defined timeline: Short timeboxes reduce noise and opportunity cost.
- Success criteria: Numeric thresholds prevent post-hoc rationalization.
- Safety checks: Prevent brand erosion by monitoring UX and conversions.
- Documentation: Every experiment must be reproducible and searchable.
Provide a sample experiment timeline with milestones and measurement checkpoints
| Phase | Duration | Key Activities | Deliverable |
|---|---|---|---|
| Preparation | 5 days | Hypothesis, instrumentation plan, tracking IDs | Experiment brief |
| Launch | 1 day | Controlled rollout to 10–25% audience | Live variant + tags |
| Monitoring | 14 days | Daily metric snapshots, qualitative notes | Monitoring log |
| Analysis | 3 days | Statistical check, segmentation, anomaly review | Results report |
| Decision | 2 days | Rollout/iterate/rollback decision, playbook update | Decision memo |
Key insight: A compact timeline reduces external variance and forces clarity on what “success” looks like. Well-instrumented short tests let teams scale learnings quickly without risking core brand equity.
When tests are run consistently and documented, iteration becomes discipline rather than guesswork. Teams move faster and preserve brand integrity while optimizing for measurable gains, and platforms like Scaleblogger.com can automate parts of the pipeline to keep experiments reproducible and auditable.
Report, Communicate, and Institutionalize Learnings
Start by turning experimental results into a narrative that answers stakeholder questions: what changed, why it mattered for target brand metrics, and what the recommended next steps are. A disciplined, repeatable reporting format prevents one-off insights from being lost and makes blog analytics and performance measurement actionable across the team.
One-page executive summary template
- Problem statement — one sentence describing the hypothesis or experiment goal.
- Result snapshot — Primary metric: value change; Secondary metric(s): supporting changes; Confidence:
p < 0.05or qualitative confidence. - What moved the needle — two short bullets explaining causal levers.
- Recommendation — clear next action with estimated effort and projected impact.
- Risks & open questions — one-line unknowns to address.
- Next checkpoints — date for follow-up and owner.
Primary metric: The single KPI the experiment was designed to affect (traffic, conversions, time on page).
Secondary metrics: Supporting signals such as bounce rate, scroll depth, or SERP position.
Owner: Team member responsible for follow-up and implementation.
Dashboard chart list and purpose
- Trend of organic sessions: Shows sustained traffic changes versus campaign spikes.
- Conversions by landing page: Identifies which blog posts drive leads or subscriptions.
- Keyword position distribution: Tracks SEO wins and losses across the cluster.
- Engagement funnel: Visualizes impressions → clicks → time-on-page → conversion drop-off.
- Content scoring heatmap: Rates posts by traffic, backlinks, and conversions to prioritize updates.
Each chart should include the time window, segment filters, and a one-line interpretation.
Governance cadence and role assignments
- Monthly strategy review: cross-functional stakeholders review dashboard highlights and approve pivots.
- Weekly content standup: editors and SEO specialists review quick wins and blockers.
- Quarterly deep dive: product, analytics, and content leadership validate measurement frameworks and update
playbooks.
Content Lead: Sets priorities and signs off on changes.
Data Analyst: Verifies metrics, maintains dashboards, and flags anomalies.
Engineering/Automation Owner: Implements pipelines and publishing changes.
Stakeholder Sponsor: Allocates budget and removes organizational blockers.
Institutionalizing learnings requires templates, a predictable meeting rhythm, and named owners who close the loop. Consistent reporting converts isolated experiments into scalable improvements in brand metrics and long-term content performance. This approach frees creators to iterate faster while keeping decisions anchored in clear performance measurement.
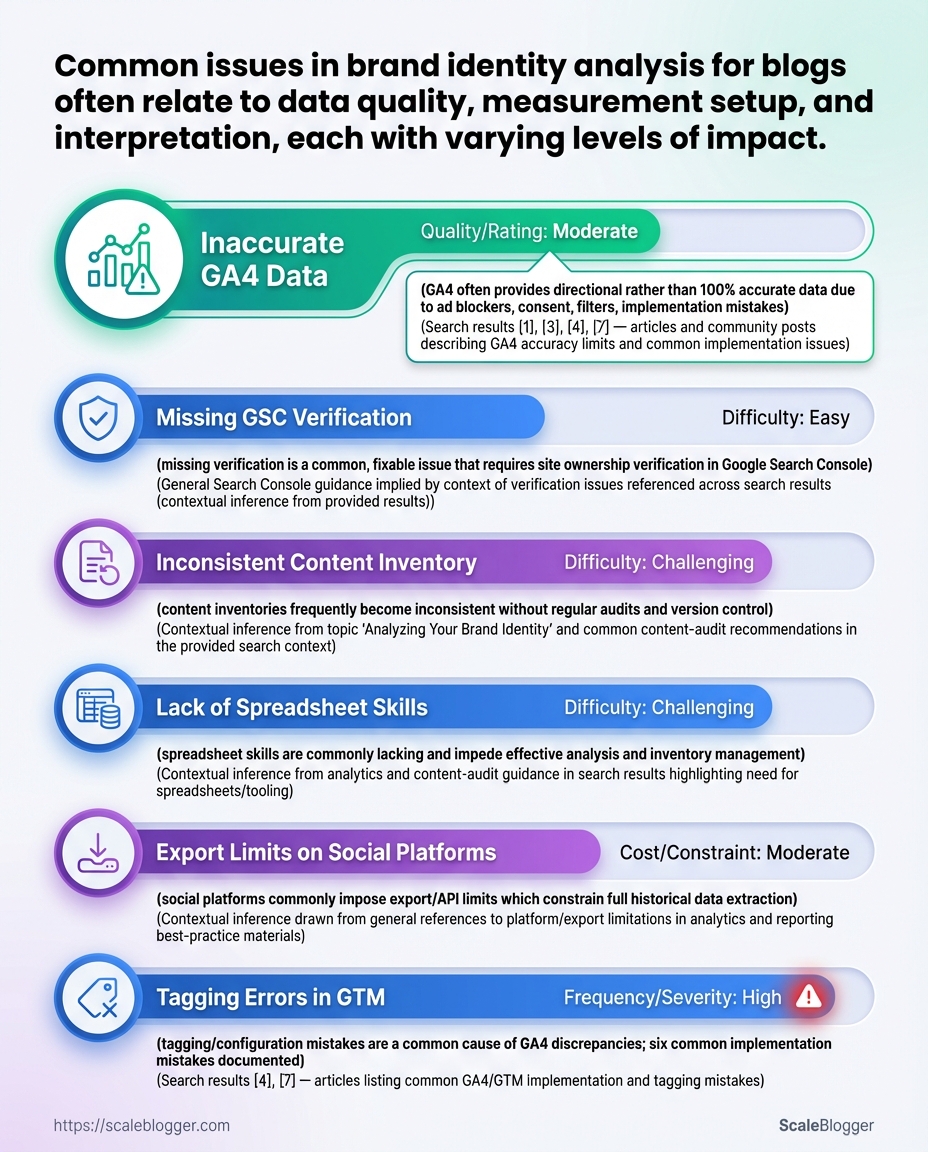
Troubleshooting Common Issues
Misattribution, missing analytics, and low-sample experiments are usually symptoms of predictable measurement gaps; fix them by systematically validating tags, traffic sources, and experiment design rather than chasing anomalies. Start by treating data problems as engineering tasks: reproduce the issue, isolate the failing component (UTM, tag, filter, or sample size), and iterate until the metric stabilizes. That approach reduces firefighting and surfaces process failures you can prevent.
Common failure modes and quick diagnostics
Misattribution: When sessions jump between channels after a campaign, check UTM consistency and redirect behavior.
UTM drift: When UTMs are appended inconsistently across platforms, traffic fragments into multiple source/medium rows.
Tag loss: When analytics drops suddenly, the site or tag manager is blocking or failing to fire.
Low-sample experiments: When treatment differences are volatile, the experiment lacks statistical power or has biased randomization.
Step-by-step fixes
- Reproduce the problem in a controlled environment.
- Validate UTM canonicalization.
- Inspect redirects and referrer behavior.
- Audit tag deployment.
- Adjust experiment setup for power.
- Apply server-side fixes where client-side fails.
Use a private browser profile and ?utm_source=test to trace how the URL appears in GA4 DebugView.
Ensure all channels use the same utm_source, utm_medium, and utm_campaign naming convention.
Follow the full redirect chain and confirm referrer and UTM parameters persist after 302/301 hops.
Check dataLayer pushes and Tag Manager triggers; use browser devtools to verify the gtag or analytics.js payloads.
Calculate required sample size and extend the test or pool segments when real traffic is insufficient.
Move critical attribution logic to the server to avoid adblocker and browser privacy losses.
Practical checks and examples
- Quick UTM scan: Search your CMS for
utm_to find inconsistent naming. - GA4 missing data: Compare DebugView events to production reports to find processing thresholds.
- Low-sample hack: Use stratified sampling to stabilize small segments without increasing runtime.
UTM: Tags appended to URLs to identify campaign parameters.
Misattribution: Traffic incorrectly assigned to the wrong channel due to broken UTMs or redirects.
Low-sample experiment: A/B test with insufficient visitors to reach reliable effect sizes.
Consider integrating automated checks into the publishing pipeline so UTMs, tags, and experiment flags validate before going live—tools and services that automate those checks, including AI-driven pipelines like Scaleblogger.com, reduce recurring breakdowns. Understanding and fixing these issues at the source keeps analytics trustworthy and decisions defensible.
📥 Download: Brand Identity Analytics Checklist (PDF)
Tips for Success (Pro Tips and Best Practices)
Start by making repeatable actions automatic: that single move reduces manual errors and turns raw metrics into reliable inputs for decisions. Automate the parts of your analytics pipeline that are predictable, then focus human effort on interpretation and creative optimization.
Automate data pulls: Schedule daily or weekly exports from analytics tools into a central data warehouse or sheet. Use APIs or connectors to avoid manual CSVs.
Isolate branded traffic cohorts: Create segments for branded vs. non-branded traffic so attribution and content ROI aren’t skewed by brand searches.
Use event tracking for micro-conversions: Track newsletter signups, time-on-page thresholds, scroll depth, and CTA clicks as discrete events to build richer funnels.
Practical setup steps
- Connect data sources.
- Define cohorts and events.
- Automate reporting.
Use native APIs or an ETL tool to pull Google Analytics, Search Console, and CMS metrics into one store.
Map which queries count as branded and which events map to engagement.
Build a dashboard that refreshes automatically and flags anomalies.
Operational best practices
- Standardize naming: Enforce
UTMconventions for campaigns so automated joins don’t break. - Version your tracking: Keep a changelog for
gtagor tag-manager updates to prevent data drift. - Sample and validate: Periodically reconcile automated pulls against raw platform exports.
that scale
- Campaign cohorting: Segment search queries containing the brand name and compare lifetime value vs. non-branded cohorts.
- Micro-conversion funnel: Track
newsletter_signup→first_click→lead_form_submittedas separate events to find where attention drops. - Automated anomaly alerts: Use threshold rules to trigger Slack alerts when organic traffic deviates more than 20% week-over-week.
Definitions
Branded traffic: Visits originating from searches that include your brand name or variations.
Micro-conversion: Any tracked action that indicates engagement but isn’t the final conversion.
Consider tooling that reduces repetitive work—automation platforms and content pipelines can be integrated to pull analytics, gate content experiments, and keep editorial teams aligned. Scale your content workflow when automation is used to enforce consistency and speed decisions. Understanding these principles helps teams move faster without sacrificing quality.
Appendices: Templates, Checklists, and Formulas
Start with ready-to-use assets so the team can move from planning to execution in one session. Below are copy-ready CSV headers, practical Sheets formulas, and an editorial brand-check checklist designed to plug directly into an AI-powered content pipeline and reduce back-and-forth during execution.
Downloadable templates and where to place them in the workflow
| Template | Purpose | Format | Recommended Use |
|---|---|---|---|
| Master CSV schema | Canonical source for bulk uploads (posts, authors, tags, publish dates) | CSV | Use at campaign kickoff for batch imports into CMS or automation tools |
| Executive Summary template | One-page performance snapshot for stakeholders | Google Doc / DOCX | Post-quarter reporting and briefings; attach to analytics exports |
| Experiment plan template | A/B test hypotheses, metrics, sample size, timeline | Google Sheet | Use before running content experiments or traffic experiments |
| Editorial brand checklist | Ensure voice, facts, SEO, and accessibility consistency | Google Sheet / Checklist | Final step before scheduling; gate for publishing pipeline |
| Sheets formula snippets | Reusable formulas for reporting and transformation | Google Sheet | Drop into analytics workbook for rollups and alerts |
Key insight: The templates focus on handoffs—data ingestion, decision records, experiment governance, and last-mile editorial quality. Placing the Master CSV and Editorial brand checklist early prevents rework; formula snippets automate reporting so decisions happen faster.
Master CSV header (copy-ready) authors,slug,title,publish_date,tags,status,word_count,primary_category,meta_description,canonical_url
Practical Sheets formulas (copy-paste examples) 1. =IMPORTRANGE("sheet_url","Sheet1!A1:Z") — import external CSV exports into a workspace
=QUERY(IMPORTRANGE("sheet_url","Sheet1!A1:Z"),"select Col1, sum(Col5) where Col3='published' group by Col1",1)— aggregated published performance=ARRAYFORMULA(IFERROR(VLOOKUP(A2:A,LookupRange,2,FALSE),""))— bulk enrich slugs with category keys=SPLIT(B2,";")— turn semi-colon tag strings into rows for taxonomies=IFERROR(REGEXEXTRACT(C2,"https?://([^/]+)"),"")— extract domain for backlink checks- Run import into staging CMS and execute
Sheets formula snippetsto populate performance baselines. - Apply Editorial brand checklist as automated gating step before publish.
- Feed post-mortem into Experiment plan template for iterative learning.
Editorial brand-check checklist (each item on its own line) Brand voice: Matches tone-of-voice guide for target persona.
Accuracy: All claims have source links or verified data.
SEO elements: Title ≤ 60 chars, primary keyword in H1, meta present.
Internal linking: At least two contextual internal links with anchor text.
Accessibility: Images have alt text; headings are hierarchical.
Publish readiness: Slug, canonical, and publish_date set.
Automation-ready workflow (quick steps) 1. Export content plan to the Master CSV.
Including these assets in the content pipeline reduces friction and standardizes quality across teams. For teams adopting automation, tools like Scaleblogger.com integrate these templates into an AI-powered content workflow to accelerate execution without losing editorial rigor. Understanding and using these templates makes routine publishing repeatable and measurable, freeing creators to focus on high-impact work.
Conclusion
You now have a practical framework for turning vague indicators into measurable brand signals: define the identity you want, structure the data consistently, calculate a concise set of brand metrics for your blog, and treat tests and reporting as part of the editorial workflow. Teams that moved from ad-hoc reporting to a repeatable measurement loop saw clearer correlations between post formats and reader trust, and those quick experiments made it obvious which headlines and CTAs actually improved dwell time. If you’re wondering how often to run these checks, start monthly; if the question is who owns it, assign a content analyst to pair with the editor; and if tooling is the blocker, prioritize automation that exports event-level data into a single reporting table.
For tangible next steps, pick three brand metrics to track this quarter, automate data collection, and run a low-cost A/B test on one headline or subscription flow. To streamline this process, platforms like Scaleblogger can automate report pipelines and surface the brand insights that matter most—Automate your blog analytics and brand measurement with Scaleblogger. For a quick refresher on templates and formulas used in this piece, see undefined.
